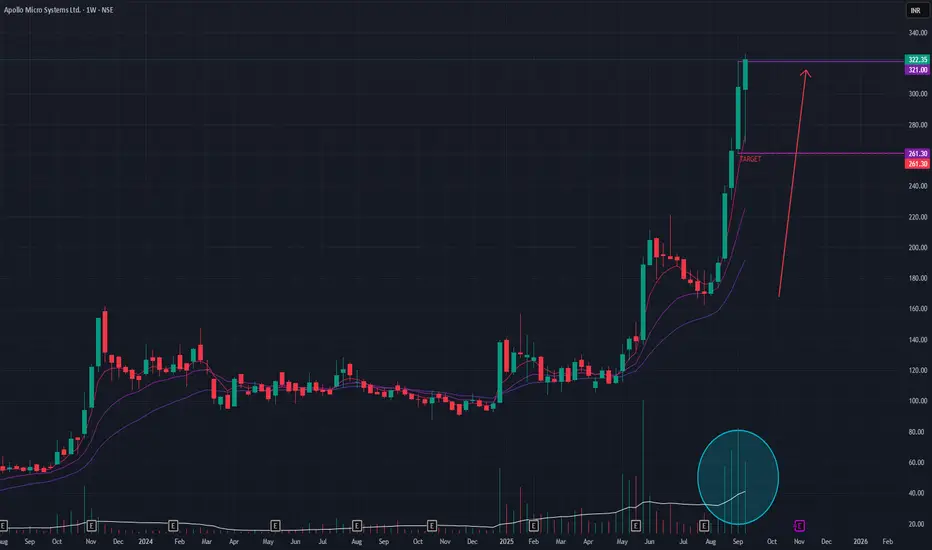
Apollo Micro Systems (Weekly Timeframe) - Momentum to continue ?Apollo Micro Systems has been in a steep, aggressive uptrend since August 2025, delivering a remarkable +92% return in a short period. The stock is exhibiting classic signs of strong bullish momentum, but the velocity of the rise warrants a closer look at its sustainability.
## Bullish Momentum Indicators 📈
Exceptional Volume: The rally has been supported by extraordinary trading volume for the past four to five weeks, indicating significant and sustained buying interest.
Technical Strength: The short-term Exponential Moving Averages (EMAs) are in a Positive Crossover (PCO) state, confirming the powerful upward momentum.
Buyer Conviction: The recently formed weekly candle indicates strong demand and suggests that buyers remain in control of the trend.
## Outlook and Key Levels
While the trend is undeniably strong, the rapid ascent raises the possibility of near-term profit-booking. Such a pullback could be a healthy correction, potentially offering more favorable entry points for those who missed the initial move.
Upside Potential: If the current momentum continues, the stock could surge towards the next logical target of ₹376.
Downside Risk: A correction or loss of momentum could see the stock pull back to test the support level around ₹261.
In summary, while the underlying trend remains powerful, traders should be mindful of the potential for increased volatility after such a sharp and rapid advance.
Apollomicrosystems
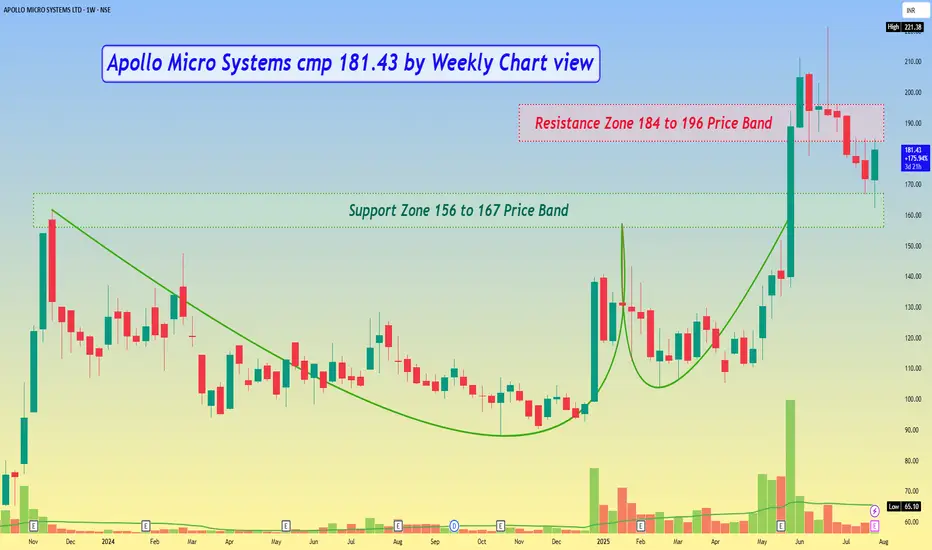
Apollo Micro Systems cmp 181.43 by Weekly Chart viewApollo Micro Systems cmp 181.43 by Weekly Chart view
- Support Zone 156 to 167 Price Band
- Resistance Zone 184 to 196 Price Band
- Support been tested retested since last week
- Volumes gradually closing in with avg traded quantity
- Price staging above EMA 20, 50, 200 with positive MACD, RSI, SAR
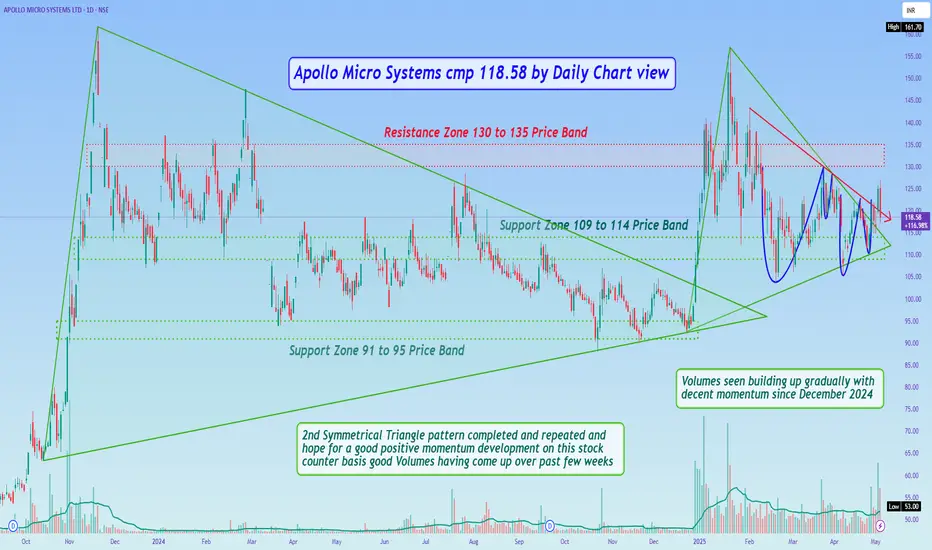
Apollo Micro Systems cmp 118.58 by Daily Chart viewApollo Micro Systems cmp 118.58 by Daily Chart view
- Support Zone 109 to 114 Price Band
- Next Support Zone at 91 to 95 Price Band
- Resistance Zone seen at 130 to 135 Price Band
- Volumes seen building up gradually with decent momentum since December 2024
- Back to Back Bullish Rounding Bottoms completed by neckline of the Falling Resistance Trendline and upcoming fairly strong Resistance Zone Price Band hurdle to cross over
- 2nd Symmetrical Triangle pattern completed and repeated and hope for a good positive momentum development on this stock counter basis good Volumes having come up over past few weeks
Apollo Micro Systems cmp 102.25 by Daily Chart viewApollo Micro Systems cmp 102.25 by Daily Chart view [ /b]
- Stock Price sustaining its upwards momentum post test retest of Support Zone Price Band
- Keep the stock on your watchlist for it's slow, steady and stable walk upside along Rising Support Trendline

Apollo - Flag breakout - Defence - ElectronicsApollo micro system is making flag breakout. Defence as a sector is extremely overvalued. Even apollo is trading at high valuations.
