APOLLOTYRE : adjusting its base.📘 APOLLOTYRE – Technical Analysis & Trading Plan
(Chart timeframe: Daily | Structure & Wave-based analysis)
🔍 Market Structure Overview
APOLLOTYRE has already signaled a Change of Character (CHoCH) after breaking its prior bearish structure, confirming a trend transition from distribution to accumulation. Since then, price has respected higher lows and moved within a rising structure.
Currently, price is correcting within a healthy pullback phase, aligning with a Wave 4 retracement, while the broader trend remains bullish.
📐 Key Technical Zones (From Chart)
• Wave 4 Completion / Demand Zone: 492 – 510
• Invalidation Level / SL: 488.55 (Day close below)
• First Target Zone: 546 – 553
• Second Target: 570
📊 Technical Interpretation
The ongoing decline appears corrective rather than impulsive, suggesting trend continuation bias.
Price is consolidating above the rising trendline, indicating structural strength.
The 492–510 zone overlaps with prior demand and trendline support, making it a high-probability accumulation area.
Holding above 488.55 keeps the bullish structure intact.
A sustained move above recent swing highs confirms Wave 5 activation.
🎯 Prediction / Probable Scenario
If price holds above 492–510, APOLLOTYRE is likely to resume its upward trajectory.
Initial expansion expected toward 546–553, where partial profit booking is advisable.
Acceptance above the first target zone may extend the rally toward 570.
Failure to hold 488.55 would invalidate the bullish count and open room for deeper correction.
🟢 Buying Strategy (Swing / Positional)
Buying Zone: 492 – 510 (on confirmation / bullish price action)
Stop Loss: Day close below 488.55
Target 1: 546 – 553
Target 2: 570
Maintain partial profit booking at Target 1 and trail SL for positional continuation.
This setup offers a favourable risk–reward structure, suitable for capturing a potential impulsive Wave 5 move.
🎓 Educational Notes for Traders
CHoCH (Change of Character) signals early trend reversal before traditional indicators.
Wave 4 corrections are typically sideways or overlapping and should not break key demand zones.
Strong trends correct in price and time, not always deeply in price.
The best trades emerge when structure, trendline, and demand zones align.
Always wait for price confirmation, not prediction.
🧠 Risk Management Reminder
• Avoid over-leveraging during corrective phases
• Respect day-close based stop losses
• Risk only 1–2% capital per trade
• Partial booking improves psychological discipline
⚠️ Disclaimer
I am not a SEBI-registered analyst. This analysis is for educational purposes only and should not be considered financial advice. Please consult your financial advisor before taking any trade.
APOLLOTYRE

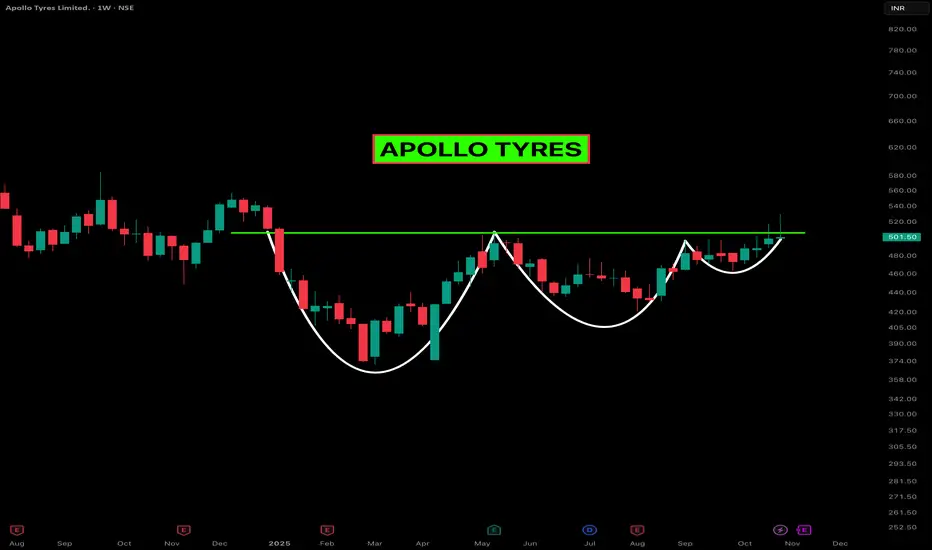
APOLLO TYRES – Volatility Contraction Breakout in MotionApollo Tyres is showing some serious strength on the weekly chart. After months of squeezing inside a clean Volatility Contraction Pattern (VCP), the stock has finally started to break above the neckline zone around ₹500–₹520 — a level that’s acted as a ceiling multiple times in the past.
The structure is textbook — each pullback getting shallower, each base tighter, and now price pushing through resistance with conviction. That gradual reduction in volatility often signals institutional accumulation before a potential expansion move.
Momentum candles are widening, and while volume hasn’t exploded yet, it’s picking up — hinting that buyers are stepping in early. A retest toward the breakout zone wouldn’t be out of place, but as long as it holds above that ₹500 handle, the setup stays healthy.
Overall, it’s one of those quiet, technically strong setups that tend to move sharply once confirmed.
Let’s watch if bulls can keep control in the coming sessions — this chart definitely deserves to stay on the radar.
Check out my profile and follow me for more breakout setups like this one.
Apollo Tyres - BullishBreak of strong resistance is done
Now at pullback
Old resistance can now become support
Looks good near 512 - 515
Close below 508 will negate the view
Keep in radar ...

Analyzing Apollo Tyre : an opportunity to go LongApollo Tyre appears to present a favorable opportunity for a long position. I've outlined the entry price, stop loss, and target levels for this stock within the chart.
Please keep in mind that these are my personal opinions, and I don't recommend you follow them as stock tips. I encourage you to study the chart and share your feedback so that we can collectively enhance our understanding as a community.

APOLLOTYRE tecchnical analysisHi traders...
Refer to chart of APOLLOTYRE
following key points seen in chart which indicate forr bullish view.
1. stock reversed from demand zone
2. taking support of 100 ma
3. stock forming double bottom
stock looking bullish for 400+ levels.

APOLLO TYRE BIG FALL EXPECTEDShort Apollo Tyre once sustain below 390 for the marked targets on the chart until 413 is intact on the upside.
To motivate us, Please like the idea If you agree with the analysis.
Happy Trading!
InvestPro India Team

Apollotyre Long opportunity Apollotyres looks bullish, Price rejected from all time high supply levels and
Price is trying to cross all time high again with good volume,
Higher time frame candles also looks strong and there is small cup pattern in daily time frame,
we may see price breaking all time high and move towards 315/330 levels very soon or
it may consolidate some time and go to higher levels.

YR 2022 Idea #124: Long on APOLLOTYREThis is a public swing trade idea and is only for Learning and observational purpose. Please understand your risk and take full responsibility of your actions. I might trail my stoploss after I get an entry but even if my original Stoploss hits, i exit the trade with pre-planned loss (risk). At target, I book usually 75% positions and trail stoploss for rest. Our objective to help anyone who wants to learn technical analysis using charts by demonstrating my real trade entries. You can post your queries in comment section here and we will try to answer them asap.

Analysis for Monthly Chart of ApollotyreKeep the stock on the radar for the breakout of Resistance1 (262)
This breakout of Resistance1 will also give the breakout of Ascending Triangle Pattern.
The stock has the potential to become an Multibagger stock.
Important Points
Ascending Triangle Pattern
The Resistance and the Upper Length of Ascending Triangle are at the same level.
Analysis of Pattern
Formation of Ascending Triangle Pattern
The Resistance and the Upper Length of Ascending Triangle are at the same level.
Analysis of Moving Averages
The stock had started its correction in April 2018, which was completed by testing its 200ema.
During correction the four ema of 20,50,100,200 periods comes close.
From Dec 2020 the stock has been consolidating by trading above the four ema lines.
The Expansion and Contraction of moving averages makes a wave like pattern

Apollo Tyre Chart Analysis !!📈 Apollo Tyre 📉
My Findings :-
1. Breakout from a swing high and Resistance Zone.
2. Close above March high.
3. Higher High and Higher Low formation.
4. Auto Sector is in Uptrend.
Bias- Long
Target- 227, 243 and 259
SL- 187
RR- 1: 2
All Important Supports and Resistances are drawn in chart.
All levels are of Spot and on closing basis.
Disclaimer : Consult Your Financial Advisor Before Taking Any Decision On This Analysis.


APOLLO TYRENSE:APOLLOTYRE
Watchlist for tomorrow 4 feb 2022.
1 hr trend analysis of 4 feb comapany analysis.

Will bull traders drive Apollotyer above Rs.300?Preface
APOLLOTYER is preparing for a bull run. After completion of the 3rd wave at 261.2. Price had started a corrective wave ((4)) and took 38 weeks to finish this structure.
A trader can trade impulsive wave ((5)) to make a high confidence trade setup.
Wave Formations and Fibonacci relationships:
Wave ((1))is an impulse with a 5-3-5-3-5 wave structure.
Wave ((2)) is a zigzag move. Fibonacci retracement of wave 2 is 50% of 1st impulsive wave at 109.55. Sub-wave of wave 2 fulfilled the rule of equality (wave A= wave C)
Wave ((2)) is not exceeding the starting point of wave 1.
Wave ((3)) is an extensive impulse. 3rd wave has 261.8% retracement of 1st impulsive at 261.
Wave ((4)) is a triple three with a 3-3-3-3-3 wave structure.
It retraced 38.2% of the 3rd wave and did not overlap the starting point of wave 1.
What will happen next?
Completion of sub-wave z indicates that the corrective wave has ended. Price has started forming sub-waves of wave 5.
The sub-wave z of wave ((4)) has formed a descending channel.
If the price breaks descending channel and close above sub-wave ((b)) at 237, it will confirm the impulsive behavior.
(Note that the ending point of the corrective wave is the starting point of an impulsive wave.)
A trader can expect the following targets:237-250-279-297+
Target 1: 237
Target 2: 250
Target 3: 279
Target 4: 297+
The safe traders can wait for the breakout of wave X.
If the price fails to break the wave X, correction is about to make a new leg down.
They can enter on the pullback to enter where they can manage risk with tight stop loss.
Invalidation: pullback can't break the low of wave ((4))

Apollo tyre FLag BO on daily & weeklyNSE:APOLLOTYRE
buy near 233 - 236
only risky trader can enter now at 240-243
SL closing below 225
T 247, 260
above 260 as weekly flag can see 280 & 320

Apollo Tyres Ltd - 07.01.2022Apollo Tyres Ltd - 07.01.2022
The stock is trading @ 233 levels
There is a strong resistance zone @ 239 levels
The prices are above ema
There is a Triple MACD Bullish Divergence in Weekly Chart
Stochastic is overbought
RSI is overbought
watch out for the price actions

Apollo Tyres Ltd - 23.12.2021Apollo Tyres Ltd - 23.12.2021
The stock is trading @ 210 levels
Let the prices go above 215
There is a MACD Bullish Divergence in Weekly Chart
The prices are near EMA
One can initiate a buy position above 215 with support @ 207
Watch out for the price action


APOLLOTYRE: Channel pattern breakoutAPOLLOTYRE breaking out the resistance of channel pattern and sustained the level. Considering the consolidation above resistance signifying the quick up-move followed by the consolidation.
Entry: 241.50
Stoploss: 233.20
Target: 259.95

APOLLOTYREIt has taken a support at 200 MA.
Can give a good move above 221 for targets of 230 and 240

APOLLOTYRE - Ready to breakoutAPOLLOTYRE has been facing resistance at 235-236 level since a long time. It has tested it many times.The more times a stock hits a level again and again , it becomes weak. And can be broke easily.
APOLLOTYRES
Buy-Above 235
Sl-220
T- 260 280 300

NEXT TARGET WILL BE 200-APOLLO TYERS trading on triangle pattern exerting to break upside for complete the pattern now its trading on down trend target will be 200...
LAUNCHING SUB BROCKER SOON SUPPORT US...
SUPPORT :
LIKE AND FOLLOW

Apollo Tyres Prediction for 4th Week SEP 2021Breakout is already confirmed with successful correction. Good buy above 225 with an SL below 221 for targets of 230, 245 and 260.

