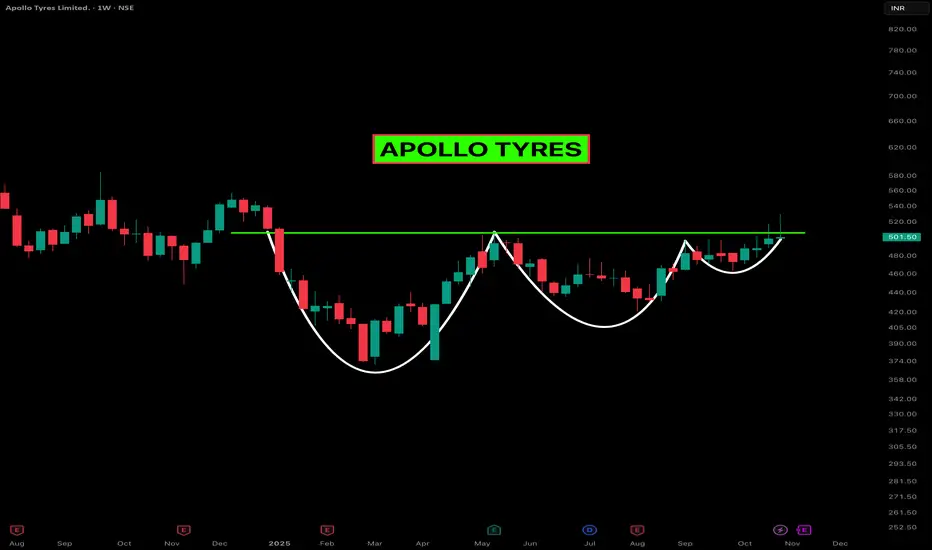
APOLLO TYRES – Volatility Contraction Breakout in MotionApollo Tyres is showing some serious strength on the weekly chart. After months of squeezing inside a clean Volatility Contraction Pattern (VCP), the stock has finally started to break above the neckline zone around ₹500–₹520 — a level that’s acted as a ceiling multiple times in the past.
The structure is textbook — each pullback getting shallower, each base tighter, and now price pushing through resistance with conviction. That gradual reduction in volatility often signals institutional accumulation before a potential expansion move.
Momentum candles are widening, and while volume hasn’t exploded yet, it’s picking up — hinting that buyers are stepping in early. A retest toward the breakout zone wouldn’t be out of place, but as long as it holds above that ₹500 handle, the setup stays healthy.
Overall, it’s one of those quiet, technically strong setups that tend to move sharply once confirmed.
Let’s watch if bulls can keep control in the coming sessions — this chart definitely deserves to stay on the radar.
Check out my profile and follow me for more breakout setups like this one.
Apollotyreanalysis
APOLLOTYRE – Reversal in Play After 5-Wave Decline
# 📊 \ APOLLOTYRE – Bullish Reversal on 60-Min Chart\
🔍 \ Completed 5-Wave Down → ABC Correction → Support Reaction\
---
## 🟦 \ Support Zone: ₹439.52 – ₹444.40\
📌 This critical demand zone includes:
• TS3 Low
• End of corrective wave
• Strong volume cluster (smart money reaction)
➡️ Price bounced after touching this zone, suggesting accumulation and bullish intent.
---
## 🟨 \ Immediate Resistance: ₹460–₹465 at minor wave C completion zone\
🚧 First supply zone where price may pause or face intraday rejection.
✅ A clean breakout above ₹465 can open doors for a sharper move higher.
---
## 🎯 \ Major Target Zone: ₹482–₹488\
• Swing target zone above ₹460
• If momentum builds above ₹460, expect buyers to drive price toward this zone
---
## 📝 \ Trade Setup: Building a Bullish Structure\
📈 \ Long Entry:\ Around ₹444–₹447 or on a dip near ₹440 with bullish confirmation
🎯 \ Targets:\
• T1: ₹455
• T2: ₹464–₹468
❌ \ Stop Loss:\ Close below ₹438 (beneath Decision Point & TS3 low) hourly closing basis
---
## 🧠 \ Trade Logic & Structure\
• 5-wave downtrend completed → corrective ABC finished
• Reversal triggered from a confluence support zone
• Ideal risk/reward with confirmation via bullish candle or volume spike
• Wait for confirmation on lower timeframes (15–30 min) for early entry
---
## ⚠️ \ Risk Management Tips:\
• Keep SL tight and well-defined
• Avoid chasing breakout if price consolidates below ₹444 without conviction
• Scale in position only if price holds above entry zone
---
📌 \ Conclusion:\
APOLLOTYRE is setting up for a potential swing reversal. If ₹450 is crossed with strength, ₹465–₹482-488 becomes a realistic upside target. Trade with SL discipline and wait for volume-led breakout.
-

Apollo Tyres Swing Long Update- Apollo Tyres is currently trading at 526.7
- Apollo Tyres already gave an upside of 4% from my entry and now it is setting up for a huge expansionary move
- Apollo tyres will be at a lovely spot if you see it falling back or revisiting 512-519
- I will be interested to see Apollo tyres revisiting the same area to add a huge size
- Please don't add size or take entries based on my opinion try to first manage risk according to your corpus and make sure you don't follow my advices blindly
- Overall invalidation of this trade will be below 497

Apollo Tyres - BullishBreak of strong resistance is done
Now at pullback
Old resistance can now become support
Looks good near 512 - 515
Close below 508 will negate the view
Keep in radar ...

Apollo Tyres Swing Long Setup - Apollo Tyres is currently Trading at 507
- Apollo Tyres has a bullish structure shift and so far making higher highs
- Apollo Tyres looks all set to purge and print candles above 520
- Look to add swing longs in Apollo T when you see it around 499-505
- Keep a wide sl of 3% from your entry and watch it print 1:2 easily

Apollo Tyres : Breakout Candidate#apollotyre #breakout #swingtrade
Apollo Tyre : Swing Trade
>> Breakout candidate
>> Trending setup
>> Good Volumes & Strength
>> Low Risk High Reward Trade
Swing Traders can lock profit at 10% and keep trailing
Please give a Boost or comment if u r Liking the analysis & Learning from it. Keep showing ur Love by following
Disclaimer : This is not a Trade Recommendations & Charts/ stocks Mentioned are for Learning/Educational Purpose. Do your Own Analysis before Taking positions.
