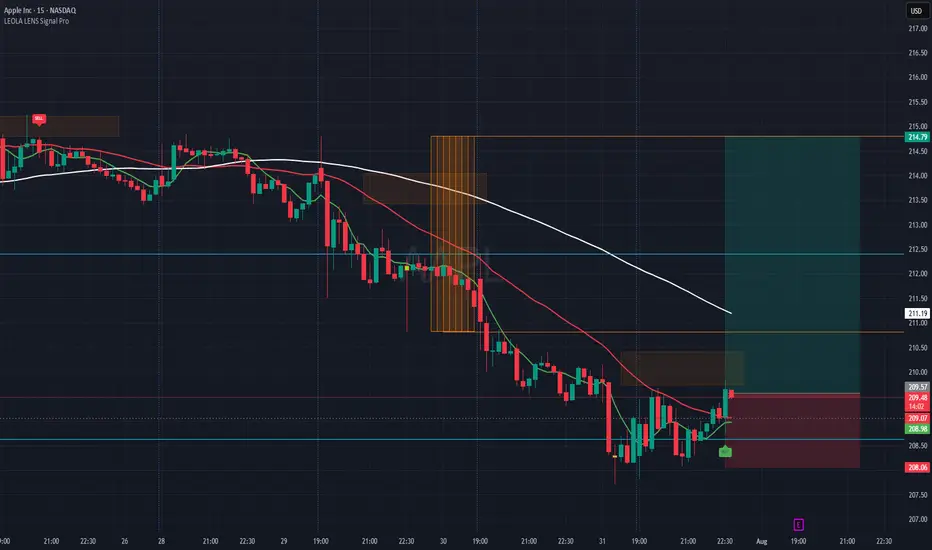
AAPL-Reaction Setup Lower Structure Zone-Eyes LongThis chart captures a structure-aware buy setup on Apple Inc. (AAPL), using Leola Lens SignalPro with momentum overlays and risk visualization.
What the Chart Shows:
🟢 A new BUY label appeared after price tapped a previously marked liquidity zone.
📉 Prior bearish momentum exhausted near 208.50–208.90 area — forming a potential base.
🟥 Overhead resistance is clearly defined, aligning with a recent rejection block and moving average confluence.
✅ A well-defined Risk:Reward setup is plotted — aiming for continuation toward 214.79, with risk below 208.06.
Key Levels to Monitor:
🔺 Break and hold above 210.50 could shift bias toward bullish continuation.
⚠️ Failure to hold above 209.00 could invalidate the current intraday structure.
This view is for educational purposes only — illustrating how price reacts around structure, liquidity, and confirmation signals.
Apple
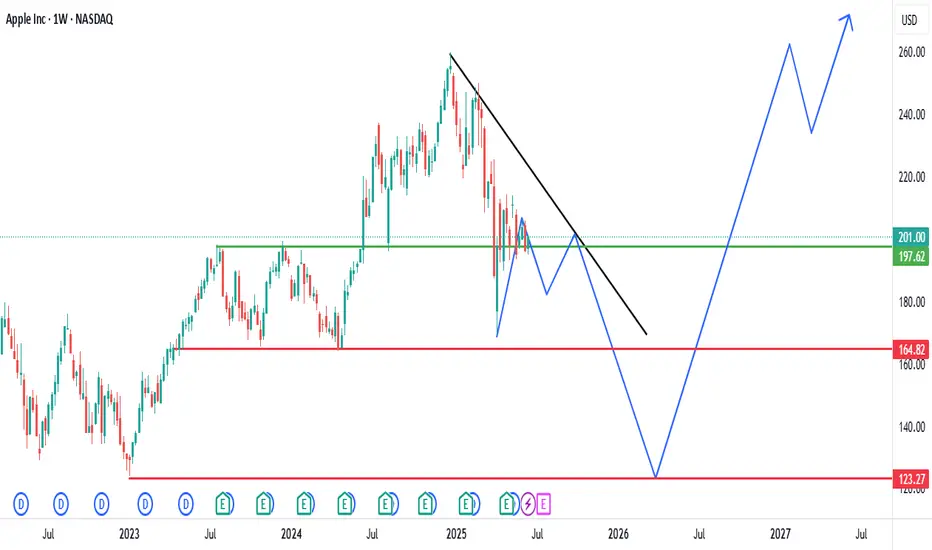
Analysis of Apple Inc. (AAPL) Weekly ChartHistorical Trend: The chart shows Apple Inc.'s stock price on a weekly timeframe from 2022 to mid-2025. The stock exhibited a strong upward trend from 2022 to early 2025, with notable growth followed by periods of consolidation and correction.
Key Levels:
Resistance: The $201.00-$197.62 range (green line) has acted as a significant resistance level. The price recently broke above this zone, suggesting potential bullish momentum.
Support: The $164.82 level (red line) has served as a major support zone. The stock tested this level during a recent decline and rebounded, indicating its strength.
Recent Price Action: After reaching a peak near $201.00, the stock entered a descending triangle pattern (black trendline). A breakout above the resistance at $201.00 is evident, accompanied by an upward projection (blue arrow), hinting at a possible continuation of the bullish trend.
Projected Movement: The upward projection suggests the stock could target levels around $240.00-$260.00 if the breakout holds. However, a failure to maintain above $201.00 might lead to a retest of the $164.82 support.
Volume and Indicators: The chart includes Bollinger Bands (O197.30 H201.70 L195.07 C201.00) with a -4.55 (-2.22%) change, indicating recent volatility. Specific volume data is not detailed, but the breakout suggests increasing buying pressure.
Outlook: The stock is currently in a bullish phase following the breakout above $201.00.
Maintaining above this level could drive further gains, while a drop below might signal a return to the $164.82 support. Close monitoring of price action around these levels is recommended.
Apple Next move is the Pole Target at 269 USDApple is forming a Flag Pattern, and Breakout above the Pattern is expected. The Next Target is the Pole Target price at $269, offering a potential Profit with an 18.8% ROI.
I want to help People Make Profit all over the "World".

EURUSD Levels // 20 MinHello Everyone 👋
Current Price
1.0850: This is the latest price level, reflecting the current market sentiment.
Resistance Levels
1.0880: The first resistance level, where selling pressure might increase.
1.0920: The second resistance level, indicating a stronger barrier for upward movement.
1.0980: The third resistance level, a significant hurdle for the bulls.
Support Levels
1.0820: The first support level, where buying interest might emerge.
1.0780: The second support level, indicating a stronger floor for the price.
1.0740: The third support level, a critical point for the bears.
Technical Indicators
Moving Averages: The 50-day and 200-day moving averages can provide insights into the trend direction.
Relative Strength Index (RSI): An RSI above 70 indicates overbought conditions, while below 30 indicates oversold conditions.
MACD (Moving Average Convergence Divergence): This can help identify potential buy or sell signals.
Market Sentiment
Economic Data: Keep an eye on upcoming economic releases from the Eurozone and the US, such as GDP, employment data, and inflation reports.
Geopolitical Events: Any significant geopolitical developments can impact the EUR/USD pair.

APPLE STOCKS TREND DOWN AFTER WARREN BUFFET SELLING 50% STOCKApple stock price make high 236.92 and buffet start the selling of apple stock its dumped the price of stock 55.02% now scenario is apple start falling the price of stocks my scenario is you will get the opportunity because my analysis show me a down trend in apple stocks after that buffet selling the stocks price close on Friday around 221.73 i give a scenario to buy stocks on different level .
1. 207.04 $
2. 197.14 $
3. 192.36 $
4. 186.55 $
IF apple stocks break down the level of 164.03 you will see sharp fall in apple stocks.
You will invest your wealth so don't be greedy some times institution play games with retail investor so before you invest your wealth look around the your financial condition and your risk because you know its risky some times. we need to wait when institution players enter in the market for manipulation.
Wait and watch then enter in the market grow together .

Apple Strong is the Out Perform the MarketApple as a share is Strong movement, Most of the people think that Warren Buffet is not taking risk hence he is invest Apple but this chart is Good Answer.
If you are looking in the Risk free with technolgy company this is the one of tham. I am currently bullish but currently risk is high as compare to the Reward

GOLD IN BUYGOLD/USD March FINAL WEEK PLAN...
In GOLD-USD Friday (22-03-2024) Market reaches our 2nd sell target of 2160...
Which is buy correction zone(BUY FLIP ZONE)...
EXTREM BUY ZONE IS still there 2152-2146
I am looking for buy because of below mentioned points:
1.Before reaching 2160 market forms buy liquidity(BUYING PATTERN) in FAIR GAP Area
2.In 30M Awesome Oscillator indicates upside distribution even market comes down...
3.In 15M-50% Buy confirmation we got...
4.In DAY TF i am expecting 2258-2300 is 1st Pull back zone(only my opinion not confirms yet)
Here we got 3 entry zones with 3 different entry method...
1.Intraday Setup-- use 1% RISK of your capital in every entry
we have 3 intraday setup
(_a_).15M Gives only 50% confirmation for BUY REWARD---1:20 Ratio
BUY limit @2160
SL 2156
TP 2185
TP 2206
TP 2211
(_b_).5M mid range entry(if confirms get we will updates here then entry this)BUY
REWARD--1:22 Ratio
BUY limit @2153
SL 2149.4
TP 2185
TP 2206
TP 2211
(_c_).30M Extreme entry zone previous BUY LIQUIDITY zone...
Also PULL BACK AREA...In 2146 is trend line passing point...
you can place order without confirmation... REWARD--1:24 Ratio
BUY limit @2149
SL 2144
TP 2185
TP 2206
TP 2211
2.Mid Risk Setup-- use 4to5% RISK of your capital.... REWARD--1:8-1:10 Ratio
USE 2 Layers 5 Orders Strategy
BUY LIMIT @2153-2149
SL 2144
TP 2185
TP 2206
TP 2221
Once Market HIT 2149...SET 2153 as a Target BE(close @entry)
3.Swing setup-- Need higher capital.... REWARD--1:7-1:8-1:10 Ratio
USE 3 Layers 5 Orders Strategy
BUY LIMIT @2160-2153-2149
SL 2144
TP 2185
TP 2206
TP 2221
TP 2270
Once Market HIT 2149...SET 2160 as a Target BE(close @entry)
IF MARKET TREND CHANGE... OVER ALL SELL STOP 2143..use x2 lot size which total lot size you use in above buy limit orders ( Targets & SL will updates later)
or
Don't use sell stop wait for next recovery update...
All The Best...
NOTES:EDUCATION PURPOSE ONLY

Apple - At Crucial LevelsIt is clear from the setup that the price is at the lower edge of the rising parallel channel. If bounces back from these levels, there may be a bullish phase.
Immediate support may be around 175. if sustains below 175, will be out of our setup.
This illustration is only my view, not a trading advice in any form. Please conduct your research before taking any trade.
All the best.

AAPL , APPLE STOCK 4HR ANALYSISNASDAQ:AAPL
Hello traders , here is the full multi time frame analysis for this pair, let me know in the comment section below if you have any questions, the entry will be taken only if all rules of the strategies will be satisfied. wait for more Smart Money to develop before taking any position . I suggest you keep this pair on your watchlist and see if the rules of your strategy are satisfied...
Keep trading
Hustle hard

APPLE DAILYAPPLE AT ITS IMPORTANT LEVEL
Apple was founded as Apple Computer Company on April 1, 1976, by Steve Wozniak, Steve Jobs (1955–2011) and Ronald Wayne to develop and sell Wozniak's Apple I personal computer. It was incorporated by Jobs and Wozniak as Apple Computer, Inc. in 1977.
Only for educational purpose.

Apple - Low Risk SetupLevels are mentioned on the charts. As long as it sustains above 175.50, chances of going to 181 or 186 are there. Should retest the breakdown levels.
Only for learning and sharing purposes, not a piece of trading advice in any form.
All the best for your trading journeys.

Candlestick pattern: Shooting starShooting Star is a bearish candlestick reversal pattern. It signifies the end of an uptrend and the potential start of a downtrend. Its opposite is the Morning Star.
When analyzing this pattern, we should observe if the confirming candle closes within the lower third of the range formed. This condition acts as a filter when deciding whether to initiate a trade or not.
This filter makes sense because a stronger confirming candle indicates greater rejection of the uptrend continuation, thus increasing the likelihood of the pattern's success and the formation of a new downtrend.
On the other hand, if the confirming candle does not close below two-thirds of the range formed, it could indicate weakness in the direction of the trend and decrease the probability of the start of a new downtrend.

AAPLApple stock has been in parallel channel since Dec 2004 and now it is almost at the upper end of the channel.
If it fails to give BO then there is good possibility that it may correct in handsome way to retest the support highlighted.

Apple/ AAPL, Long Term Analysis DOWNTRENDApple/AAPL, Long Term Analysis DOWNTREND
Apple Analysis
-Monthly Chart with Fibonacci Extension

dax gernmanyThe German index is just 3% away from an all-time high
strong outperformer against global peers.
now at 15875, can move beyond the 16300 mark
on the downside good as long as hold the 15250-15300 area

NASDAQ at important 0.618 Fibonacci support levelNasdaq is at critical .618 fibonacci support level AND AAPL is ALSO at 0.382 fibonacci support level.
If Nasdaq holds this level for weekly cbsl today 6/Jan/2023 AND AAPL closes above 126 usd expect ATLEAST 500 points bounce.

AAPL at Critical support levelAAPL is at critical 0.382 fibonacci support level - need weekly close above126 today 6th Jan 23. Else AAPL can crash land to 109 and along with it take down nasdaq to psychological 10000 level too.
Can take a very small risk for best return on the upside.

GO LONG ON APPLE "NASDAQ:AAPL"]NASDAQ:AAPL
There is great support zone in apple
Also R SI is at 20 which act as support
On a daily time frame there is demand zone from july 2021
This is for educational purpose

APPLE whats next!support at 147.5 -148
while it cn make an upmove towards 163-165 region
the open low formation at support areas along with RSI divergence indicates strength in bullishness

APPLE 08.07.2022: entry & exit is very important
: try to manage money management
: know your stop loss
: find the chart pattern / analysis the chart before you enter

DJI : Last chance before it's too late.Be bullish when others are fearful not to sell your holdings. The fed & Media are trying there best so you can closed your holdings & they can buy more.

IrctcVolume increase and best resistance level for this chart and good pattern showing on this chart and get best level on fib ristancment and it is good for level on this screen for next day for day trading.

Apple Inc. (AAPL) Stage AnalysisApple Inc. weekly TF chart. On crucial stage 3 base support zone.
Only for educational purposes, not a recommendation.
