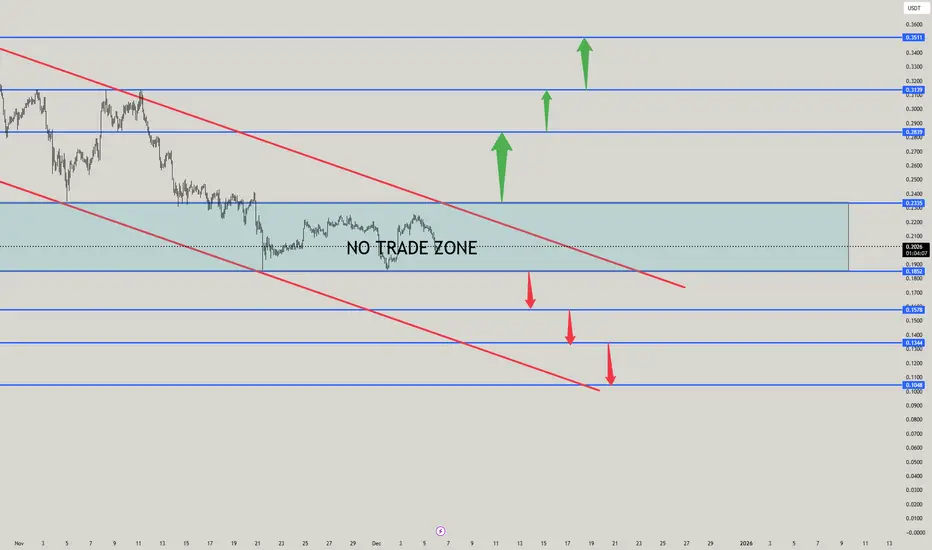
Analyse ARB/USDT✅ 1. NO-TRADE ZONE (Do Not Trade Inside)
The blue shaded region between ~0.2335 and ~0.2020 is clearly a consolidation box.
📌 Why NO TRADE here?
Price is moving sideways → no clear trend
Inside a mid-range of a falling channel → low R:R
Whipsaws → both long/short entries get trapped
Best to wait for a breakout or breakdown
🚫 Stay out until price leaves this zone with a candle close.
🟢 2. BUY SIDE ANALYSIS (Bullish Setup)
You BUY only after price breaks above the upper box (0.2335).
Buy Entry #1 (Breakout Retest Buy)
🔹 Entry: Above 0.2335 after successful retest
🔹 TP1: 0.2839
🔹 TP2: 0.3139
🔹 TP3: 0.3511
🔹 SL: Below 0.2330 (box low retest failure)
📌 Why buy here?
Breakout above structure = shift in market character
Leaves the falling channel → trend reversal
Demand zone sits under 0.2335 → strong support
Buy Entry #2 (Aggressive Channel Break Buy)
If price breaks the red descending trendline,
you can buy on the retest of that trendline.
🔴 3. SELL SIDE ANALYSIS (Bearish Setup)
You SELL only after price breaks below the lower box (0.2020).
Sell Entry #1 – Breakdown Sell
🔹 Entry: Below 0.2020
🔹 TP1: 0.1857
🔹 TP2: 0.1578
🔹 TP3: 0.1344
🔹 TP4: 0.1048
🔹 SL: Above 0.2020 (breakout failure)
📌 Why sell here?
Break below demand = continuation of main downtrend
Price returns to lower portion of falling channel (red)
Liquidity sweep under mid-range often gives strong sell continuation
Sell Entry #2 – Channel Retest Sell
If price rises to retest the red descending trendline from below → short.
📌 Price-Action Explanation (Simple Formula)
Why BUY above 0.2335?
Break of structure (BOS)
Transition from lower-highs to higher-highs
Mid-range breakout → moves toward upper liquidity
Retest confirmation → clean R:R
Why SELL below 0.2020?
Loss of demand
Lower low creation → continuation trend
Channel breakdown → next liquidity zone below
Retest rejection = strong continuation signal