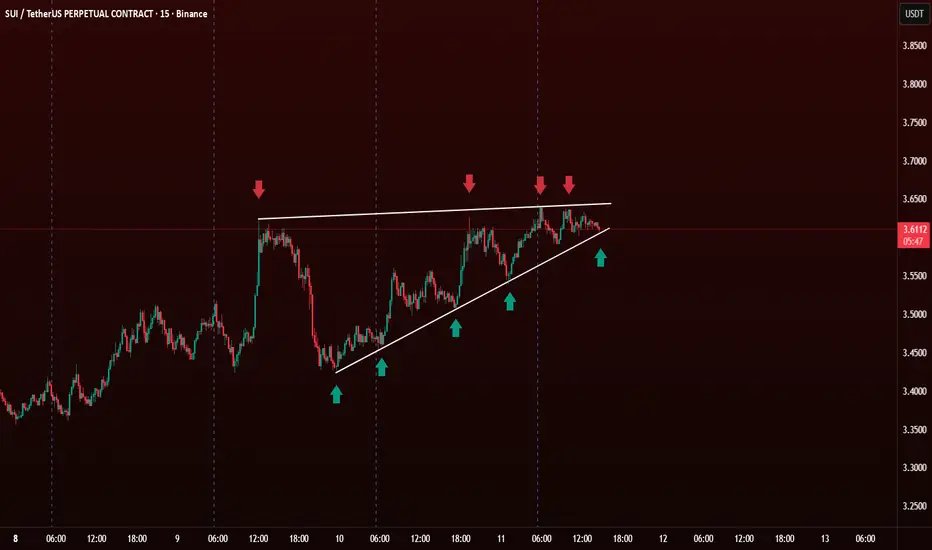
Ascending Triangle Pattern in Technical Analysis The Ascending Triangle is a bullish continuation pattern. It forms when the price creates higher lows (🔼) while facing consistent resistance at the same horizontal level (🔴).
🧐 How to Identify It
Flat Resistance Line 🔴
Price hits the same level multiple times and gets rejected.
This creates a horizontal line on top.
Rising Support Trendline 🔼
Each dip forms a higher low, indicating buying pressure.
Connect the swing lows with a rising trendline 📈.
📊 How to Trade It
Entry : Breakout Entry: Enter when price breaks and closes above the resistance line with high volume 💥.Conservative traders wait for a retest of the breakout zone (resistance becomes support).
Target : Measure the height of the triangle and project it upward from the breakout point.
Example: If triangle height = $0.30, add $0.30 above breakout.
Stop Loss : Below the last higher low 🔽 Or slightly below the triangle support trendline 📉
BINANCE:SUIUSDT.P
Ascending-triangle
Ascending triangle breakout. #TCS#TCS #Ascending triangle #breakout.
Tcs ascending triangle breakout.
Can move to 4000 within 3 month.

Ascending Triangle on USDINRAscending Triangle pattern formation on USDINR and the price near to the DEMA 200.
Trade:
Buy above - 65.025
Target 1 - 65.525
Target 2 - 66.135
Stop Loss - 64.295

Ascending Triangle on Bank of Baroda - LONGAscending Triangle on Bank of Baroda and it will break for upside movement. Indicators also showing bullish trend and last 2 hours of previous day volume is high. I am expecting the price may have gap up.
Trade:
Buy above - 152
Target 1 - 154
Target 2 - 156
Stop Loss - 150
R : R = 1 : 2
Reward Points = 4
Risk Points = 2

Ascending Triangle formation on INFY - LONGAscending Triangle formation on Infy and showing bullish trend. EMA 50 on EOD at this level so once broken then price will hit the target.
Trade:
Buy above - 989
Target 1 - 999
Target 2 - 1009
Stop Loss - 973
Reward Points - 20
Risk Points - 16

Ascending Triangle on Yes bank - LongAscending Triangle formation on Yes Bank in hr chart.
Trade:
Buy above - 1186
Target 1 - 1199
Target 2 - 1209
Stop Loss - 1173
Reward Points - 23
Risk Points - 13
"Happy Trading"
