Ascending Triangle

MuthootFin (Breakout)Stock has been consolidating well for past few days, any candle above yesterdays closing level will attract buyers and push the price up.
Ascending triangle pattern formed.

ascending triangle breakout potential of 12-24 % returns.SIYSIL has made a breakout wait for retest has entry for profits.
FOLLOW FOR MORE !

ASTER DM HEALTHCARE LTD - Ascending Triangle Breakout📊 Script: ASTERDM (ASTER DM HEALTHCARE LIMITED)
📊 Nifty50 Stock: NO
📊 Sectoral Index: NIFTY 500 / NIFTY SMALLCAP / NIFTY PHARMA
📊 Sector: Healthcare
📊 Industry: Healthcare Services - Hospital
Key highlights: 💡⚡
📈 Script is trading at upper band of Bollinger Bands (BB) and giving breakout of it.
📈 MACD is giving crossover.
📈 Double Moving Averages also giving crossover.
📈 Volume is increasing along with price which is volume breakout.
📈 Script is giving breakout of Ascending Triangle.
📈 Current RSI is around 65.
📈 One can go for Swing Trade.
⏱️ C.M.P 📑💰- 265.55
🟢 Target 🎯🏆 - 304
⚠️ Stoploss ☠️🚫 - 247
⚠️ Important: Always maintain your Risk & Reward Ratio.
⚠️ Purely technical based pick.
✅Like and follow to never miss a new idea!✅
Disclaimer: I am not SEBI Registered Advisor. My posts are purely for training and educational purposes.
Eat🍜 Sleep😴 TradingView📈 Repeat🔁
Happy learning with trading. Cheers!🥂

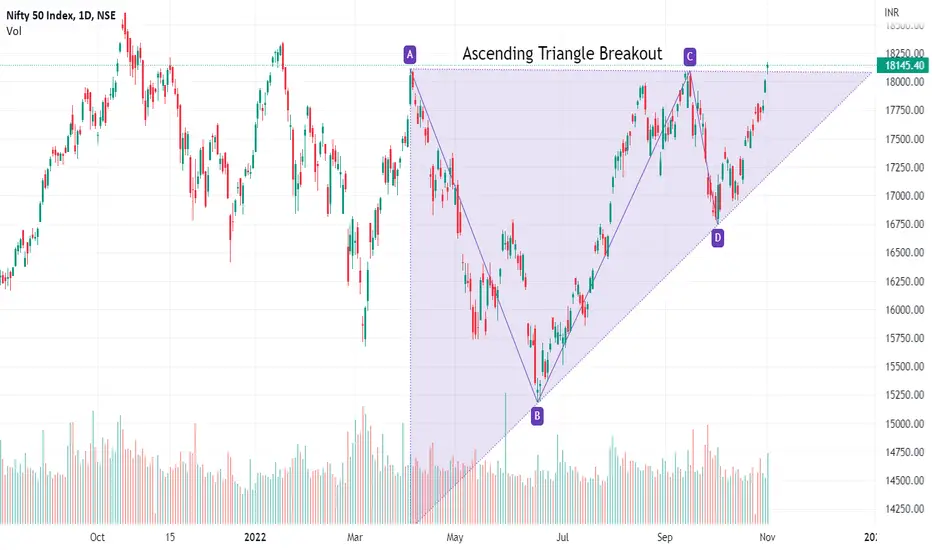
NIFTY50 - Ascending Triangle Breakout ?Key highlights: 💡⚡
📈 Can we consider this as Ascending Triangle Breakout ?
📈 Comment down your views.
⚠️ Important: Always maintain your Risk & Reward Ratio.
⚠️ Purely technical based pick.
✅Like and follow to never miss a new idea!✅
Disclaimer: I am not SEBI Registered Advisor. My posts are purely for training and educational purposes.
Eat🍜 Sleep😴 TradingView📈 Repeat🔁
Happy learning with trading. Cheers!🥂
HFCL - Double Digit + Smallcap + Breakout Soon 📊 Script: HFCL (HFCL LIMITED)
📊 Nifty50 Stock: NO
📊 Sectoral Index: NIFTY 500 / NIFTY SMALL CAP
📊 Sector: Telecommunication
📊 Industry: Telecom - Infrastructure
DAILY TIMEFRAME
Key highlights: 💡⚡
📈 Script is trading at upper band of Bollinger Bands (BB) and giving breakout of it.
📈 MACD line is taking support of signal line and bounce back from there.
📈 Double Moving Averages already giving crossover.
📈 Volume is increasing along with price which is volume breakout.
📈 Script is going to give breakout of ascending triangle in Weekly and Daily chart.
📈 Current RSI is around 64.
📈 One can go for Swing Trade.
⏱️ C.M.P 📑💰- 82.70
🟢 Target 🎯🏆 - 95
⚠️ Stoploss ☠️🚫 - 75
⚠️ Important: Always maintain your Risk & Reward Ratio.
⚠️ Purely technical based pick.
✅Like and follow to never miss a new idea!✅
Disclaimer: I am not SEBI Registered Advisor. My posts are purely for training and educational purposes.
Eat🍜 Sleep😴 TradingView📈 Repeat🔁
Happy learning with trading. Cheers!🥂

ROSSELLIND - Ascending Triangle Breakout and RetestNSE:ROSSELLIND
ROSSELLIND broke out of an ascending triangle with a strong volume. Retesting the breakout zone with a complete dried up volume. It's a low risk entry opportunity.
Can show a further upside if the broader market conditions remain favourable.

TCI - Ascending Triangle formationNSE:TCI
Ascending triangle formation in TCI. Breakout soon candidate.

UBL Ascending triangle !!NSE:UBL
#NSE:UBL formed Ascending triangle in 4 months consolidation, any time may show very good momentum !!

Bharat Dynamics Limited - Ascending Triangle + Fresh Volume 📊 Script: BDL (BHARAT DYNAMICS LIMITED)
📊 Nifty50 Stock: NO
📊 Sectoral Index: NIFTY INFRASTRUCTURE / NIFTY500 / NIFTY SMALLCAP
📊 Sector: Industrials / Capital Goods
📊 Industry: Aerospace & Defense
Daily Timeframe
Key highlights: 💡⚡
📈 Script is trading at upper band of Bollinger Bands (BB) and giving breakout of it.
📈 MACD is giving crossover.
📈 Double Moving Averages also giving crossover.
📈 Volume is increasing along with price.
📈 Current RSI is around 72.
📈 One can go for Swing Trade.
In keeping with its commitment to fight the future wars with Indigenous Solutions, #IndianArmy invites Indian Defence Industry to offer critical defence equipment for Emergency Procurement.
Source / For more details : twitter.com
KEEP AN EYE ON DEFENCE STOCKS.
1.BHARAT DYNAMICS (BDL)
2.HINDUSTAN AERONAUTICS LIMITED (HAL)
3.PARAS DEFENCE AND SPACE TECHNOLOGIES LIMITED (PARAS)
4.BHARAT ELECTRONICS LTD.(BEL)
5.COCHIN SHIPYARD LTD (COCHINSHIP).
⏱️ C.M.P 📑💰- 920
🟢 Target 🎯🏆 - 1006/1055
⚠️ Stoploss ☠️🚫 - 855
⚠️ Important: Always maintain your Risk & Reward Ratio.
✅Like and follow to never miss a new idea!✅
Disclaimer: I am not SEBI Registered Advisor. My posts are purely for training and educational purposes.
Eat🍜 Sleep😴 TradingView📈 Repeat 🔁
Happy learning with trading. Cheers!🥂

Maruti Suzuki India Limited - Ascending Triangle Breakout📊 Script: MARUTI (MARUTI SUZUKI INDIA LIMITED)
📊 Nifty50 Stock: YES
📊 Sectoral Index: NIFTY AUTO / NIFTY500 / NIFTY
📊 Sector: Automobile and Auto Components
📊 Industry: Passenger Cars & Utility Vehicles
DAILY TIMEFRAME
Key highlights: 💡⚡
📈 Script is trading at upper band of Bollinger Bands (BB) and giving breakout of it.
📈 MACD is giving crossover.
📈 Already Crossover in Double Moving Averages.
📈 Script is giving Ascending Triangle Breakout as mention is chart.
📈 Script is trading at resistance level which is around 9280, technically script is looking good for trade.
📈 Current RSI is around 66.
📈 One can go for Swing Trade.
⏱️ C.M.P 📑💰- 9280
🟢 Target 🎯🏆 - 9733
⚠️ Stoploss ☠️🚫 - 9053
⚠️ Important: Always maintain your Risk & Reward Ratio.
✅Like and follow to never miss a new idea!✅
Disclaimer: I am not SEBI Registered Advisor. My posts are purely for training and educational purposes.
Eat🍜 Sleep😴 TradingView📈 Repeat 🔁
Happy learning with trading. Cheers!🥂

BULLISH on BDLNSE:BDL
The prices, after giving a breakout from the Ascending Triangle Pattern has retested the support area. I think that it is the good time to enter the stock. The prices are above the important moving averages. The MACD and RSI is also Bullish. This view is for upto 6 months. The Target levels are 1070 and the stoploss levels are 864.50 levels.
Disclaimer :- This is my own views and analysis. This is for educational purposes. This is not a tip, call or a recommendation.

WELCORPAscending triangle pattern
trg r open with confirmation candle
If You LIKE MY Idea ……Boost………….. its
“Disclosure : I am not Sebi-registered.” This channel is for only educational purpose. Any profit/loss, I am not responsible. Before taking any trade on our calls please consult your financial advisors. Thanks

AIA ENGINEERING LTD GOOD FOR SWING AIA ENGINEERING LTD GOOD FOR SWING TRADING
ASCENDING TRIANGLE BREAKOUT
C.P.M 2715
stop loss 2600
1st target 2850
2nd target 2986

Nifty 50 daily time frame Nifty 50 is on very important level also price formed a ascending triangle pattern if it will break then we can say about trend

BHARAT DYNAMICS LTD GOOD FOR SWING BHARAT DYNAMICS LTD GOOD FOR SWING TRADING
ASCENDING TRIANGLE BREAKOUT
volume breakout
Buy 930
1st target 976
2nd target 1023
stopp loss 865

BDLAscending Triangle Pattern TWO breakout r u see on chart for education what happen in next??????????????
for MORE check in my TradingView ID
If You LIKE MY Idea ……Boost………….. its
“Disclosure : I am not Sebi-registered.” This channel is for only educational purpose. Any profit/loss, I am not responsible.
Before taking any trade on our calls, please consult your financial advisors. Thanks

SXG NIFTY50 daily time frame ascending trianglePrice formed a ascending triangle in SGX NIFTY50, if it will break down then we can expect a correction or if price will breakout then it will continue their up move. What do you think? tell me in the comments below.

Ascending triangle in nifty50Nifty50 formed a ascending triangle pattern. Now we can about the trend after breakout or breakdown.

Coal India Positional Trade IdeaHello Guys, As we see the Coal India is forming a ascending triangle pattern in the weekly chart and nowadays it is trading near the top resistance if it gives breakout to the 164.20 level and takes support there then a positional trade is seem possible in the stock we can buy near 167 I've marked the targets on the chart with the help of green lines which are clearly visible. Place your Stop Loss according to your Risk Reward Ratio.


BULLISH on ACCNSE:ACC
The price has given breakout from the ascending triangle pattern. Other parameters are described on the chart.

KPIT - Ascending Triangle + Cup & Handle Breakout 📊 Script: KPIT (KPIT TECHNOLOGIES LIMITED)
📊 Nifty50 Stock: NO
📊 Sectoral Index: NIFTY500
📊 Sector: Information Technology
📊 Industry: Computers - Software & Consulting
Cup & Handle Breakout
Key highlights: 💡⚡
📈 Script is trading at upper band of Bollinger Bands (BB) and giving breakout of it.
📈 MACD is giving crossover.
📈 Double Moving Averages is also giving crossover.
📈 Volume is increasing along with price.
📈 Script is giving Trendline + Ascending Triangle + Cup & Handle Breakout as shown in chart.
📈 Current RSI is around 67.
📈 One can go for Swing Trade.
⏱️ C.M.P 📑💰- 605
🟢 Target 🎯🏆 - 684
⚠️ Stoploss ☠️🚫 - 574
⚠️ Disclaimer: DowJones & NASDAQ futures down more than 1% due to US. AUG INFLATION AT 8.3 % V 8.1 % EST. Take position according to your comfort level and conviction.
⚠️ Important: Always maintain your Risk & Reward Ratio.
✅Like and follow to never miss a new idea!✅
Disclaimer: I am not SEBI Registered Advisor. My posts are purely for training and educational purposes.
Eat🍜 Sleep😴 TradingView📈 Repeat 🔁
Happy learning with trading. Cheers!🥂
