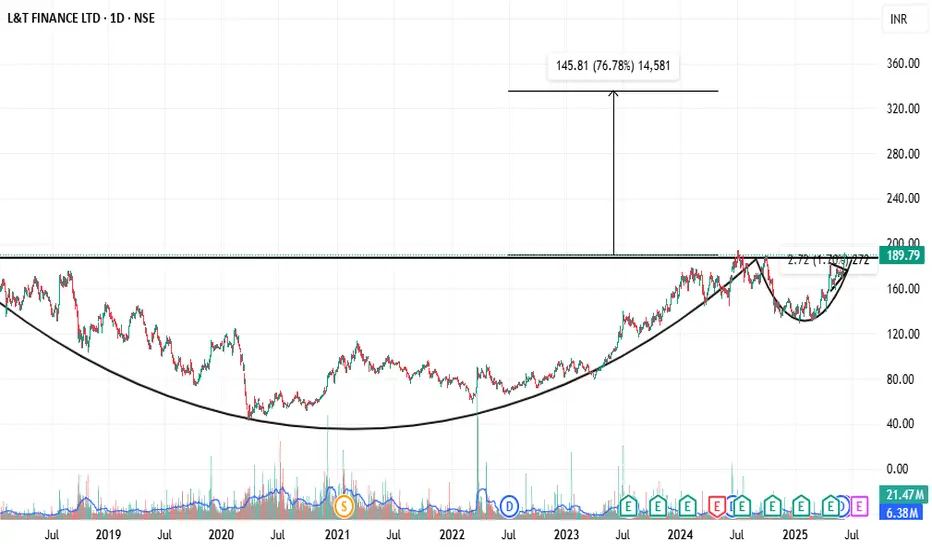
BULLISH ON NBFC STOCKS, "LTF" IS ONE OF THEMEid-Ul-Adha Pick
Technical View
Cup & Handle Pattern Formation...
Near To All Time High Breakout...
Ready To Multiyear Breakout...
Ascending Triangle Breakout In Daily Chart...
Long On "LTF"
Entry Near 180-190
Buy On Dips Near 150
Sl 135
Target 205/245/335++++
#The_Chartist
I Am Not Sebi Registered Research Analyst Or Investment Advisor. You Should Advice From Your Financial Advisor. Recommendation Only For Educational Purpose.
Ascending Triangle
Venus Pipes Explodes 12% Breaking Out of 6-Month BaseNSE:VENUSPIPES Explodes 12%: Breaking Out of 6-Month Base Could Target ₹1,600 as it made a Beautiful Chart Structure Just Before Q4 FY25 Results.
Price Action Analysis
NSE:VENUSPIPES is experiencing a significant breakout moment, currently trading at ₹1,452.00 with an impressive 12.37% gain (₹159.80). The stock has decisively broken above a critical resistance zone around ₹1,400-1,420 after consolidating in a well-defined base for nearly six months. This breakout comes with strong momentum and represents a potential shift from accumulation to the markup phase.
Volume Analysis:
Volume is exceptionally strong at 626.33K shares compared to the average of 85.02K - nearly 7.5x times normal volume. This massive surge in participation validates the breakout and suggests institutional buying interest. The volume spike coinciding with the price breakout is a textbook confirmation signal that significantly increases the probability of continuation.
Key Support & Resistance Levels:
- Newly Broken Resistance: ₹1,400-1,420 zone (now potential support)
- Next Major Resistance: ₹1,500-1,520 (psychological level and previous resistance)
- Ultimate Target Resistance: ₹1,900-1,950 (red horizontal line - major resistance from earlier highs)
- Strong Base Support: ₹1,100-1,150 zone (multiple green arrows showing successful tests)
- Immediate Support: ₹1,380-1,400 (previous resistance becomes support)
Technical Patterns:
1. Rectangle Breakout: Clean break above the 6-month consolidation range (₹1,100-1,420)
2. Multiple Bottom Formation: Several tests of the ₹1,100-1,150 support zone (marked with green arrows)
3. Ascending Triangle: Recent price action shows higher lows approaching the ₹1,420 resistance
4. Volume Breakout Pattern: Classic high-volume breakout from a prolonged base
Trade Setup - Breakout Continuation
Primary Entry Strategy:
- Entry Point: ₹1,440-1,460 (current levels or minor pullback)
- Aggressive Entry: ₹1,420-1,430 (on any retest of breakout level)
Target Levels:
- First Target: ₹1,520-1,540 (psychological resistance and measured move)
- Second Target: ₹1,650-1,680 (extension target based on base width)
- Ultimate Target: ₹1,800-1,850 (major resistance zone approach)
Risk Management:
- Stop Loss: ₹1,350 (below the breakout zone and recent support)
- Tight Stop: ₹1,390 for short-term traders
- Position Size: Maximum 2-3% of portfolio at risk
Alternative Setup - Conservative Approach
For risk-averse traders:
- Entry: ₹1,480-1,500 (after clearing first resistance convincingly)
- Stop Loss: ₹1,420 (below confirmed breakout level)
- Targets: ₹1,600, ₹1,750
Pattern Analysis:
The stock has formed a solid 6-month base between ₹1,100-1,420, allowing for significant accumulation. The multiple tests of support around ₹1,100-1,150 (green arrows) demonstrate strong buying interest at lower levels. The recent ascending triangle formation within the larger rectangle pattern suggests building momentum that has now been released.
Risk-Reward Assessment:
- Primary Setup R:R: 1:2.8 (Entry ₹1,450, Stop ₹1,350, Target ₹1,730)
- Breakout Target: Rectangle pattern suggests potential for 25-30% move
- Failure Risk: Breakdown below ₹1,380 would invalidate the bullish setup
Key Technical Factors:
The convergence of multiple bullish signals - rectangle breakout, volume confirmation, successful base building, and momentum surge - creates a high-probability setup. The stock has spent considerable time building this base, and the breakout with such strong volume suggests genuine institutional participation rather than retail speculation.
Trading Strategy:
Traders should look for any minor pullbacks to the ₹1,420-1,440 zone as ideal entry opportunities. The key is to ensure the breakout level holds as support. A sustained move above ₹1,500 would confirm the pattern and likely attract momentum buying, potentially accelerating the move toward the ₹1,650-1,700 zone.
Monitor for any evening star or shooting star patterns at resistance levels, which could signal temporary exhaustion and provide profit-taking opportunities.
Keep in the Watchlist.
NO RECO. For Buy/Sell.
📌Thank you for exploring my idea! I hope you found it valuable.
🙏FOLLOW for more
👍BOOST if you found it useful.
✍️COMMENT below with your views.
Meanwhile, check out my other stock ideas on the right side until this trade is activated. I would love your feedback.
Disclaimer: "I am not SEBI REGISTERED RESEARCH ANALYST AND INVESTMENT ADVISER."
This analysis is intended solely for informational and educational purposes and should not be interpreted as financial advice. It is advisable to consult a qualified financial advisor or conduct thorough research before making investment decisions.

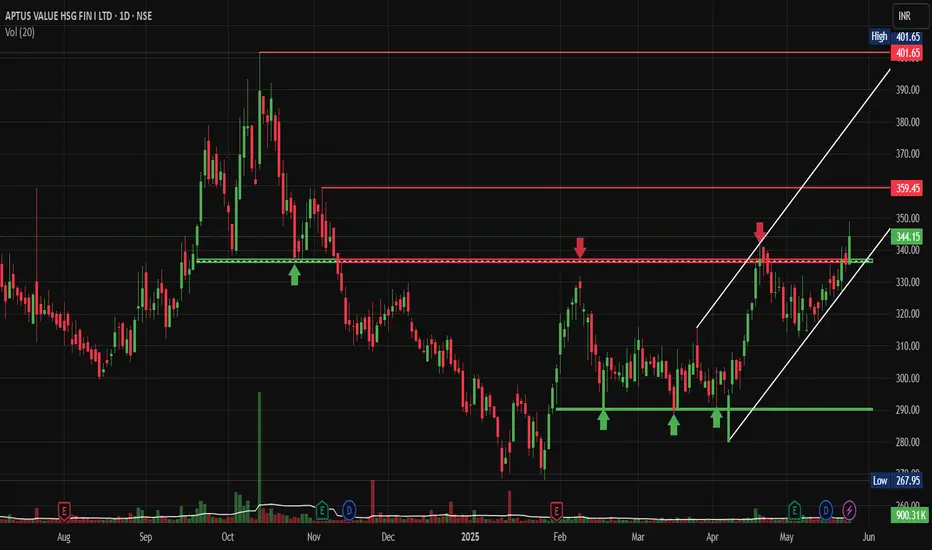
Aptus Rising Channel Pattern with Prior Triple Bottom PatternNSE:APTUS : Rising Channel Pattern with Prior Triple Bottom Pattern Signals Major Reversal - Could This Be the Next Multi-Bagger?
Pattern Recognition & Base Formation:
NSE:APTUS presents a compelling technical setup with a Triple Bottom reversal pattern formed at the ₹267-275 support zone. This pattern, completed over several months from late 2024 to early 2025, represents one of the most reliable bullish reversal formations in technical analysis.
The stock has also carved out a distinct ascending triangle pattern with the upper trendline acting as dynamic resistance around ₹340-350 levels. The recent breakout above this consolidation zone, accompanied by increased volume participation, signals a potential trend change from the prolonged correction phase.
Key Technical Levels Analysis:
Critical Support Levels:
- Immediate Support: ₹330-335 (recent breakout consolidation)
- Major Support: ₹290-295 (triple bottom neckline and 50% retracement)
- Ultimate Support: ₹267-275 (triple bottom base - absolute floor)
Resistance Levels:
- Immediate Resistance: ₹359 (marked horizontal resistance zone)
- Next Target: ₹380-385 (psychological resistance before ATH)
- Ultimate Target: ₹401.65 (all-time high retest)
- Extension Target: ₹420-430 (measured move from triple bottom pattern)
Volume Profile Assessment:
The volume pattern shows significant improvement during the recent bounce from the triple bottom lows. Today's volume at 900.31K represents a 44% increase from the 20-day average, indicating institutional interest returning to the stock.
The volume during the formation of the triple bottom showed classic accumulation characteristics - high volume on declines (smart money buying) and lower volume on any bounces, until the recent breakout attempt.
Technical Pattern Breakdown:
Primary Pattern: Triple Bottom Reversal
- Formation Period: December 2024 - February 2025
- Support Base: ₹267-275
- Neckline: ₹290-295
- Measured Target: ₹350+ (already achieved), next target ₹420-430
Secondary Pattern: Ascending Triangle
- Formation Period: February 2025 - Present
- Base: Rising support from ₹275 to ₹330
- Apex: ₹340-350 resistance zone
- Breakout Status: In progress with volume confirmation pending
Trade Setup Strategy:
Setup Classification: Reversal Play with Pattern Confirmation
Entry Approaches:
- Aggressive Entry: ₹340-345 (current levels on any minor dip)
- Conservative Entry: ₹330-335 (on pullback to breakout support)
- Value Entry: ₹290-295 (if neckline retest occurs - lower probability)
Position Management:
- Initial Position: 1-1.5% portfolio allocation
- Add-on Levels: ₹330-335 (if pullback materialises)
Profit Booking Strategy:
- Target 1: ₹365-370 (6-8% upside) - Book 25% position
- Target 2: ₹385-390 (12-15% upside) - Book 40% position
- Target 3: ₹410-420 (20-25% upside) - Book remaining 35%
Risk Management:
- Tight Stop: ₹325 (5-6% downside for aggressive traders)
- Swing Stop: ₹310 (10% downside for position traders)
- Pattern Stop: ₹285 (below neckline - invalidates bullish thesis)
Sector & Fundamental Backdrop:
Housing finance companies are experiencing renewed interest due to:
- Improving real estate cycle momentum
- Regulatory clarity on lending norms
- Credit growth revival in retail segments
- Government policy support for affordable housing
Risk-Reward Assessment:
Bullish Catalysts:
- Triple bottom completion - highly reliable reversal signal
- Volume expansion during the recent bounce
- Sector tailwinds supporting fundamentals
- Technical breakout from months of consolidation
- Strong support base established at ₹270 levels
Risk Factors:
- Overall market volatility could impact momentum
- NBFC sector sensitivity to interest rate changes
- Need to sustain above ₹340 to confirm breakout
- High beta nature amplifies market moves
Bottom Line:
NSE:APTUS offers an attractive risk-adjusted opportunity with the completion of a triple bottom reversal pattern. The stock appears to be in the early stages of a potential trend reversal after months of base building.
The most prudent approach would be to initiate positions around current levels (₹340-345) with a tight stop below ₹325, targeting the ₹365-370 zone initially. Any pullback to the ₹330-335 support area would present an even better entry opportunity.
The key technical milestone will be a decisive break and hold above ₹350, which would likely trigger the next leg of the move toward the ₹380-400 zone. Until then, trade with defined risk parameters and respect the established support levels.
Keep in the Watchlist.
NO RECO. For Buy/Sell.
📌Thank you for exploring my idea! I hope you found it valuable.
🙏FOLLOW for more
👍BOOST if you found it useful.
✍️COMMENT below with your views.
Meanwhile, check out my other stock ideas on the right side until this trade is activated. I would love your feedback.
Disclaimer: "I am not SEBI REGISTERED RESEARCH ANALYST AND INVESTMENT ADVISER."
This analysis is intended solely for informational and educational purposes and should not be interpreted as financial advice. It is advisable to consult a qualified financial advisor or conduct thorough research before making investment decisions.
HCLTECH-INTRADAY-LONGStock is forming Ascending tringle in 1hr chart. Good opportunity to go long if it opens flat.
Ignore if it opens below 1405, if gap up wait for retest at 1426.
Please don't forget click on follow button so you won't miss any upcoming ideas.
Any confusion, feel free to drop msg. Happy to help :)
This is only for educational purpose, please manage your risk accordingly.

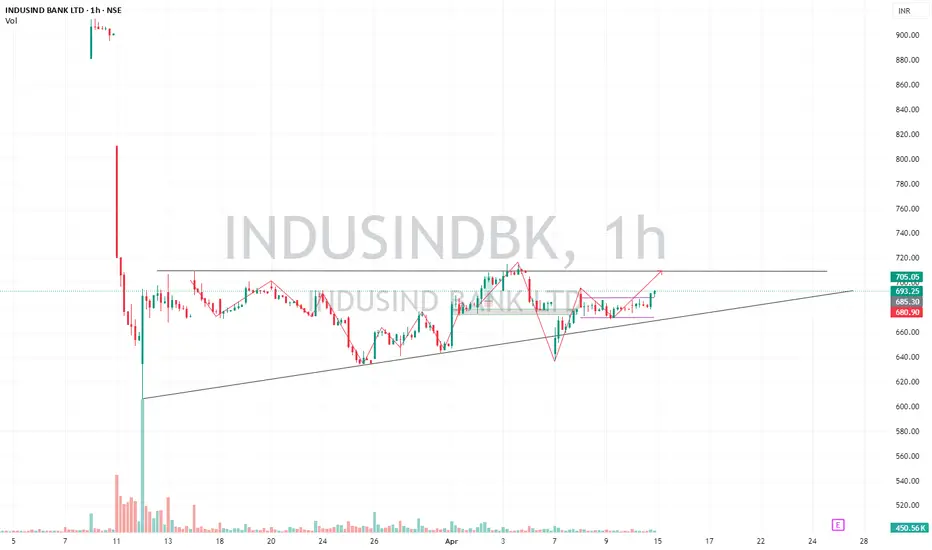
INDUSINDBK-Intraday/short term positional After the big fall, stock is consolidating from last month.
It has formed Ascending tringle pattern. From past 2 days i.e. 8th and 9th April 2025. It is trading in range. which states that buyers are accumulating.
It has potential to move if it opens between 692-700. It may go sideways for one more day it is a good opportunity for Long Intraday/short term positional trade.
If it opens 666, avoid.
Any confusion, feel free to drop msg. Happy to help :)
This is only for educational purpose, please manage your risk accordingly.
The Ascending Triangle Pattern: A Bullish Continuation GuideHello Traders!
In today's post, we’ll explore the Ascending Triangle Pattern , one of the most reliable bullish continuation patterns that traders look for during uptrends . It’s an important tool for identifying potential breakout points in trending markets. If you want to learn how to trade these breakouts effectively, mastering the Ascending Triangle is essential.
Chart Pattern: The Ascending Triangle is a strong bullish continuation pattern. In the case of ASIAN PAINTS LTD , we see the price action forming a flat resistance at the top and a rising upward sloping support at the bottom, indicating that the bulls are gradually taking control of the stock.
Key Points to Note:
The stock is respecting the flat resistance , which has been tested multiple times (marked by the red circles).
The upward sloping support is strengthening with each new low, showing growing buying pressure.
The price has recently broken out above the resistance , confirming the breakout pattern.
Trading Strategy:
Entry Point : Once the price breaks the resistance level, consider entering at 1,172.45 .
Stop Loss : Set your stop loss just below the upward sloping support at 1,151.25 to manage risk.
Profit Target : The ideal target after the breakout is approximately 1,261.65 , which is calculated by measuring the height of the triangle and projecting it upward from the breakout point.
Real-World Application:
This is a bullish setup , and traders should keep an eye on volume confirmation post-breakout. A breakout with increased volume would make the setup even stronger. A price move towards the target of 1,261.65 would indicate a successful breakout trade.
Risk Management:
Ensure that you follow your stop loss at 1,151.25 to avoid unnecessary losses in case the breakout fails.
Position size properly to align with your risk tolerance and the potential reward.
What This Means for Traders:
Bullish Setup : The ascending triangle signals that the bulls have control, and we expect the stock to continue higher.
Watch for confirmation of the breakout and enter with confidence, but always be prepared with your stop loss.
Conclusion:
This ascending triangle is a classic pattern, and it offers a great opportunity for long traders . Keep an eye on the breakout, manage your risk, and this trade could potentially yield solid returns.

Finance Sector Leader on Breakout with Huge Volume--What’s Next?Hey Traders!
Hope you're all doing great! There’s an exciting trading idea setting up with Bajaj Finance , and I couldn’t wait to share it with you. The stock is forming a classic Ascending Triangle Pattern , and based on this setup, we're expecting a nice breakout soon. Let’s break it down.
Technical Analysis: Ascending Triangle Pattern
The Ascending Triangle is a bullish continuation pattern that indicates strong buyer interest and a potential breakout. Bajaj Finance has formed a clear ascending triangle , with a horizontal resistance at the top and an upward-sloping support line at the bottom. The price has been making higher lows, showing that buyers are gradually gaining strength, while sellers are being squeezed at the resistance level.
Bajaj Finance continues to be one of India’s leading financial services companies , delivering consistent growth in revenue and profitability. Here's a quick look at the key financials from the December 2024 , September 2024 , and December 2023 quarters:
Sales :
Dec 2024 : ₹18,035 crore ( YoY Growth: 27% )
Sep 2024 : ₹17,091 crore
Dec 2023 : ₹14,164 crore
EBIDT :
Dec 2024 : ₹12,344 crore ( YoY Growth: 24% )
Sep 2024 : ₹11,753 crore
Dec 2023 : ₹9,934 crore
Net Profit :
Dec 2024 : ₹4,308 crore ( YoY Growth: 17% )
Sep 2024 : ₹4,014 crore
Dec 2023 : ₹3,639 crore
Earnings Per Share (EPS) :
Dec 2024 : ₹68.60 ( YoY Growth: 17% )
Sep 2024 : ₹64.62
Dec 2023 : ₹58.88
These solid figures show Bajaj Finance’s strength and its growth trajectory across key financial metrics.
I feel that fundamentally , Bajaj Finance is strong with 27% YoY sales growth and 17% YoY net profit growth , and technically , the Ascending Triangle Pattern on the chart shows a potential breakout, indicating the stock is ready for a big move in the coming months.
Disclaimer: This analysis is for educational purposes only. Please trade responsibly and consult a financial advisor before making any decisions.
If you found this analysis helpful, don’t forget to like, follow, and share your thoughts in the comments below! Your support keeps me motivated to share more insights. Let’s grow and learn together—happy trading!

INDUSTOWER | SWING TRADE | ASCENDING TRIANGLE BREAKOUTINDUSTOWER | SWING TRADE
Chart Analysis:
1) Ascending Triangle Breakout
2) Strong candle formations after breakout

DPABHSHAN | Ascending Triangle Breakout | Swing TradeDPABHSHAN | Ascending Triangle Breakout | Swing Trade
Stock giving a good breakout
Chart Analysis:
1) Ascending Triangle Breakout
2) Market Structure Breakout
3) Breakout - Consolidation - Breakout

Positional Long/Reversal Setup: PVR Inox
PVR has given a correction of ~40% from its latest High and is trading at a important make or break level.
Current price structure is following a Descending triangle pattern, supported by the golden ratio zone based on swings from 2020 onwards.
The daily RSI is at 28.41, indicating the stock is approaching oversold territory, which may precede a potential reversal.
Also the CCI is at -131.31, placing it in the oversold range, which could indicate a potential price reversal.
PVR is currently exhibiting a bearish trend however, oversold signals from the RSI, CCI and based on current price structure suggest the possibility of a reversal.
⚡Note: This is just for analysis purpose, please do your own research before punching any orders.
🔍 For more technical analysis and trade setups, make sure to follow me on trading view.
🔗 Trading View: in.tradingview.com/u/DebasisT/

RAMCO SYSTEM SET FOR BIG RUNRamco system today gave ascending triangle breakout on weekly charts. Stock gave 52 week high closing with good volume. Expected to test 700 at least in medium term and break all time high in next 12 month.

Viaz Tyres Ltd: On the Verge of a Major Breakout or ReversalKey Highlights:
Resistance Zone (₹70-₹72):
The chart shows a well-defined resistance zone marked in red. This level has been tested multiple times without a breakout, making it a critical hurdle for the stock.
Ascending Trendline Support:
The blue trendline indicates a steady upward movement, with the stock consistently making higher lows. This trendline is currently acting as a strong support level, near ₹63.
Critical Support Level (₹53.90):
A red horizontal line at ₹53.90 highlights a strong support zone. If the price breaks below the ascending trendline, this level could act as the next major support.
Volume Analysis:
The stock is witnessing moderate volume near the consolidation phase, indicating indecision. A spike in volume could confirm a breakout or breakdown.
Potential Scenarios:
Bullish Outlook:
A breakout above ₹72 with strong volume could lead to a rally towards ₹85 or higher.
The ascending trendline suggests a positive bias as long as the price respects this support.
Bearish Outlook:
A breakdown below the trendline (₹63) may push the stock towards ₹53.90, the next support zone.
Failure to hold ₹53.90 could trigger further downside.
Takeaway:
The stock is currently consolidating between ₹65-₹72, forming a critical juncture for traders and investors. A breakout above resistance or breakdown below support levels will determine the next trend. Keep a close watch on volume for confirmation of the next move.

BAJFINANCE - Ready To Bounce from LongTerm Support AreaThe chart shows Bajaj Finance Ltd. forming a 3-year long ascending triangle pattern, a bullish continuation setup.
Key observations:
1.Consistent higher lows indicate strong buyer support along the long-term uptrend line.
2.A bullish hammer candlestick suggests a potential reversal near the support level.
3.The stock has also formed a triple bottom near long term support making a confluence area.

Actual Success Rates of Ascending and Descending TrianglesActual Success Rates of Ascending and Descending Triangles
Here is an analysis of the actual success rates of ascending and descending triangles in trading, based on the information provided:
Success Rates
Ascending and descending triangles generally have fairly high success rates as continuation patterns:
-The ascending triangle has a success rate of approximately 72.77%.
-The descending triangle has a slightly higher success rate of 72.93%.
These numbers come from a study that tested over 200,000 price patterns over a 10-year period.
Factors Influencing Success
Several factors can influence the success rate of these patterns:
-The trader's ability to execute the strategy correctly
-Market conditions at the time the triangle formed
-Market liquidity
-Overall market sentiment
Important Points to Consider
-Triangles are considered reliable continuation patterns, especially in trending markets.
-The ascending triangle in an uptrend is statistically more reliable than the descending triangle.
-To validate the pattern, the price must touch at least twice each of the upper and lower lines.
-An increase in volume during the breakout is an important confirmation sign.
Strategies to improve the chances of success
-Wait for the triangle to fully form before entering a position1.
-Confirm the breakout with a close above/below the resistance/support level.
-Use additional technical indicators to confirm the signal.
-Pay attention to the volume, which should increase during the breakout.
Conclusion
Although ascending and descending triangles have relatively high success rates, it is important to use them in conjunction with other technical analysis tools and to take into account the overall market context to maximize the chances of success.

National aluminium co. Ltd ascending triangle breakout completeNSE:NATIONALUM Ascending triangle breakout complete
Do as directed
Weekly chart uptrend chart. Trading near strong support zone
Rising volume breakout
This is not trading recommendation or advise 🚨
Do your analysis before taking any step.

CANFINHOME - The Ascending Triangle PatternCan Fin Homes Ltd has recently exhibited a notable range-bound movement, forming an ascending triangle pattern that highlights its price consolidation phase. The stock oscillated between key price levels, with a significant high of 938 on July 1st and a low of 680 on June 4th, before peaking at 909.80 on July 25th. This range-bound behavior reflects a period of accumulation and steady buying pressure, as the price repeatedly tests the horizontal resistance while respecting the upward-sloping support line. This consolidation phase is crucial as it sets the stage for a potential breakout, indicating that the stock is gearing up for a significant directional move. The pattern suggests that investors are increasingly optimistic, with the price confined within these key levels, paving the way for future volatility and trading opportunities. In this analysis, we will explore three key trading strategies for CANFINHOME based on the recent ascending triangle pattern. First, we will examine the Breakout Strategy, which capitalizes on the price movement once it surpasses key resistance levels. Next, we will discuss the Pullback Strategy, focusing on entering trades during price retracements to the breakout level. Finally, we will consider the Breakdown Strategy, which prepares for a potential bearish reversal if the price falls below critical support levels. Each strategy will be detailed with entry points, stop losses, and targets to help you make informed trading decisions.
In this analysis, we will explore three key trading strategies for CANFINHOME based on the recent ascending triangle pattern. First, we will examine the Breakout Strategy, which capitalizes on the price movement once it surpasses key resistance levels. Next, we will discuss the Pullback Strategy, focusing on entering trades during price retracements to the breakout level. Finally, we will consider the Breakdown Strategy, which prepares for a potential bearish reversal if the price falls below critical support levels. Each strategy will be detailed with entry points, stop losses, and targets to help you make informed trading decisions.
Breakout Strategy:
Entry Point: For an optimal entry, consider buying above 914 as an early signal or above 938 for a regular entry. This indicates a confirmed breakout from the ascending triangle pattern, signaling strong bullish momentum.
Stop Loss: Place your stop loss just below the support level of 838. This precautionary measure helps safeguard against potential reversals or false breakouts.
Target: Set your price target around 1196. This level is calculated by adding the vertical height of the triangle to the breakout point, reflecting the expected upward movement based on the pattern.
Rationale: Entering at 914 or 938 allows you to capitalize on the upward potential following the breakout. With a stop loss at 838, you manage risk effectively. The target of 1196 aligns with the pattern’s projection, maximizing your profit potential.
Pullback Strategy:
Entry Point: Look for a buying opportunity during a pullback to the breakout level around 914 or the support level of 903.85. This approach leverages a temporary price retracement to secure a more advantageous entry.
Stop Loss: Position the stop loss below the support level of 838 to mitigate risk in case the pullback evolves into a deeper correction.
Target: Maintain the target at approximately 1196, consistent with the breakout strategy.
Rationale: The pullback strategy offers a chance to enter at a better price while confirming the validity of the breakout. The stop loss below 838 provides protection against significant losses, and the target of 1196 remains aligned with the anticipated price movement.
Breakdown Strategy:
Entry Point: If the price drops below the key support level of 838, consider this a breakdown of the ascending triangle pattern. This shift indicates a bearish reversal and a potential shift in market sentiment.
Stop Loss: Set the stop loss above the support level of 838 to prevent substantial losses if the breakdown proves to be a false signal.
Target: For a breakdown scenario, the target will need to be adjusted based on new technical analysis of lower support levels. Immediate downside targets should be reevaluated as the situation unfolds.
Rationale: The breakdown strategy addresses the possibility of a bearish reversal when the support level is breached. The stop loss above 838 helps limit potential losses, while the target will depend on further analysis of the emerging support levels.
Conclusion :
The ascending triangle pattern for Can Fin Homes Ltd indicates a bullish outlook with a potential price target of 1196 if the breakout is confirmed. The breakout strategy aims to capture the upward trend, while the pullback strategy provides an opportunity to enter during a retracement. Conversely, the breakdown strategy prepares for a potential bearish scenario if the support level is breached. Each strategy includes specific entry points, stop losses, and targets, offering a comprehensive approach to trading based on the pattern’s analysis.
Disclaimer :
The information provided in this article is for educational and informational purposes only and should not be construed as financial advice. Trading and investing in the stock market involve risk, and you should consult with a qualified financial advisor before making any investment decisions. The author and the publisher are not responsible for any losses or damages that may occur as a result of using the information provided in this article. Past performance is not indicative of future results. Always conduct your own research and due diligence before making any investment decisions.
*** Hint*** Use a buffer at entry to avoid false breakout

HAVELLS - Ascending triangle - Breakout - DailyName - HAVELLS
Pattern - Ascending triangle Breakout
Timeframe - Daily
Volume - Good volume
Cmp - 1996
Target - 2351
SL - 1957
Always welcome for any comments with your feedback or give it a like if you find it useful.

USHA MARTIN LTD..Ascending triangle breakout & retest on 200 ema..
good volumes & good bullish candles..
trade responsibly!

Ascending triangle breakout giving TGT 57, 75 from 35SBC exports forming ascending triangle pattern showing bullish trend from today,s breakout with high volume. The company is fundamentally strong highly conviction to achieve target in one month.
1st target -57
2nd target -75


Potential Bullish Breakout in SAPPHIRE | Long 1550-1600Key Points:
Pattern Observed : Cup and Handle Formation with Ascending Triangle
Failed Retest : Cup & Handle Retest Failed, indicating strong resistance
Support Level : Ascending Triangle suggests strong support around 1550-1600
Entry Zone : My entry price is between 1550 to 1600 INR
Target Price : Projected target price is 1866.80 INR
Volume Analysis : Increasing volume confirming bullish momentum
Indicators : RSI currently at 44.98, indicating potential for upward movement
Follow us to get notified about potential breakout stocks.
Disclaimer:
Not SEBI Certified : This analysis is for educational purposes only
DYOR : Do Your Own Research before making any investment decisions
Disclaimer : Trading involves risks, and past performance is not indicative of future results

JUBLINGREA LONG 550-555 (Ascending Triangle) First of all this is my first post on tradingview and i just started learning TA. So i recommand you to do your own research before making any decisions.
I bought some #JUBLINGREA at 550-555
My target price is anything above 600.
I am open to feedback and will be happy if you correct my mistakes if there is any on the analysis. Thank you. NSE:JUBLINGREA

KHAICHEM | Ascending Triangle Breakout | Swing TradeKHAICHEM | Ascending Triangle Breakout | Swing Trade
Chart Analysis
1) Stock taking support for long time
2) Ascending Triangle Breakout
