BPCL | Full strategy | Description for details 🔰 Hello my friends, here is the story I see behind this stock:
⭐Fibo: Might come on 0.3 or 0.5 seems good to buy here :)
⭐Pattern: Ascending triangle
⭐Volumes: HUGE on the D chart
⭐Possible trade activation on green zones + fibo retracement and hold if broken the ascending triangle neckline
⭐Trade will be activated on 1D if it makes a green bar on those lvls
⭐Risk: closing below trendline = SL and target = Winning trades should be trailed only :) ( my thinking, still if u want lvls i can provide them in comments :) )
🔰Am I taking this trade: No---Reason: Already in the trades of Naukri and PPL as posted last time :)
🔰 {Some info}
➼My name is Apoorv and I am a 2nd year Engineering student, I want to pursue trading as my career, and thus whatsoever setups or trades I potentially see on my charting platform, I post it here and share them with you all.
➼I hope you will love my simple analysis style.
➼Feel free to suggest your view on this as learning is earning here :)
➼I take my trades on my Zerodha account :)
➼These charts are my and only my work, my thought process, just from an educational point of view and no calls.
<<<<<>>>>>
Ascending Triangle

🔰 JUBLPHARMA | Read description for all information 🔰 Hello my friends, here is the story I see behind this stock:
⭐(Covids low - near time high )-FIBO made and saw that the stock retraced exactly 50%
⭐The white line u guys see is the fibo retracements, the stock also broke its 2nd last retracement imp lvl
⭐D chart as time frame and trade is positional basis :)
⭐Ascending Triangle consolidation at such good lvls + Breakout with volume and Power candle= Possible upmove
⭐Risk: 6% Risk and 12% target from today's closing :)
🔰Am I taking this trade: No---Reason: Already in the trades of Naukri and PPL as posted last time
🔰 {Some info}
➼My name is Apoorv and I am a 2nd year ELE student, I want to pursue trading as my career, and thus whatsoever setups or trades I potentially see on my charting platform, I post it here and share them with you all.
➼I hope you will love my simple analysis style.
➼Feel free to suggest your view on this as learning is earning here :)
➼I take my trades on my Zerodha account :)
➼These charts are my and only my work, my thought process, just from an educational point of view and no calls.
<<<<<>>>>>

BPCL- Ascending Triangle Pattern Breakout?NIfty50 stock BPCL formed Ascending triangle pattern.
You can see Rising lower trend line having ascending Higher Lows and a Flat upper trend line acting as resistance line.
I have marked A and B point, to calculate the target.
Price at A point = 252
Price at B point = 478.65
Formula to calculate the target is
Target = (Price difference between A & B) + Price at point B
Price difference between A & B = 478.65 - 252 = 226.65
Target = 226.65 + 478.65 = 705.30
So we can have our positional target near 705.30
This is my personal view about BPCL. Take it as educational purpose. I am not sebi registered or any Stock market expert. I am not responsible for profit or loss.

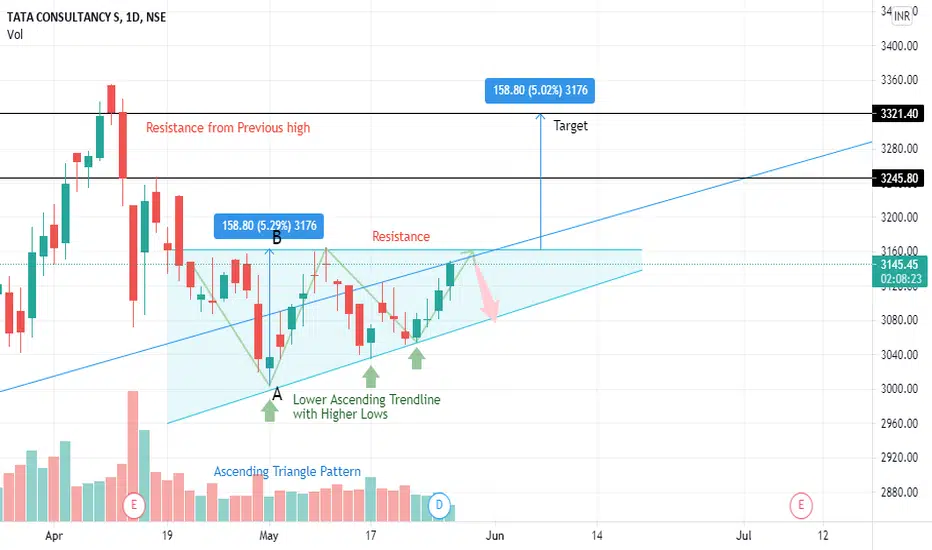
TCS Breakout with Ascending Triangle ?My idea about TCS is clearly visible in Chart.
You can see a Ascending Triangle Pattern formation. Its mostly known for a Positive direction breakout.
We have a lower ascending trendline which is also acting as a support line. You can see Higher lows. Whenever there are higher lows we can say stock is in Up trend.
Upper horizontal trend line is resistance line, you can see the Flat Highs.
This two trend line forming a pattern known as Ascending Triangle Pattern.
So what to do now? Where to take entry?
The answer is simple. We will wait for a breakout. Whenever the stock price breaks the Upper horizontal trendline (resistance). We can take entry after a confirmation candle. For short term or positional as per your preference. But my recommendation is for long term.
Technically you can find your target with a simple calculation.
See in chart, I have measured the distance from resistance to first Low.
A - B = 158.80
Add 158.80 in resistance line price
158.80 + 3164.20 = 3323
We can expect Target near 3323. also you can see this target is near to the resistance from previous highs.
Stock is IT sector leader. Fundamentally strong. Performance is consistently increasing. Nifty 50 stock. Also listed in foreign market.
Can we expect a Bull run ? What do you think ?
This is my personal view. I am neither sebi registered nor stock market expert. You do your own analysis. I am not responsible for any Profit or Loss.
Naukri - Ascending Triangle (short term idea)Naukri is forming an ascending triangle
Good pick for short term trade
Enter around 4330
Stop Loss - 4300
Target - 4500
To encourage my work, give a like and show your support. Thank you!
Happy Trading!
Regards,
Segan

Naukri Analysis | Multi time frame Well I see a good breakout on 1hr SL could be = 3.5% from this point and target 1 = 7% more :)
Lets hope for the best :)

IRCTC Ascending triangle in the making.IRCTC is taking support at rising trend line multiple times.
Ascending triangle is clearly visible. This pattern gives smooth move on upside.
Similarly Descending triangle gives smooth move in downside.
Currently IRCTC is moving in narrow range ( marked by dotted line ) either side break.
If it breaks on downside that will mark a lower high and new Lower low will be there, this will make stock bearish.
at each arrow marked low will be the targets.
If it breaks on high side it will touch the upper resistance marked, eventually we can expect a strong move on upside.
My take is as the stock is in continuous uptrend on longer charts. I can take the smaller risk now, or can enter with small quantity ( 1/3 or 1/2 ) depending of the risk appetite.
Stop loss is not even 15 %
Therefore for long term view or positional traders can go long keeping in mind the risk involved
When it crosses range on upside it will move more 60 70 rs away from stop loss, there by increasing the risk.
Plan well and trade accordingly.
Tip: Whenever you see any pattern forming always convert your drawings from candlesticks to line chart. This will give you an edge in the trade.
Not a recommendation, do your analysis & then enter.

Ascending Triangle and Rounding Bottom with Big Potential growthAll the details are being uploaded in video, kindly refer it.

FINOLEX CABLES : BUILDING FOR UPMOVE. NSE:FINCABLES
An ascending triangle is forming on FINCABLES
It may act as short term bullish reversal as if it breaks the high of the peak,
It's unable to break it in the previous 4 attempts and the range is getting narrow, has strong resistance at 430 level for almost a year.
Wait for breakout then enter.
Always define risk in prior.
For educational purpose
Not a Trade Advice or Recommendation.
Do your analysis or Consult your Advisor.

Coal India | Both side tradable Well if u see the big picture then it's like a good move then a correction = Still bullish and if gives a breakout above the near high = a possible trade according to your risk system :)
Also, we can see an amazing head and shoulder move + a downside flag too + bearish too :)

#BHEL Ascending Triangle.Bharat Heavy Electricals Limited
After forming an ascending triangle, BHEL is ready to fly. A breakout will help BHEL take-off. Wait for a 4h candle to break and buy.
Educational purpose only - trade at your own risk.
Good luck.


RKEC SIMPLE PRICE ACTION CHART🎯All Studies mentioned in the chart💰
Buy @60-63 range
Strict sl below 55
Reasons for selecting this stock ✔ ✔
✔ Something cooking in the chart.Can see Ascending triangle in the chart.
✔ Infrastructure developing company,mainly involved in marine infrastructure development.
✔ One of the main cmpany which is involved in marine infrastructure activities.
✔ Gradually increasing Y-O-Y profit.
✔ Good consolidation with delivery volume.So, can see a breakout at anytime.
About the company ✔ ✔
RKEC Projects is engaged in the business of Civil Works and specialized in Marine Works, Construction of Roads, Buildings, Bridges& Fly overs, Survey works under Unmanned Aerial Systemsetc.
Thank you🧡
Like🍂Comment🍂Support

Ascending pattern + Insider bar + Island Chart | #Breakouttriple bonanza breakout it is :) if closes on these levels very good upside will be coming :)


ZENTECHForming an ascending triangle pattern. Buy above 75.5 with SL of 72, targets 80,92&102.5 in swing to short term.
☠️☠️☠️☠️
Above ideas are for educational purposes only, kindly consult your financial advisor before investing.
Please dont forget to like and subscribe if you like the idea


Kotak Mahindra Bank | Positional Setup Kotak bank it is :) if such good banks are giving u such great patterns, never judge them or speculate anything, trade with proper risk and take the trade for once :)
Happy trading :)

State Bank Of India | Multiple trade opportunitiesPinbar at such resistance lvls tells a good story for future, keep this stock in mind :)
Happy trading to u all !!
For now, those in trade be in it and those who want to take a good entry should wait for a good bullish pattern to go forward from here ..
seems super bullish tho.

PNB LONG My prediction On PNB is based price action trading
1. ASCENDING TRIANGLE PATTERN
2. W PATTERN
best price to buy = below 39
target = 43 - 45
Stop Loss = 30-32
expected No of days to reach target = 7 - 15 days

Ascending Triangle BreakoutThe price should sustain levels at 80.Enter above 81.Volume accumulation also looks good. Have patience.

Stock Analysis of Escorts LimitedPrice - 1176.20 Dt. - 19.05.2021
Since Feb 2nd week the stock is in the bearish zone and lost 300 points in this time period. From 3rd May stock reversed the trend resumed the up move. The stock was near the overbought zone. Further with good monsoon expectation and declining covid-19 cases are another reason for Escorts Limited to move upward. Stock is facing strong resistance at 1185 levels but with ascending triangle formation we are expecting the stock to break the level.
Stock is slightly above 21 DEMA.

RLong
