Nifty Intraday levels for 10 May 2021 (Triangle Pattern)Execute Long Only if the RSI Breaks the trend line and the price should be above 14870 for a target of 14980.15000 will be our Strong Psychological Resistance as per Open interest.
Execute Short below 14770 , as the price breaks the Strong support of 14800 ( As per open interest ) for target of 14670 & 14600 levels.
Right now , Index is in indecisive mode. Don't take heavy positions.
Kindly share your valuable feedback.
Disclaimer: Kindly do your own analysis or consult your advisor before taking any trade. This view is for Educational purpose only.
Ascending Triangle


Grauer & Weil, forming ascending TriangleLast few weeks it was moving in narrow range at the Lower trend line of the ascending traingle. It touched the lower trend line gave narrow ramge break with volumes.
Ascending Triangle breakout is still awaited.
Based on range break, can enter in parts here.
Range break
Not a recommendation
For educational purpose

BPCL, slightly risky but if works will be worth it.BPCL is forming ascending Triangle.
It's Interesting to see the rejections at the resistance level marked by red arrows, because those 2 candle show strong reversal with upper wicks and short bodies , following by big down move.
The Trend line is acting as a good support since March 2020 fall. It's been tested multiple times, that's why I mentioned slightly risky
Reason for going long, bullish engulf candle at supporting trend line. SL will be around previous support at trend line around 370 area. At this entry point risk reward is most favorable being closer to the support.
First target will be the resistance zone yellow area.
Yellow marked area Being a strong rejection zone, if crossed will trigger a sharp upmove or will be crossed will be crossed with sharp move. Next target is much much higher, that's why most favorable risk reward at current levels.
Week on week for 4 weeks now volumes picking up.
On daily chart below see, check the stock is in narrow range and at the upper end of it.
Check previous Idea on BPCL
Link attached

Bharti airtel ascending triangleThe stock is consolidation more than a month and gave a range level breakout and bull run started and now the stock forming ascending triangle and breakout with target of 600 for this month


ASCENDING_TRIANGLE_BREAKOUTBHARTI AIRTEL has shown ASCENDING_TRIANGLE_BREAKOUT on hourly time frame after retest there can be an entry in it target given on the chart stop-loss on the TrendLine


Andhra Sugars - Ascending triangle Breakout with Volumes - Good Fundamentals (Increasing Top and Bottom line figures)
- Breakout from an Ascending Triangle pattern with volume expansion
- Stock has volatility and thus a retest after the breakout is expected
- Good entry level at 367 with a stoploss of 316
- A consolidation near the breakout zone is expected
- High volume noticed in many other sugar stocks

MCX Mentha oil - Ascending Triangle Pattern FormationMCX Mentha oil can try to collapse up to the support line before hitting the following targets: 986 - 1000 - 1020
Attention: don't buy below the support trendline.
This MCX Mentha oil research is based on the Feb 24 article. Click the below link to read it:

Hindalco - Ascending TraingleHindalco moving in an Ascending Triangle.
Tested Resistance at 375 multiple times. Resistance breakout can take price up to 400 levels.
Targets mentioned on chart.

Godrejprop - Trend line break Price rejecting from the trend line for consecutive number of times since after setting a new high. Now price almost reached the support and it is getting ready to break.


TATA POWER TRADE IDEA | 8/4/21All the reasons for the trade have been explained in the video.
---HAPPY TRADING

ADANI PORTS ON 15 MINS CHARTAdani port has made Triangle price action pattern. It can also be called Ascending triangle. As we have discussed earlier a lot of times that Ascending triangle is a neutral pattern n it can give breakouts or breakdown ie can move either side up or down. Traders are told to hold target of the exact price range of triangle patterns high n low. Trade safe. Look for long setup when pattern is broken with good volume & vice averse for short trade too.


FILATEX Ascending Triangle BreakoutNSE:FILATEX Levels are Mentioned in the chart... Look for Swing
Note:
1. Views are personal. Recheck and take the trade as per your RR.
2. Always remember SL is your lifeline not the big target...
3.Follow us for more patterns and like, share so that we feel it is helpful to many and share more patterns...
3. Views given here is not a tip rather it is for educational purpose... After market opens, the condition might change so learn to handle for different conditions..
4. To learn more about patterns, Psychology behind the trade and price action trading... contact us.. Thanks..

Nifty - Ascending Triangle Pattern
Buy Level = Above 14890 (Target 1 - 15000, Target 2 - 15330)
Sell Level = Below 14750 ( Target 1 - 14600, Target 2 - 14500)
Please comment and let me know if you have any other ideas or observations or queries. Please feel free to reach out to me on Trading View.

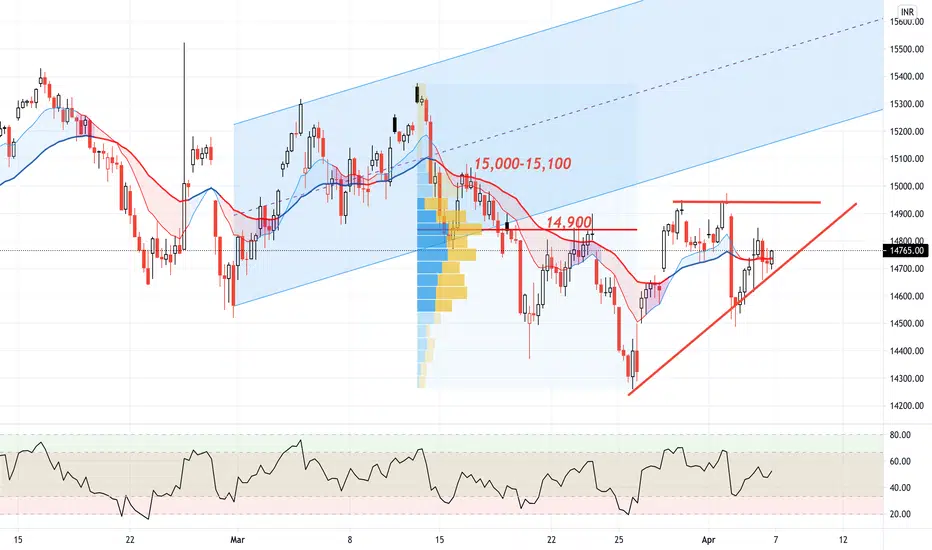
Nifty InstaView 07 Apr’21: Verge of a BreakoutNifty View: It was a good day for the benchmark Nifty index as it extended its rally further. A look at the 75-minute chart suggests that prices are on the verge of a break out from an ascending triangle. The underlying short-term trend is still very much up and a break above this triangular pattern will set in fresh buying impetus for the index and the overall market. However, we should not forget that in the last two months the short-term trend has been fairly volatile and so we will continue to trade cautiously on either side of the market and stick to short-lived trades only. In terms of levels, a sustained close above (14,900–15,000) level for the index will set in positive sentiment for the overall market.
Thank you for following my work and please feel free to share your thoughts and suggestions.
Trade Well. Trade Wise.

Nifty InstaView 06 Apr’21: Unpleasantly VolatileNifty View: Intraday volatility continues as the benchmark Nifty index consolidated yesterday’s sharp sell-off today. The nascent underlying short term UP trend is now vulnerable for a reversal. On the 75min chart we can clearly observe a range bound activity for the Nifty which is taking the shape of an Ascending Triangle. A break below today’s low of 14,616 will trigger fresh weakness for the index. On the upside, the index needs to break and sustain above 14,900 for some positive sentiment and momentum. Till then, stay directionally unbiased and keep your trades as short lived as possible.
Thank you for following my work and please feel free to share your thoughts and suggestions.
Trade Well. Trade Wise.
POWERMECH Ascending Triangle BONSE:POWERMECH Levels already mentioned.. Good for Swing...
Appreciate our work by like, share and following..
Note:
1. Views are personal. Recheck and take the trade as per your RR.
2. Always remember SL is your lifeline not the big target...
3.Follow us for more patterns and like, share so that we feel it is helpful to many and share more patterns...
3. Views given here is not a tip rather it is for educational purpose... After market opens, the condition might change so learn to handle for different conditions..
4. To learn more about patterns, Psychology behind the trade and price action trading... contact us.. Thanks.

TEAMLEASE Ascending triangle BreakoutNSE:TEAMLEASE Levels already mentioned.. Good for intraday to Swing...
Appreciate our work by like, share and following..
Note:
1. Views are personal. Recheck and take the trade as per your RR.
2. Always remember SL is your lifeline not the big target...
3.Follow us for more patterns and like, share so that we feel it is helpful to many and share more patterns...
3. Views given here is not a tip rather it is for educational purpose... After market opens, the condition might change so learn to handle for different conditions..
4. To learn more about patterns, Psychology behind the trade and price action trading... contact us.. Thanks.
