ASHOKLEY Price Action1. Trend Bullish
2. Breakout & reveral set up
3. Resistance turning into support
4. Higher protected lows through out the trend and still continues
Ashokleyland

Ashok Leyland (D): Strongly Bullish, Blue-Sky BreakoutThis is a high-conviction, fundamentally-driven breakout. After a volatile re-test, the stock has confirmed its breakout above a key consolidation zone and is now in a "price discovery" phase, backed by exceptional volume and strong earnings.
🚀 1. The Fundamental Catalyst (The "Why")
The explosive move this week is powered by a strong Q2 2026 earnings report (announced Nov 12). The positive results and dividend declaration provided the high-conviction "fuel" for the market to absorb the failed re-test and drive the stock to a new all-time high.
📈 2. The Decisive Breakout (The "Whipsaw")
- Part 1 (The Breakout): On Nov 11 , the stock broke above the horizontal resistance from Sep 2025 (at the ₹144-₹146 level).
- Part 2 (The "Fakeout"): On Nov 12 , the stock failed its re-test, closing below this new support. This move likely trapped bearish traders.
- Part 3 (The Confirmation): Today, Nov 13 , the stock gapped up (opening above the resistance) and surged +5.53% on massive 53.62 Million volume. This powerful move creates a new all-time high and confirms the breakout is real.
📊 3. Confluence of Bullish Indicators
- Volume: The consolidation phase had below-average volume. Today's 53M+ share volume is a massive spike, confirming institutional participation.
- RSI: The Relative Strength Index is rising on the Daily, Weekly, and Monthly charts .
- EMAs: The short-term Exponential Moving Averages are in a "PCO" (Price Crossover) state on all three timeframes .
This alignment of all three timeframes, combined with the fundamental catalyst, gives this breakout a very high probability of success.
🎯 4. Future Scenarios & Key Levels to Watch
The stock is now in a "price discovery" trend.
🐂 The Bullish Case (Momentum Continues)
- Trigger: The stock is in a new uptrend with no overhead resistance.
- Target: ₹161 is the first logical objective.
🐻 The Pullback Case (Support Test)
- Trigger: If the stock pauses to digest its 5.5% single-day gain.
- Support: The price would likely fall to re-test the resistance-turned-support at ₹144 . A "bounce" off this level would be a textbook confirmation of the new support floor and an ideal entry point for those who missed the initial surge.

Ashok Leyland (CMP ₹141.5) Pattern: Cup formation nearing neckline resistance.
Structure: Price consolidating near resistance zone of ₹143–145 after a rounding bottom recovery.
Indicators:
RSI steady around 60, mild bullish bias.
MACD positive, slightly flattening — needs fresh momentum.
Price above 50 & 200 EMA — trend intact.
Trade Plan:
📈 Buy above: ₹144 (confirmation above neckline)
🛑 Stoploss: ₹140
🎯 Targets: ₹149 / ₹152.4
View: Short-term consolidation but potential continuation if ₹144 breaks with volume.

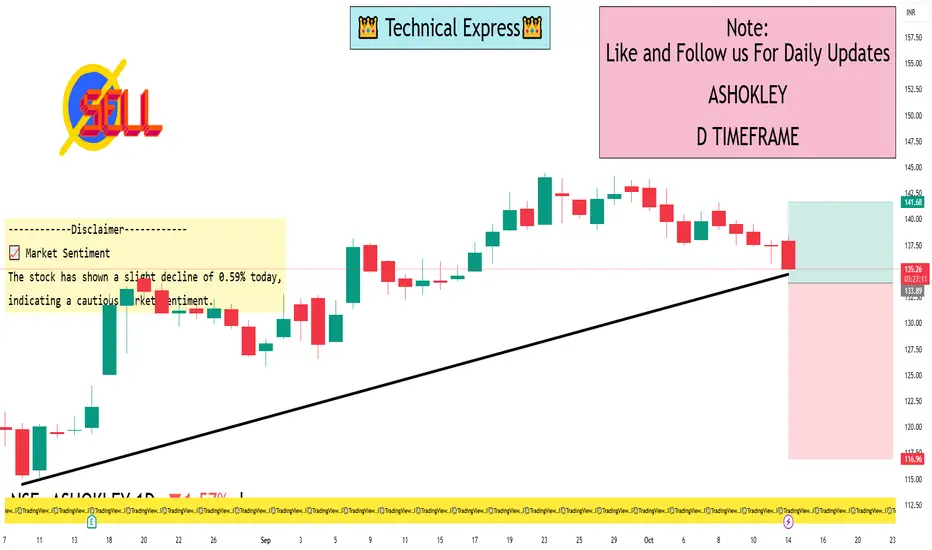
ASHOKLEY 1 Day View 📊 Intraday Support & Resistance Levels
Based on recent technical analysis, the key intraday levels for ASHOKLEY are:
Support Levels: ₹135.86, ₹137.53
Resistance Levels: ₹139.32, ₹141.61
The stock is currently near its support zone, which may present a buying opportunity if it holds above ₹137.53. A break below ₹135.86 could lead to further downside.
📉 Technical Indicators
RSI (14): 40.08, indicating neutral momentum.
MACD: -0.45, suggesting mild bearishness.
Moving Averages: Trading below the 5-day, 50-day, and 200-day moving averages, reinforcing the bearish sentiment.
📈 Market Sentiment
The stock has shown a slight decline of 0.59% today, indicating a cautious market sentiment.
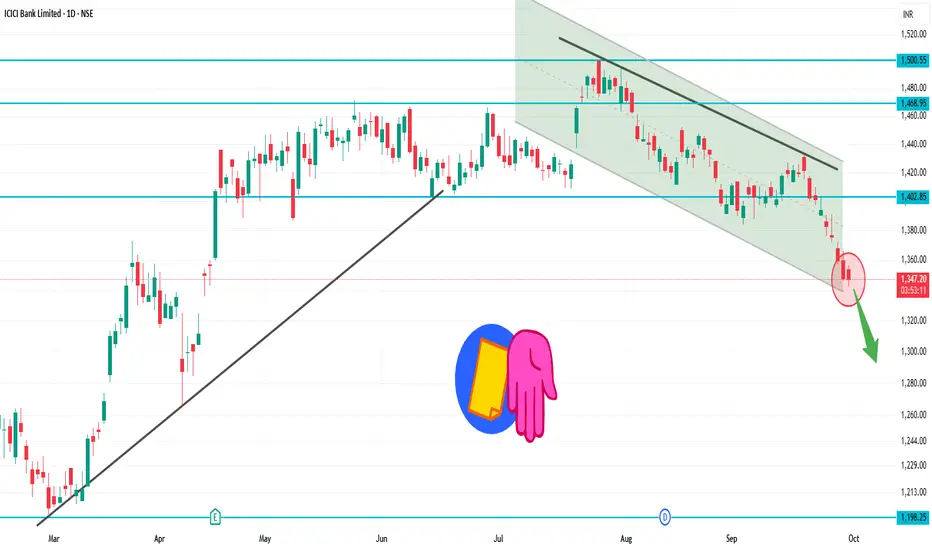
ICICIBANK 1D Time frame₹1,345.80 (NSE)
Day’s Range: ₹1,342.60 – ₹1,356.60
52-Week Range: ₹1,186.00 – ₹1,500.00
📉 Technical Overview
Trend: The stock is trading below its 200-day moving average, indicating a mildly bearish trend.
RSI: Currently at 26.6, suggesting the stock is in the oversold zone.
MACD: At -10.01, reinforcing the bearish momentum.
Moving Averages: A strong sell signal is indicated, with 0 buy signals and 12 sell signals across various timeframes.
🔼 Potential Upside (Rise)
Immediate Resistance: ₹1,355 – ₹1,365
Breakout Target: Above ₹1,365, the next resistance is around ₹1,380 – ₹1,390.
Bullish Confirmation: A close above ₹1,390 could signal a reversal or consolidation.
🔽 Potential Downside (Fall)
Immediate Support: ₹1,340 – ₹1,330
Breakdown Target: Below ₹1,330, the stock may test ₹1,310 – ₹1,300.
Bearish Confirmation: A close below ₹1,300 would strengthen the bearish outlook.
✅ Summary
Above ₹1,365: Potential rise toward ₹1,380 – ₹1,390.
Below ₹1,330: Potential fall toward ₹1,310 – ₹1,300.
Between ₹1,330 – ₹1,365: Likely range-bound movement.
AXISBANK 1D Time frameTrading close to ₹1,130.
This is slightly below the earlier ₹1,160–₹1,170 zone we discussed, so the range shifts down.
🔼 Upside (Rise Possibility)
Immediate resistance near ₹1,140 – ₹1,145.
If price breaks and sustains above this, it can move to ₹1,155 – ₹1,165.
Strong momentum above ₹1,165 may extend toward ₹1,175.
🔽 Downside (Fall Possibility)
First support is at ₹1,120 – ₹1,115.
If that breaks, price could slip toward ₹1,105 – ₹1,095.
Closing below ₹1,095 would weaken the trend further.
✅ Summary for Today
Above ₹1,140 → rise possible till ₹1,155 – ₹1,165.
Below ₹1,120 → fall possible till ₹1,105 – ₹1,095.
Between ₹1,120 – ₹1,140 → sideways range.

Ashok Leyland – Technical Research ReportAshok Leyland continues to maintain a strong uptrend across all time frames, forming higher tops and bottoms. The weekly chart confirms a "Rounding Bottom Breakout" above ₹134, backed by strong volume participation, which indicates sustained bullish interest.
The stock is comfortably trading above key moving averages (20, 50, 100, 200 SMA), adding further confirmation to the trend strength. A margin of safety zone has been identified near ₹134–₹136 levels, where value buying is likely to emerge in case of dips.
Strategy: Buy on dips towards support levels.
Targets: As per measurement rule
Stop-Loss: As per classic chart pattern rule
Overall outlook remains bullish with momentum indicators like RSI supporting continued upside.

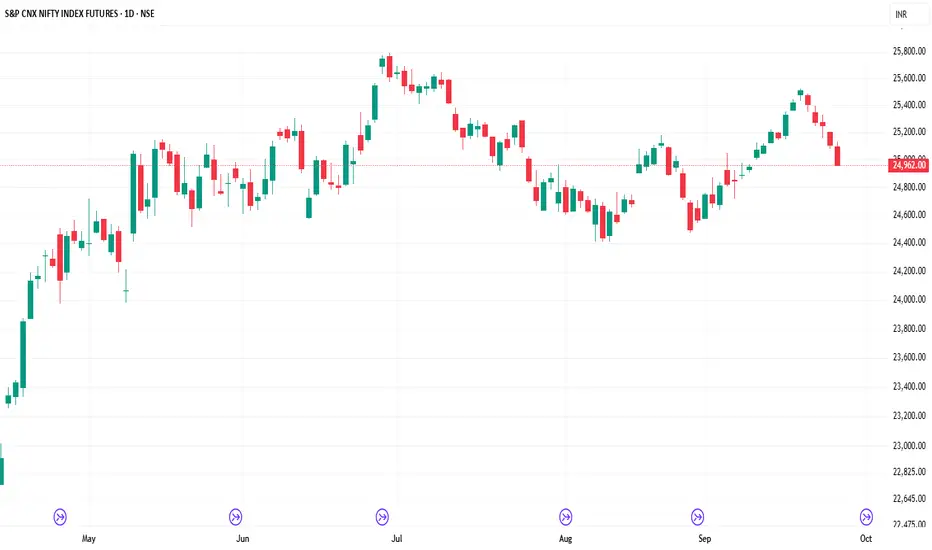
SENSEX 1D Time frameOpening Level: ₹80,500
Current Level: ₹80,15.23
Day's Range: ₹80,300 – ₹80,800
🔑 Key Support & Resistance Levels
Immediate Support: ₹80,500
Immediate Resistance: ₹81,000
Pivot Point: ₹80,745.23
📊 Market Sentiment
Trend: The Sensex has experienced a six-day losing streak, indicating bearish momentum.
Reuters
Volume: Trading volume is significantly higher than its 20-day average, suggesting increased investor activity.
📈 Strategy (1D Timeframe)
1. Bullish Scenario
Entry: Above ₹81,000
Stop-Loss: ₹80,500
Target: ₹81,300 → ₹81,500
2. Bearish Scenario
Entry: Below ₹80,500
Stop-Loss: ₹81,000
Target: ₹80,200 → ₹80,000
⚠️ Risk Management
Limit risk to 1% of capital per trade.
Always use stop-loss to protect against unexpected market movements.
Monitor broader market trends and sector-specific news that may impact index performance.

INFY 1D Time frame📊 Daily Snapshot
Closing Price: ₹1,484.65
Day’s Range: ₹1,476.50 – ₹1,502.70
Previous Close: ₹1,494.60
Change: Down –0.64%
52-Week Range: ₹1,307.00 – ₹2,006.45
Market Cap: ₹6.17 lakh crore
P/E Ratio (TTM): 22.62
Dividend Yield: 2.90%
EPS (TTM): ₹65.63
Beta: 1.09 (indicating moderate volatility)
🔑 Key Technical Levels
Support Zone: ₹1,469 – ₹1,473
Resistance Zone: ₹1,485 – ₹1,490
Pivot Point: ₹1,480.97 (Fibonacci)
All-Time High: ₹2,006.45
📈 Technical Indicators
RSI (14-day): 44.45 – approaching oversold territory, suggesting potential for a rebound.
MACD: Negative at –6.34, indicating bearish momentum.
Moving Averages: Trading below the 50-day (₹1,511.06) and 200-day (₹1,495.15) moving averages, indicating a bearish trend.
Stochastic RSI: Between 45 and 55, indicating a neutral condition.
CCI (20): Between –50 and 50, implying a neutral condition.
📉 Market Sentiment
Recent Performance: Infosys experienced a decline of 0.64% on September 25, 2025, underperforming the broader market.
Volume: Trading volume was significantly higher than its 20-day average, indicating increased investor activity.
📈 Strategy (1D Timeframe)
1. Bullish Scenario
Entry: Above ₹1,485
Stop-Loss: ₹1,469
Target: ₹1,490 → ₹1,500
2. Bearish Scenario
Entry: Below ₹1,469
Stop-Loss: ₹1,485
Target: ₹1,460 → ₹1,450
MARUTI 1D Time frame📊 Daily Snapshot
Closing Price: ₹16,240
Day’s Range: ₹16,063 – ₹16,375
52‑Week Range: ₹10,725 – ₹16,375
Market Cap: ₹5.1 lakh crore
P/E Ratio: 35.1
Dividend Yield: 0.83%
EPS (TTM): ₹463.5
Beta: 0.88 (lower volatility)
🔑 Key Levels
Support Zone: ₹16,100 – ₹16,150
Resistance Zone: ₹16,300 – ₹16,375
All-Time High: ₹16,375
📈 Strategy (1D Timeframe)
1. Bullish Scenario
Entry: Above ₹16,300
Stop-Loss: ₹16,150
Target: ₹16,500 → ₹16,600
2. Bearish Scenario
Entry: Below ₹16,100
Stop-Loss: ₹16,150
Target: ₹15,900 → ₹15,800

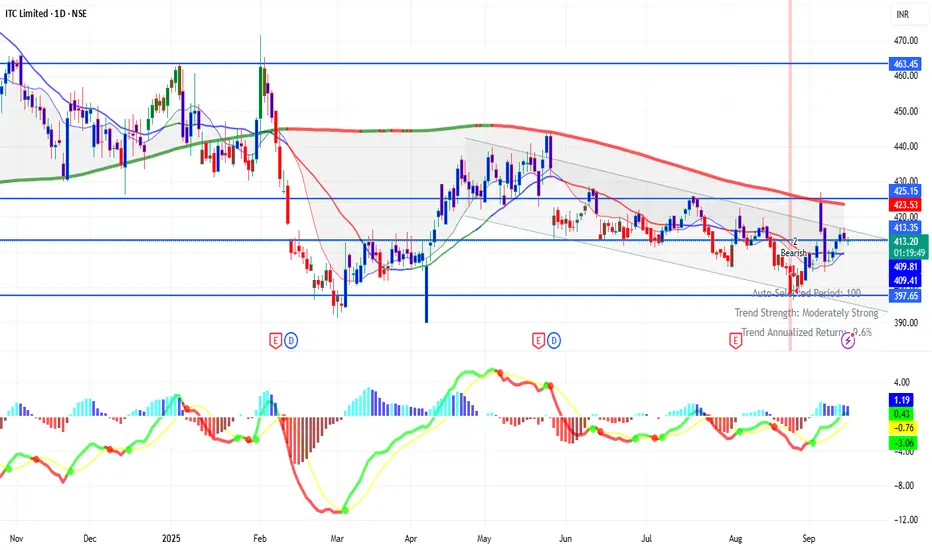
ITC 1D Time framePrice Action
Current Price: ₹413.75 (approx)
Day’s Range: ₹413.05 – ₹414.30
52-Week Range: ₹390.15 – ₹528.50
🔹 Support & Resistance
Immediate Support: ₹410 – ₹408
Next Support: ₹402 – ₹397
Immediate Resistance: ₹416 – ₹420
Next Resistance: ₹422 – ₹428
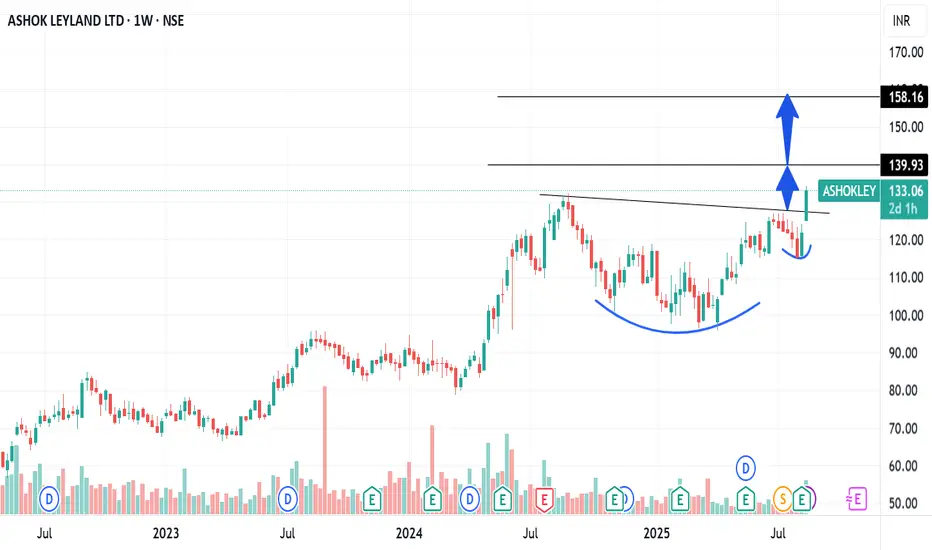
ASHOKLEYLAND C&H PATTERN BREAKOUTAshokleyland breaking C&H pattern weekly basis
with huge volume this week
bullish RSI above 60
trading above 20 ema
#target1-140, #target2- 158
sl- 115 auto sector in focus
NO BUY/SELL RECOMENDATION
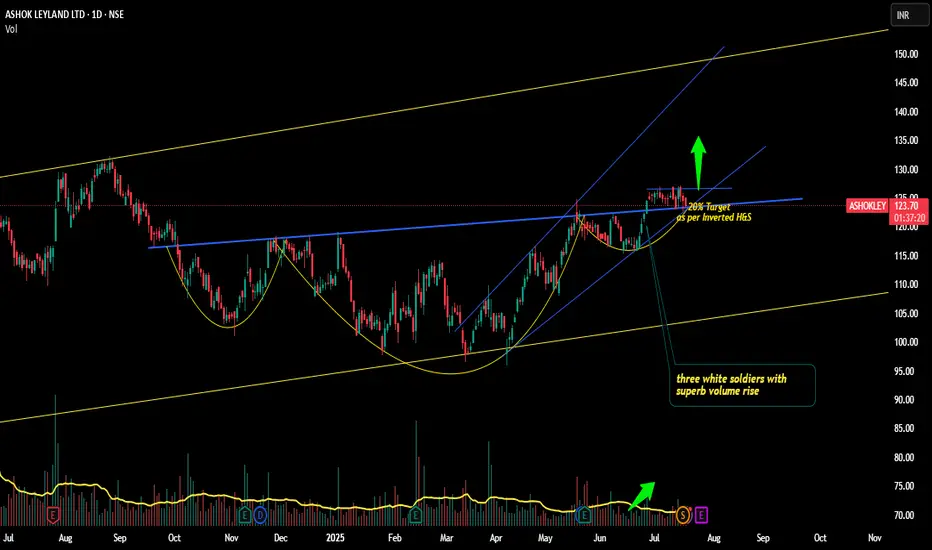
Ashokleyland Truck and Bus loaded with BULLS ?!!Yes!!!!
Chart patterns suggest me the above titled opinion of mine.
Reasons-
1. It's moving in a Ascending channel pattern from MARCH 2020 TILL NOW
2. 3 Upside candles(3 white soldiers) in monthly timeframe(shown below) with good rise in volumes
3. In weekly time frame, Bullish Marubozu candle Breakout seen with good volumes (shown below)
4. Coming to daily time frame, Inverted h&s pattern looks visible and Breakout has happened and now retesting.(there also 3 white soldiers visible)
5. As per pattern , target is about 20% from current levels.(soon to 150 level. )
6. We can enter now with sl as daily close below 120.4, targets -130,138,144 levels
Ashokleyland looks way good for the long term investment (buy and forget) too!! !
This is just my opinion...not a tip nor advice!!!!
Happy trading!!!!
Thank you!!!!
ASHOKLEYLAND DOUBLE BOTTOM BREAKOUTAshokleyland breaking double bottom reversal pattern
with good volume buildingup
bullish rsi,rsi divergence
#target 228,after breaking 228 only
#target 236
NO BUY/SELL RECOMENDATION

ASHOK LEYLAND LONG IDEA......Pros
Ashok Leyland chart looks good for reversal.
Auto sector looks relatively strong compared to other sectors in this fall.
Risk:Reward
Stoploss is Trend line breakdown. Target is ATH. Which gives best Risk:Reward.
Cons: Broader Market is very bad currently. One +ve thing in this market is "It is oversold". So Risk Management is very important now.
Note This is Technical view only. No idea about Fundamentals.

Ashok Leyland - Decisive LevelStock Currently in area of High Interest Zone
Chance to chose a path n go forward any ways
Current candle can act as a decisive one
Bullish above 227 with Sl below 224
Bearish below 224 with Sl above 227
Targets can be 236 & 215 respectively
224 - 227 236 215

ASHOKLEYLAND - Example of history repeats!Overview & Observation:
1. Beautiful clean breakouts.
2. Broke multiyear resistance level.
3. Earnings are strong.
4. Expecting a minor consolidation and further upmove
Trade Plan:
1. Keep it on radar, and track it closely.
- Stay tuned for further insights, updates and trade safely!
- If you liked the analysis, don't forget to leave a comment and boost the post. Happy trading!
Disclaimer: This is NOT a buy/sell recommendation. This post is meant for learning purposes only. Please, do your due diligence before investing.
Thanks & Regards,
Anubrata Ray

BUY ASHOK LEYLANDBUY ASHOK LEYLAND for target price 253, as it broke the trendline and made double bottom and will break this flag structure to continue till 253.

ASHOKLEYLAND H&S BREAKOUTAshokleyland breaking h&s reversal pattern
with huge volume building up
bullish rsi,trading above 20ema
#target 263 soon
sl 215
NO BUY/SELL RECOMENDATION

Ashok Leyland: Bullish Reversal with Strong Upside PotentialAshok Leyland is showing strength near its major support range of 212-220, and the daily chart suggests potential upside targets at 243.27 and 258.10. These targets could be achieved within the week, supported by several technical indicators pointing towards a bullish reversal.
Long-term RSI levels are all above the critical 50 mark, indicating positive momentum, with the exception of RSI-7, which is trailing behind, suggesting there’s still room for the shorter-term RSI to catch up and drive further gains.
Additionally, a perfect hammer candle has formed on the weekly chart at this support zone, a classic signal of a potential bullish reversal.
With the technicals lining up, Ashok Leyland looks poised for a strong move upwards, making it a stock to watch closely in the coming days.

ASHOK LEYLAND - SHORT TRADE FOR HUGE PROFITSymbol - ASHOKLE
ASHOKLE is currently trading at 260
I'm seeing a trading opportunity on sell side.
Shorting ASHOKLE Futures at CMP 260
I will be adding more position if 270 comes & will hold with SL 273
Targets I'm expecting are 242 - 225
Disclaimer - Do not consider this as a buy/sell recommendation. I'm sharing my analysis & my trading position. You can track it for educational purposes. Thanks!

Ashok Layland seems to be set for a breakoutIts showing a classic Cup with Handle pattern a breakout with good volume can be a good time to enter.

Ashok Leyland - BullishAfter long downtrend, stock now retraced from strong support area
Made 1st HL 2 days back
As per FIb and Wave theory it seems stock may rise from near 242 areas, While 239-40 will act as the strongest support
Risk reward is excellent
Can expect 260++ again in coming days
