ASIANPAINT - STWP Equity Snapshot________________________________________
STWP Equity Snapshot – Asian Paints Ltd (ASIANPAINT)
(Educational | Chart-Based Interpretation)
________________________________________
📌 Intraday Reference Levels (Structure-based)
Reference Price Zone: ~2,890–2,910
Risk Reference (If price weakens below structure): ~2,755
Observed Upside Areas: ~3,075 → ~3,195
________________________________________
📌 Swing Reference Levels (Hybrid Model | 2–5 days | Observational)
Reference Price Zone: ~2,890–2,910
Risk Reference (If structure breaks): ~2,685
Higher Range Area (If strength continues): ~3,325 → ~3,645
________________________________________
🔑 Key Levels – Daily Timeframe
Support Areas: 2,836 | 2,776 | 2,744
Resistance Areas: 2,928 | 2,960 | 3,020
________________________________________
🔍 STWP Market Read
Asian Paints remains in a clear upward trend. After a strong move, the stock faced selling near earlier highs and then moved into a short sideways phase. Price has now found support near the highlighted zone, showing that buyers are still active.
The structure remains positive as long as price holds above this support area. Momentum is healthy but controlled, suggesting the stock may move gradually rather than sharply in the near term.
________________________________________
📊 Chart Structure & Indicator Summary
Structure: Higher highs and higher lows
Trend: Up
Momentum: Strong but not stretched
RSI: Healthy zone (~62)
Volume: Above average, indicating participation
________________________________________
📈 Final Outlook (Condition-Based)
Momentum: Strong
Trend: Up
Risk: High (stock is near important resistance)
Volume: High
________________________________________
💡 STWP Learning Note
Strong stocks often pause before moving further. These pauses help price cool down and allow the trend to continue in a healthier way. Focus on structure, not predictions.
________________________________________
⚠️ Disclaimer
This post is shared only for educational and informational purposes. It is not a recommendation, advice, or solicitation. Equity markets involve risk. Please consult a SEBI-registered financial advisor before making any trading or investment decision.
________________________________________
📘 STWP Approach
Observe price behaviour. Respect risk. Let structure guide decisions.
________________________________________
💬 Did this snapshot help you read the chart better?
🔼 Boost to support structured learning
✍️ Share your views in comments
🔁 Forward to someone learning price action
👉 Follow for clean, beginner-friendly STWP insights
🚀 Stay Calm. Stay Clean. Trade With Patience.
Trade Smart | Learn Zones | Be Self-Reliant 📊
________________________________________
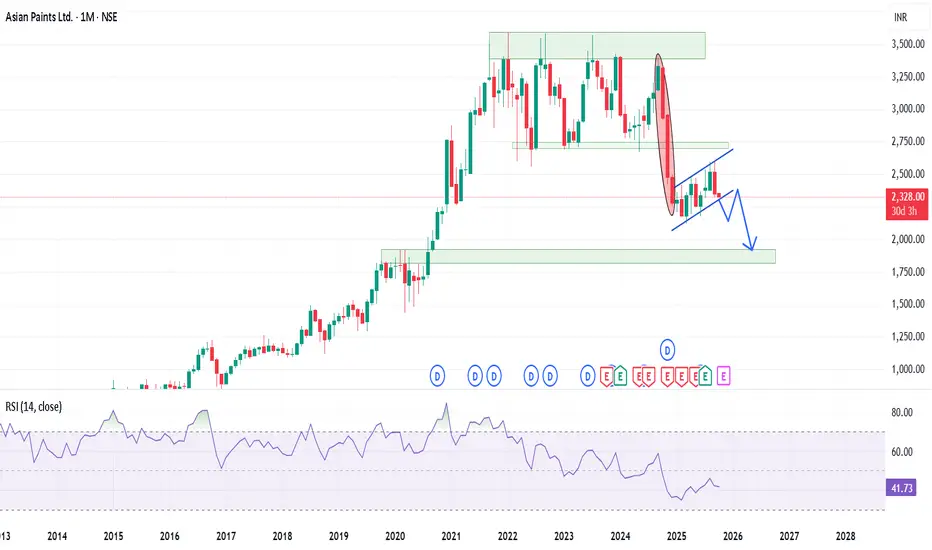
ASIANPAINT

Good bearish setup on the higher time frame.Asian paints is one of the leading paint manufacturer in country and for the last few months the stock is trading in a parallel channel there are chance of it trying to retest the previous support zone of around 2700 levels before entering into another bearish leg.
Fundamentally stock shows some negativity as ~45% YoY decline in consolidated net profit in Q4 FY25.
Revenue slipped 4.3% YoY in this quater. Net profit fell 23.3% YoY in Q3 FY 2025.
Technically too the stock look to form bearish Flag and Pole pattern with a possible retracement to around 1700-1800 levels in upcoming months.
RSI is around in between on the monthly charts which is not in confluence.
BBand shows that the stock is trading below the median line of the band and chance of it travelling to the lower band it possible as stock it below the median line for around 11 months.
Exponential moving averages : 100 EMA on the monthly charts is providing good support to the stock while 20 & 50 EMA are acting as the resistance on the same time frame.
Target are different as per the trading setup.
Support and Resistance
Entry only once the channel is breached and retested.
Targe : 1815-1925 zone.
Bollinger Band
Entry has been triggered as per the BB strategy.
Target : 1935
EMA
As per the EMA strategy, there will be multiple entries in the stock.
Entry will be made once the stock closed below the 100 EMA.
Target : 200 EMA.
VALUE INVESTING - ASIAN PAINTS - MEDIUM TO LONG TERM OUTLOOKSymbol - ASIANPAINT
Asian Paints is the largest home decor company in India. The 80+yr old company has major brands like Asian Paints, Berger, Apco, etc under its umbrella. The co. is into wall paints, wall coverings, waterproofing, texture painting, wall stickers, mechanized tools, adhesives, modular kitchens, sanitaryware, lightings, soft furnishings, and uPVC windows.
Asian Paints stock is currently trading at a relatively low valuation, making it an attractive investment pick for value investors. The stock has already fallen 36% from its ATH, which is notable. Large-cap industry leader companies generally do not see corrections of more than 40%, suggesting that the stock could be nearing a solid support zone and presenting a good opportunity for long-term investors.
From a fundamental standpoint, Asian Paints has strong profitability metrics and maintains robust fundamentals, which supports the case for a potential recovery. Despite the recent downturn, the company's strong market position in the paints industry and consistent financial performance provide confidence in its ability to navigate through this correction.
While the stock has faced downward pressure, these factors suggest that it could be an appealing pick for investors looking for value, especially at these lower levels. As the stock is currently undervalued, the downside risk appears limited, and the probability of a reversal or consolidation at these levels increases.
In the short term, any further drops may find support around lower price levels, but given the company's solid fundamentals, a bounce back remains highly likely over the medium to long term. Entry, SL & Target levels are indicated on the chart.
Disclaimer - Do not consider this as a buy/sell recommendation. I'm sharing my analysis & my trading position. You can track it for educational purposes. Thanks!

asian paints #support #resistanceNo support in asian paints till 2200.
Once stock reaches 2200 then only potential buyers might come
next support at 1824.
Till then dont get trapped. Sell on hourly overbought Consult your financial advisor before trading

#SHALPAINTS 124 TGT 150 #ASIANPAINT #BERGEPAINT #INDIGOPNTS #ITCSHALPAINTS 124
TGT 150 / 175
NSE:SHALPAINTS
CPM 124
TGT 150 (20%) // 175
SL 112
RR > 2
TF < 6M
Trading Charts Candlesticks Patterns Technical Indicators
If you like my work KINDLY LIKE SHARE & FOLLOW this page for free Stock Recommendations. With 💚 from Rachit Sethia

Asian Paints - Contractions about to endPost result fall and dividend announcement stock has been trending sideways for approximately a month
As we can see a perfect VCP pattern formation is in the play
Upside small resistance at 2470 & 2500
Downside small supports at 2450 & 2420
Any side break and retest will further decide the path for the stock in coming days

Asian Paints Crucial levelsPlease start accumulating asian paints at green line level and keep the previous low as the stoploss. Important levels are marked in the charts and also you are aware on how to trade the parallel channels.
If you like my analysis then please Boost, Follow and Share so that it keeps me motivated to work more hard and may the chosen ones be profitable.

ASIANPAINTASIANPAINT has given pullback and renounced from 200 DMA. Chances are there that it may change its trend. Long term investor can consider this pullback.

Asian Paints - At strong support areaAsian paints 2970-3000 Strong area of support area
Also a strong flip zone
Stock may do sideways for some time before making a U turn
Any close below 2970 will negate the view
Expect stock to stop at 3150 - 3225 - 3300 on the way up

#ASIANPAINTS #ASIANPAINTSANALYSIS.AsianPaints was in complex correction since 3rd Jan'22 & breakout out of this range will give us a 1000 point upmove which somewhere falls in btw 4500-4600 level. Complex correction is complete & we can see volume spikes & on lower time frame we can see bullish divergence.

NSE ASIANPAINTS - At the Edge of Kinfe Timeframe: Daily
NSE ASIAN PAINTS has been undergoing a corrective phase for about 80 weeks, with its price confined within a range of 3329 – 2938 , excluding excesses. The ADX indicator has declined to 21, while the average true range (ATR) stands at 43. Presently, the price has breached the 20-day exponential moving average (EMA) and is trading below the 50, 100 , and 200 EMAs.
According to the wave principle, the price has formed a corrective formation A-B-C. Wave (B) occurred at 3422.9 , and wave (C) has taken place. Wave (C) has already reached 100 % of wave (A), indicating equality between wave (A) and wave (C). Sub-wave 4 of wave (C) is expected to occur, followed by wave 5 of wave (C). A buying opportunity may arise if the price breaks above the wave A – C line and maintains levels above 2931. Targets for the Long position would be 3026 – 3152 – 3285+.
We Will update further information soon.

AsianpaintBullish Bat harmonics pattern active now in Asianpaint
BAMM - is the concept where B point to D point will be so quick to give target.
This information sharing is only for educational purpose.
Please consult your financial advisor before get into it.

ASIANPAINT BREAKOUT!!! NSE:ASIANPAINT
As seen on the chart price breaking out of recent range. From here Asian paint could move up.
Good delivery volumes.
Supertrend changed to buy after 70 days.

Asian Paint - Rounding Bottom PatternAsian Paint is about to complete the formation of Rounding Bottom.
Rounding Bottom pattern will activate only after the breakout of the Neckline - 3040 level
Rounding bottom chart pattern is a bullish reversal pattern which is formed at prior intermediate support level and hold this level from 2021.
Long trade will initiate only after the neckline breakout.
Stop Loss would be the prior swing low before breakout.
First target would be the depth of the bottom pattern, Calculate depth and add the depth from the neckline level

Asianpaints Entry, Target EXPLAINEDAsian paints has been downtrending and consolidating for a while. A breakout has been observed from the consolidation along with positive divergence in momentum. Therefore we can expect the trend to change.
Current entry is 3000-3005, target 3060, Stoploss 2970
This trade is recommended with a 1:2 RRR
Happy Trading
Yamini Prabu
NSE&NISM Certified TA
Indenpendent Trader/Trainer
I am not SEBI Regd
Only for educational purpose.

BUY ASIANPAINTS AROUND 3000Asianpaints again taken a support from previous demand zone and expected an upmove towards 3280 odd levels until 2900 is intact on the downside closing basis.
Please like the idea If you agree with the analysis, your like will motivate us to share more ideas on Tradingview.
Happy Trading!
InvestPro India

Head and shoulder in Asian paintA very nice and bullilsh pattern has formed in Asian paints at a support level. This is the classic head and shoulder pattern and the price is just breaking out from the neckline. The target is the depth of the pattern but it is possible that we see a lot more rally. In what has been a weak market it is good to see a bullish breakout.

Asianpaint Correction StructureAsian Paint either in abcde or abc correction.
Right now, price is sustaining above support range. If sustains and move Higher High, then MAYBE it will go near 3230.
If the price, go south and inside the range zone then it should have to retest the resistance of range zone and then Lower Low. Target will be near 3080/-

Asian Paints near a break down.Asian Paints has been taking support from the 200 ema on the daily charts and is trading between both the moving averages.
The stock closed below the weekly 20 ema and today test the level and closed almost flat.
If the market remain in a bearish trend, there can be a short trade in the stock as it has test the support levels many times.
Entry :- Below 3150
Targets :- 3090, 3048
The stock today tried to move up but slowly came down and closed near the support levels of 3150.
Asian paints has been trading below both the moving averages on the hourly and 15 minutes charts.
Positional and swing trade can be initiated in the stock as it may take 2-3 days in hitting the targets.
Wait for the price action near the levels before entering the trade.

Asian Paints: Breakout of Descending TriangleAsian Paints breakout from Descending Triangle. Stock to be kept on radar. To go long after breaking 2925 with High Volume

Asian Paints Inverted Head and Shoulder formation
Asian Paints have formed an inverted head and shoulder,
giving good targets...
Levels shown in chart above...
in.tradingview.com
Get upto $30 if you take tradingview subscription using the link above...

Asian Paints LtdAsian Paints Ltd is an Indian multinational paint company.
The company is engaged in the business of manufacturing, selling and distribution of paints, coatings, products related to home décor, bath fittings and providing of related services.

#ASIANPAINTNo Overlap on hourly basis
A difference of subtle 2 points and the stock fell from 3101 to 2958
