BUY TODAY SELL TOMORROW for 5% - BTST STOCK OPTIONDON’T HAVE TIME TO MANAGE YOUR TRADES?
- Take BTST Stock Option trades at 3:25 pm every day
- Try to exit by taking 4-7% profit of each trade
-Resistance Breakout in ASIANPAINT
BUY TODAY, SELL TOMORROW for 5%
Asianpaints

ASIANPAINT BULLISHASIANPAINT BULLISH
Bullish setup , Upmove to 2900 to 3200
first target 2900
Elliott Wave in Action

Asian Paints #Screener — Trend Reversal Before The Crowd Asian Paints Ltd (NSE: ASIANPAINT) has given a strong breakout from a long-term descending trendline with a sharp momentum candle.
This move signals a trend reversal after months of consolidation and price compression — supported by solid weekly volume.
Chart Structure #Screener
📌 Breakout from descending trendline
📌 Volume surge confirming buyer interest
📌 Price holding above 50 EMA on weekly
📌 Formation of higher lows since early 2025
📌 Strong bullish candle closing above key supply zone
Key Levels
Resistance Zone: ₹2880 – ₹3130
Support Zone: ₹2640 – ₹2720
Major Support: ₹2490 (structure base)
As long as price stays above ₹2640, trend bias remains bullish ✅
View
This setup represents a trend shift, not just a breakout — aligning with strength returning in large-cap sectors.
A healthy retest or consolidation above ₹2700 zone could provide follow-through opportunities.
Technical Snapshot
✅ Trendline breakout confirmation
✅ Volume expansion + wide-range candle
✅ Higher-low formation
✅ Momentum shift to buyers
✅ Mid-to-large cap stock showing leadership recovery
📒 Educational analysis only — not investment advice.

ASIANPAINTS RECTANGLE BREAKOUTAsianpaints breaking rectangle pattern weekly basis
huge volume this week,bullish RSI
breaking 20 week ema,above all key ema
strong q2earnings,crude oil cooling off
target 3400 sl 2600
NO BUY/SELL RECOMENDATION

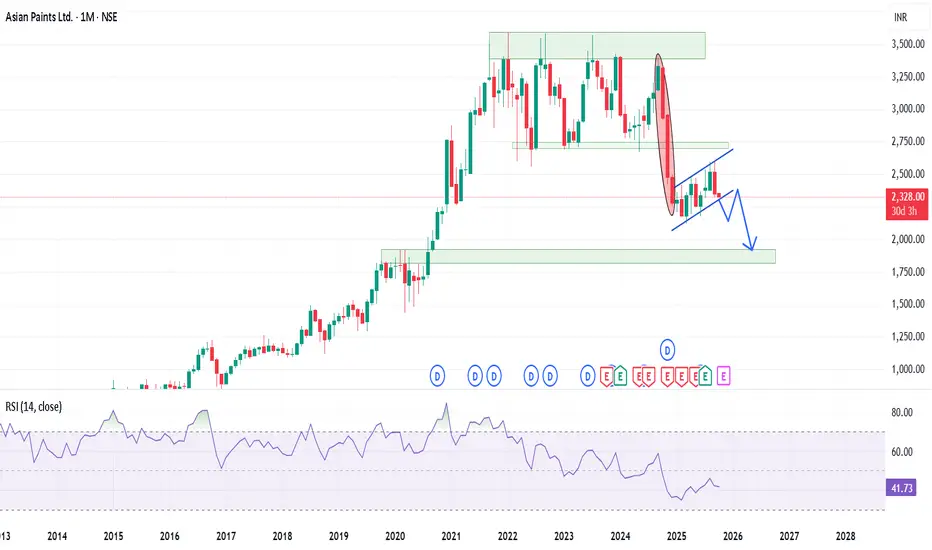
Good bearish setup on the higher time frame.Asian paints is one of the leading paint manufacturer in country and for the last few months the stock is trading in a parallel channel there are chance of it trying to retest the previous support zone of around 2700 levels before entering into another bearish leg.
Fundamentally stock shows some negativity as ~45% YoY decline in consolidated net profit in Q4 FY25.
Revenue slipped 4.3% YoY in this quater. Net profit fell 23.3% YoY in Q3 FY 2025.
Technically too the stock look to form bearish Flag and Pole pattern with a possible retracement to around 1700-1800 levels in upcoming months.
RSI is around in between on the monthly charts which is not in confluence.
BBand shows that the stock is trading below the median line of the band and chance of it travelling to the lower band it possible as stock it below the median line for around 11 months.
Exponential moving averages : 100 EMA on the monthly charts is providing good support to the stock while 20 & 50 EMA are acting as the resistance on the same time frame.
Target are different as per the trading setup.
Support and Resistance
Entry only once the channel is breached and retested.
Targe : 1815-1925 zone.
Bollinger Band
Entry has been triggered as per the BB strategy.
Target : 1935
EMA
As per the EMA strategy, there will be multiple entries in the stock.
Entry will be made once the stock closed below the 100 EMA.
Target : 200 EMA.
ASIANPAINT – Bullish Rest Zone Setup | Watch 2537–2500 🎨 ASIAN PAINTS LTD (NSE: ASIANPAINT)
Sector: Paints & Coatings | CMP: 2,516.00 | View: Bullish Rest Zone Setup
Key Levels
Resistance: 2575 / 2615 / 2640
Support: 2500 / 2478 / 2442
STWP Trade Analysis:
Stock has moved up almost 9% in the last 4 days.
Currently, the stock is resting within a tight consolidation range after a wide bullish bar, forming a Bullish Rest Zone between 2,537.10 and 2,500.70.
Two possible scenarios:
🟢 Scenario 1 – Bulls Take Charge: I would buy @ 2537.10 with a stop at around 2498.40
View: Fresh momentum supported by volume breakout, clear structural strength, and a smooth candle recovery pattern.
🔴 Scenario 2 – Bears Take Charge: I would sell at 2500.70 with a stop at around 2539.4
View: Short-term pullback setup toward 2478–2450 if price loses 2500 zone.
───────────────────────────────────────────────
⚠️ **DISCLOSURE & DISCLAIMER (SEBI-Compliant)**
───────────────────────────────────────────────
📘 **Purpose:**
This content is created **solely for educational and informational purposes** to help readers understand market structure, price action, and technical analysis.
It does **not constitute investment advice**, research recommendation, or a solicitation to buy or sell any security.
👤 **Author Disclosure:**
The author is **not a SEBI-registered investment adviser or research analyst.**
All chart studies, price levels, and observations are based on publicly available data (e.g., **NSE India**, **TradingView**) and are presented purely for **learning illustration**.
📊 **Position Status:**
No active position in * * at the time of publication.
“The author may sometimes trade in the securities discussed, but such trades are independent and shared here only for educational understanding.”
⚠️ **Risk Disclosure:**
Trading and investing involve financial risk. Market movements can be unpredictable, and losses may exceed invested capital.
Readers are strongly advised to consult a **SEBI-registered investment adviser** before making any trading or investment decisions.
🧠 **Responsibility Clause:**
By engaging with this post, you acknowledge that you are **solely responsible for your own trading or investment decisions**, and that this content is intended only for **market education and awareness**.
───────────────────────────────────────────────
💬 **Did You Find This Useful?**
If this analysis helped you understand price structure or market psychology better:
🔼 **Boost** to support transparent & structured financial education.
✍️ **Comment** your insights, observations, or questions — let’s learn together.
🔁 **Share** this post with learners and aspiring traders who value discipline.
📚 **Follow stwp** for more structured, educational breakdowns on stocks & setups.
🚀 *Stay Calm. Stay Clean. Trade With Patience.*
💡 *Trade Smart | Learn Zones | Be Self-Reliant.*
───────────────────────────────────────────────

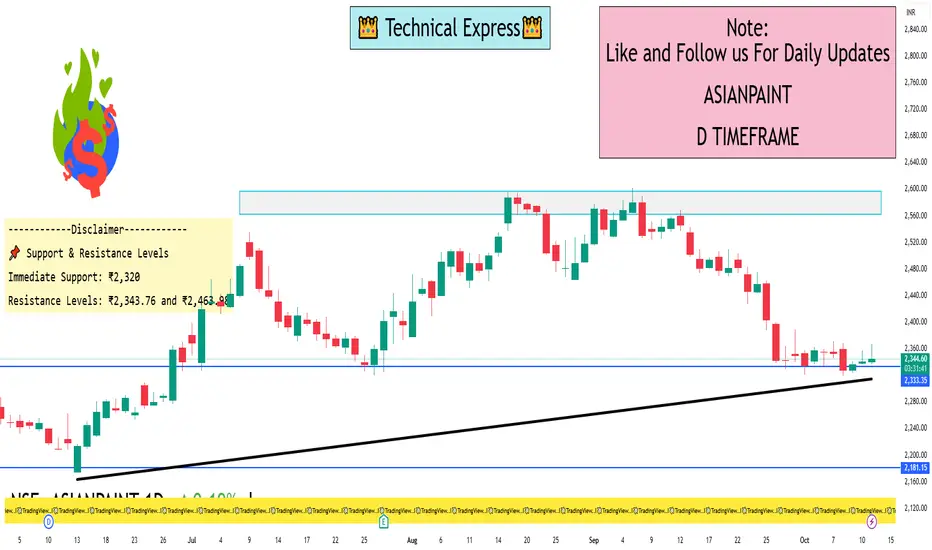
ASIANPAINT 1 Day View📈 Current Price & Trading Range
Current Price: ₹2,357.70
Day’s Range: ₹2,337.00 – ₹2,366.60
Previous Close: ₹2,340.20
52-Week Range: ₹2,124.75 – ₹3,103.55
📊 Technical Indicators
RSI (14-day): 38.17 — indicating a neutral to bearish condition.
MACD: -41.59 — suggesting bearish momentum.
Stochastic RSI: 10.76 — points to an oversold condition, possibly signaling a reversal.
Rate of Change (ROC): -1.93 — reflects downward momentum.
Commodity Channel Index (CCI): -1.93 — supports the bearish outlook.
Average Directional Index (ADX): 32.54 — indicates a strong trend, confirming the downtrend.
Parabolic SAR: ₹2,320 — suggests a bearish trend continuation.
Supertrend: ₹2,444 — aligns with the bearish trend.
📌 Summary
Asian Paints Ltd. is currently in a bearish phase on the 1-day timeframe. Key support at ₹2,320 is crucial; a breach could lead to further declines. Conversely, a rebound above ₹2,463.98 might indicate a potential trend reversal.
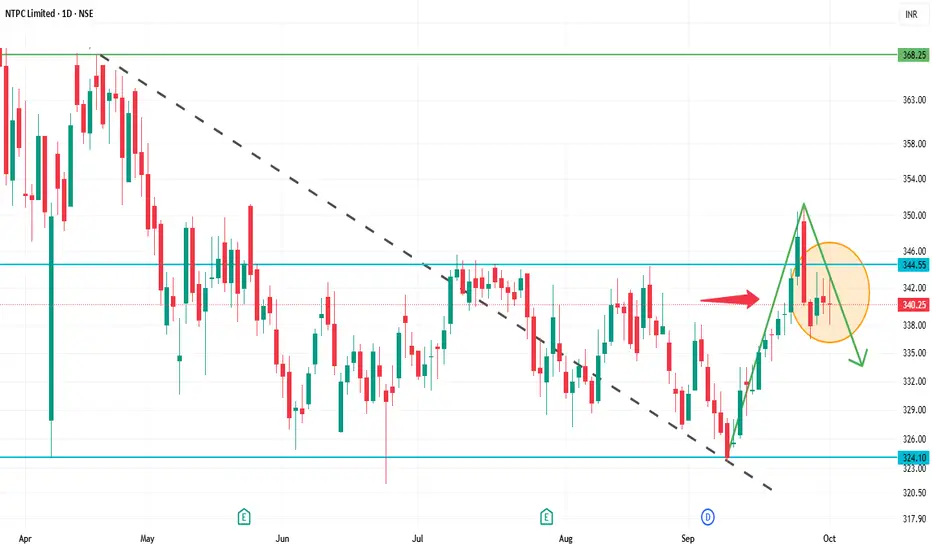
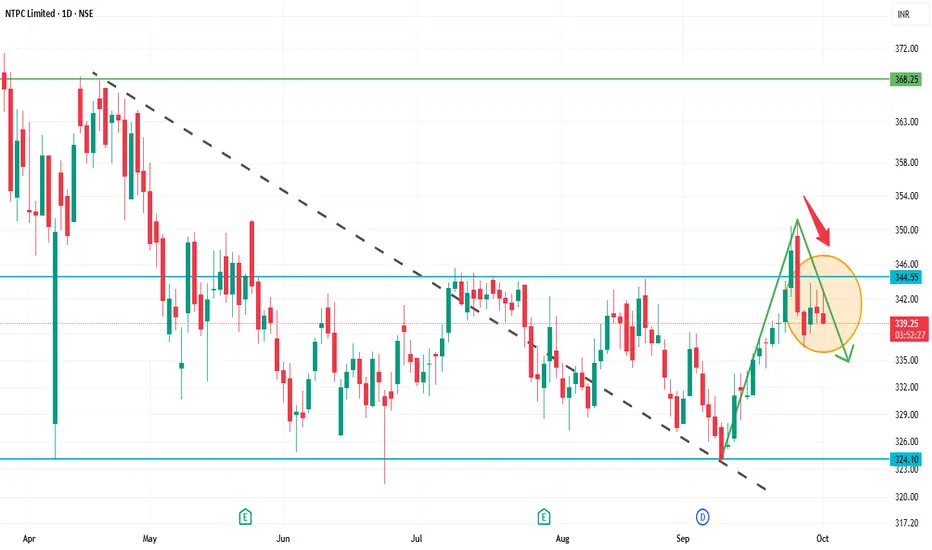
NTPC 1D Time frameCurrent Snapshot
Current Price: ₹340.25
52-Week High: ₹447.75
52-Week Low: ₹292.80
Strategy & Outlook
Bearish Bias: The stock is in a short-term downtrend with negative momentum indicators.
Selling Opportunity: Consider selling near resistance zones (₹343–₹345) with a target towards ₹335–₹340.
Risk Management: Place stop-loss orders above the resistance levels to manage potential upside risks.
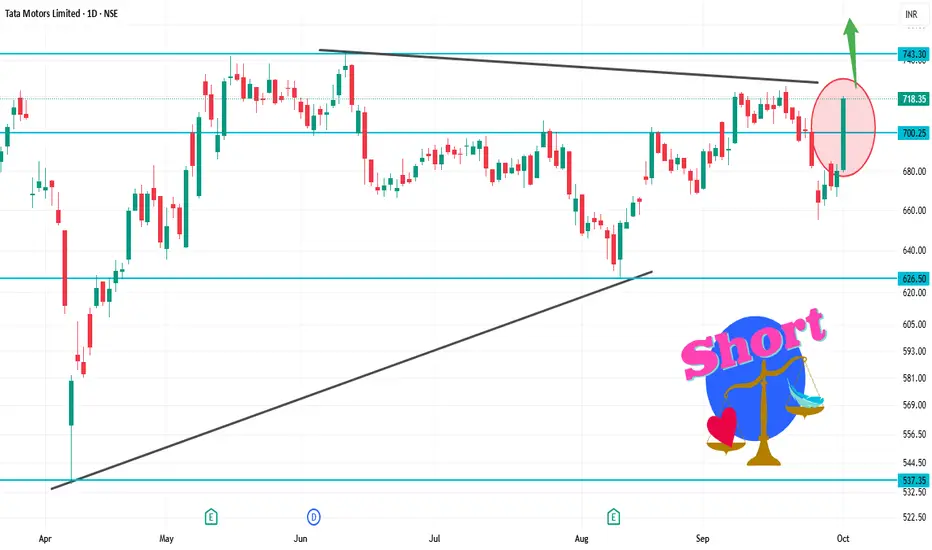
TATAMOTORS 1D Time frameCurrent Price: ₹718
Day Range (today): Around ₹705 – ₹725
52-Week Range: ₹535 – ~₹1,000
📏 Key Levels with ₹718 in focus
Immediate Resistance: ₹750 – ₹800 (needs breakout above this zone)
Current Level: ₹718 → price is right between support and resistance
Immediate Support: ₹700 – ₹705 (if broken, could fall further)
Next Support: ₹650 – ₹660 (major zone to watch)
🧠 What this means
Since price is just above support (₹705) and below resistance (₹750), it’s at a decision point.
If Tata Motors holds above ₹705–₹710, buyers may try to push toward ₹740–₹750.
If it fails and breaks below ₹705, price may revisit ₹660 levels.
BRITANNIA 1D Time frameCurrent Price: ~₹5,953.50
Day’s Range: ₹5,939.50 – ₹6,036.00
52-Week Range: ₹4,506.00 – ₹6,469.90
📏 Key Levels
Immediate Resistance: ~₹6,300
Next Resistance: ~₹6,470 (52-week high)
Immediate Support: ~₹5,800
Next Supports: ~₹5,600 and ₹5,300
🧠 Insights
If Britannia breaks above ₹6,300 with volume, it may push toward ₹6,470+ (new highs).
If it fails to break resistance, expect sideways movement or a pullback toward ₹5,800.
A break below ₹5,800 would signal weakness and can drag it down toward ₹5,600–₹5,300 levels.

NTPC 1D Time frameOpening Price: ₹340.30
Closing Price: ₹340.25
Day Range: ₹339.45 – ₹343.05
📉 Trend Analysis
Short-Term Trend: Bearish — The stock is trading below key moving averages, confirming the bearish trend.
Medium-Term Trend: Neutral — The stock is in a consolidation phase, characterized by lower highs and lower lows.
Long-Term Trend: Neutral — No significant trend identified; the stock is trading within a range.
🔮 Conclusion
NTPC Ltd. is in a bearish trend with weak momentum.
Break below ₹335.00 could lead to further decline toward ₹330.00.
Break above ₹347.00 would indicate a potential trend reversal.
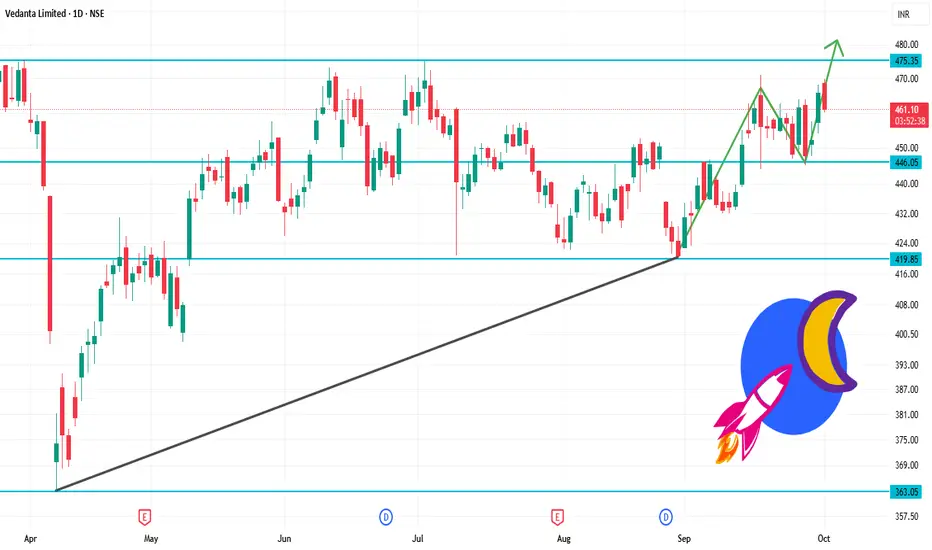
VEDL 1D Time frameOpening Price: ₹468.55
Closing Price: ₹461.40
Day Range: ₹463.00 – ₹469.85
Volume: 2,730,213 shares traded
📉 Trend Analysis
Short-Term Trend: Bearish – The stock is trading below key moving averages, confirming the bearish trend.
Medium-Term Trend: Neutral – The stock is in a consolidation phase, characterized by lower highs and lower lows.
Long-Term Trend: Neutral – No significant trend identified; the stock is trading within a range.
🔮 Conclusion
Vedanta Ltd. is in a bearish trend with weak momentum.
Break below ₹460.00 could lead to further decline toward ₹455.00.
Break above ₹475.00 would indicate a potential trend reversal.
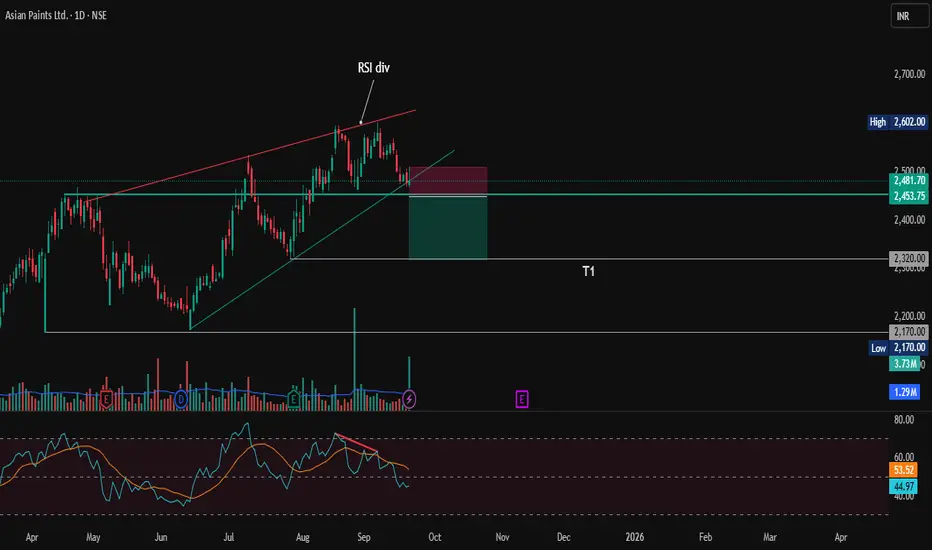
Asian Paints: Short Setup — Bearish Reversal SignalAsian Paints shows signs of a potential short opportunity after forming a bearish reversal pattern (Rising wedge) on the daily chart. The stock failed to sustain above the resistance near 2600, Formed a Double top pattern. The RSI is showing bearish divergence, signaling weakening momentum. hinting at a possible downtrend initiation.
Key Levels to Watch:
Immediate support at 2450 (swing low)
Further downside target around 2320 if support breaks decisively
Trade Plan:
Enter short below 2450 on confirmation of bearish candle close.
Stop loss above 2500 to limit risk from false breakdown.
Target 2320 for conservative exit or trail stop as price moves lower.
Disclaimer: Risk management is crucial in this volatile market, so keep position sizing appropriate. This analysis is intended for educational purposes and not financial advice.
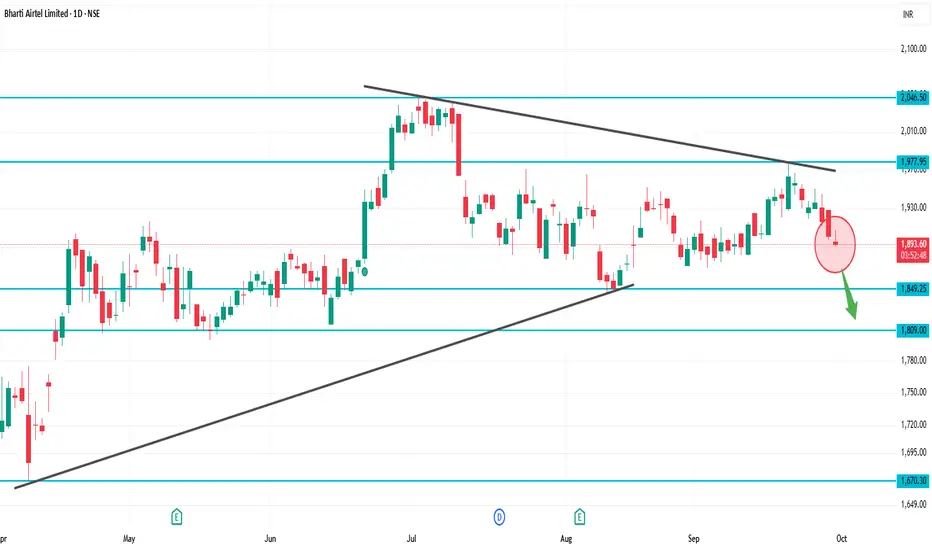
BHARTIARTL 1D Time frameCurrent Price Snapshot
Current Price: ₹1,897.80
Day’s Range: ₹1,890.80 – ₹1,907.60
52-Week Range: ₹1,511.00 – ₹2,045.80
Technical Indicators
RSI (14-day): 44.19 — indicates a neutral to slightly bearish momentum.
MACD: -4.010 — suggests bearish momentum.
Moving Averages:
5-day: ₹1,896.00 — indicates a Sell signal.
50-day: ₹1,890.00 — indicates a Sell signal.
200-day: ₹1,850.00 — indicates a Buy signal.
Technical Summary: Predominantly Sell signals across various indicators.
Summary
Above ₹1,907.60: Potential rise toward ₹1,920 – ₹1,940.
Below ₹1,890.80: Potential fall toward ₹1,880 – ₹1,860.
Between ₹1,860 – ₹1,900: Likely range-bound movement.
KOTAKBANK 1D Time frameCurrent Price Snapshot
Current Price: ₹1,991.60
Day’s Range: ₹1,990.50 – ₹2,015.00
52-Week Range: ₹1,679.05 – ₹2,301.90
Technical Indicators
RSI (14-day): 46.61 — indicates a neutral momentum.
MACD: -7.62 — suggests bearish momentum.
Moving Averages: Mixed signals — short-term averages are bearish, while long-term averages are bullish.
Technical Summary: Predominantly Sell signals across various indicators.
Summary
Above ₹2,015: Potential rise toward ₹2,050 – ₹2,100.
Below ₹1,990: Potential fall toward ₹1,950 – ₹1,900.
Between ₹1,950 – ₹2,010: Likely range-bound movement.

AXISBANK 1D Time frameTrading close to ₹1,130.
This is slightly below the earlier ₹1,160–₹1,170 zone we discussed, so the range shifts down.
🔼 Upside (Rise Possibility)
Immediate resistance near ₹1,140 – ₹1,145.
If price breaks and sustains above this, it can move to ₹1,155 – ₹1,165.
Strong momentum above ₹1,165 may extend toward ₹1,175.
🔽 Downside (Fall Possibility)
First support is at ₹1,120 – ₹1,115.
If that breaks, price could slip toward ₹1,105 – ₹1,095.
Closing below ₹1,095 would weaken the trend further.
✅ Summary for Today
Above ₹1,140 → rise possible till ₹1,155 – ₹1,165.
Below ₹1,120 → fall possible till ₹1,105 – ₹1,095.
Between ₹1,120 – ₹1,140 → sideways range.

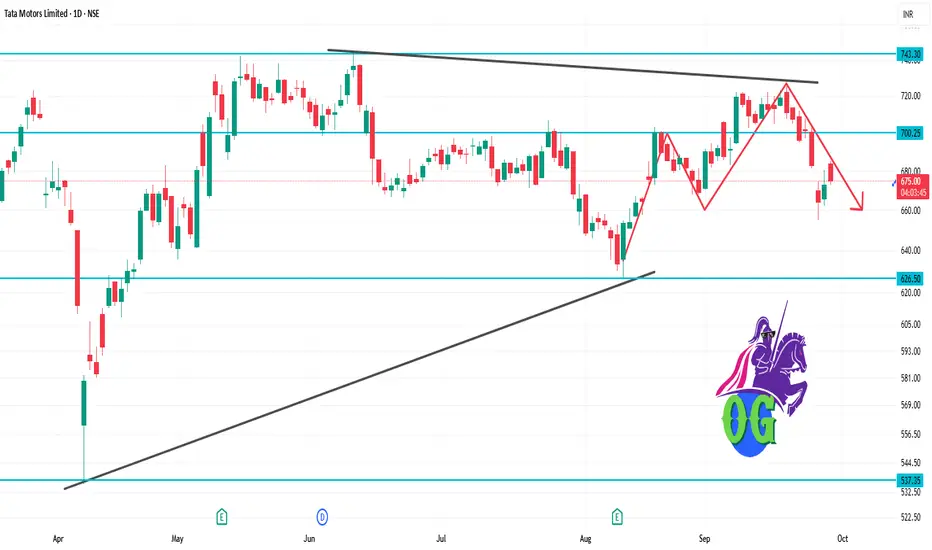
TATAMOTORS 1D Time frameCurrent Market Snapshot
Current Price: ₹675.60
Opening Price: ₹684.00
Day’s Range: ₹673.00 – ₹685.00
Previous Close: ₹672.90
🔑 Technical Indicators
Relative Strength Index (RSI): 48.5 – indicating a neutral condition.
Moving Average Convergence Divergence (MACD): -3.20 – suggesting bearish momentum.
Moving Averages: Trading below the 50-day and 200-day moving averages, indicating a bearish trend.
📈 Key Support & Resistance Levels
Immediate Support: ₹673
Immediate Resistance: ₹685
Pivot Point: ₹679
📉 Market Sentiment
Trend: The stock is trading below its 50-day and 200-day moving averages, indicating a bearish trend.
Volume: Trading volume is higher than average, suggesting increased investor activity.
📈 Strategy (1D Timeframe)
1. Bullish Scenario
Entry: Above ₹685
Stop-Loss: ₹673
Target: ₹690 → ₹695
2. Bearish Scenario
Entry: Below ₹673
Stop-Loss: ₹685
Target: ₹665 → ₹660
⚠️ Risk Management
Limit risk to 1% of capital per trade.
Always use stop-loss to protect against unexpected market movements.
Monitor broader market trends and sector-specific news that may impact stock performance.
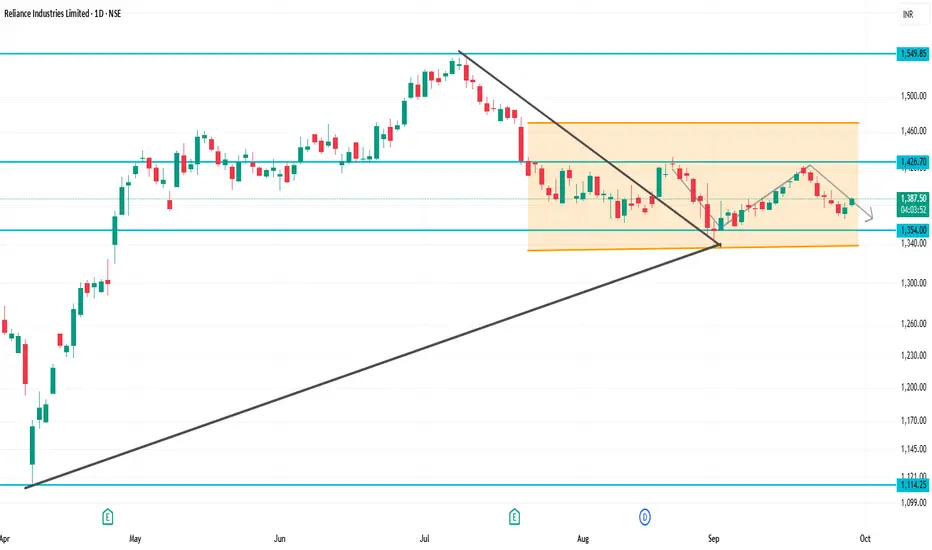
RELIANCE 1D Time frameCurrent Market Snapshot
Current Price: ₹1,383.30
Opening Price: ₹1,381.60
Day’s Range: ₹1,379.00 – ₹1,386.90
Previous Close: ₹1,377.60
🔑 Technical Indicators
Relative Strength Index (RSI): 49.76 – indicating a neutral condition.
Moving Average Convergence Divergence (MACD): -3.20 – suggesting bearish momentum.
Moving Averages: Mixed signals; trading slightly below the 50-day and 200-day moving averages, indicating a neutral to bearish trend.
📈 Key Support & Resistance Levels
Immediate Support: ₹1,379
Immediate Resistance: ₹1,387
Pivot Point: ₹1,383
📉 Market Sentiment
Recent Performance: Reliance Industries experienced a decline of 0.82% on September 25, 2025, underperforming the broader market.
Volume: Trading volume is higher than average, suggesting increased investor activity.
📈 Strategy (1D Timeframe)
1. Bullish Scenario
Entry: Above ₹1,387
Stop-Loss: ₹1,379
Target: ₹1,395 → ₹1,400
2. Bearish Scenario
Entry: Below ₹1,379
Stop-Loss: ₹1,387
Target: ₹1,370 → ₹1,365
⚠️ Risk Management
Limit risk to 1% of capital per trade.
Always use stop-loss to protect against unexpected market movements.
Monitor broader market trends and sector-specific news that may impact stock performance.
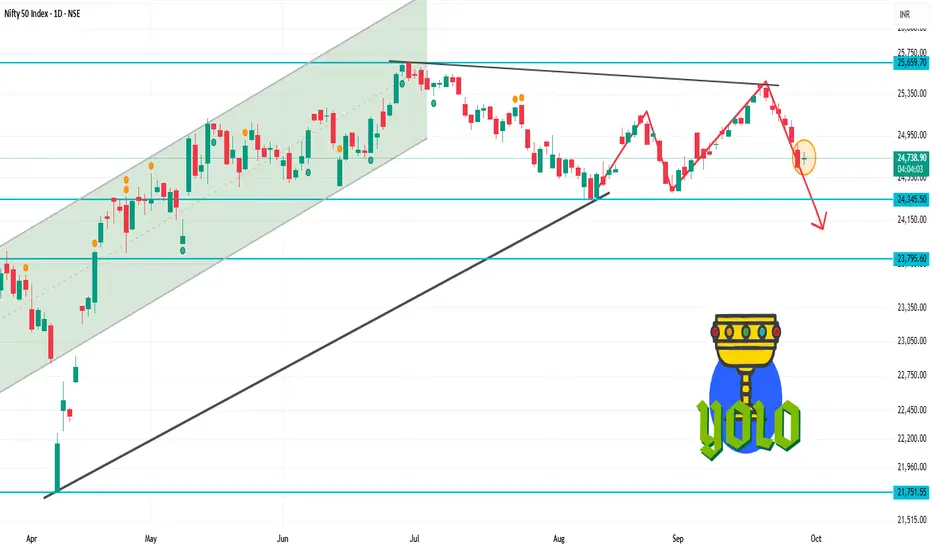
NIFTY 1D Time frameOpening Level: ₹24,691.10
Current Level: ₹24,765
Day's Range: ₹24,500 – ₹24,900 (approximate)
🔑 Key Support & Resistance Levels
Immediate Support: ₹24,500
Immediate Resistance: ₹24,900
Pivot Point: ₹24,765
📊 Market Sentiment
Trend: The NIFTY 50 has experienced a six-day losing streak, indicating bearish momentum.
NDTV Profit
Volume: Trading volume is higher than average, suggesting increased investor activity.
📈 Strategy (1D Timeframe)
1. Bullish Scenario
Entry: Above ₹24,900
Stop-Loss: ₹24,500
Target: ₹25,100 → ₹25,300
2. Bearish Scenario
Entry: Below ₹24,500
Stop-Loss: ₹24,900
Target: ₹24,300 → ₹24,100
⚠️ Risk Management
Limit risk to 1% of capital per trade.
Always use stop-loss to protect against unexpected market movements.
Monitor broader market trends and sector-specific news that may impact index performance.
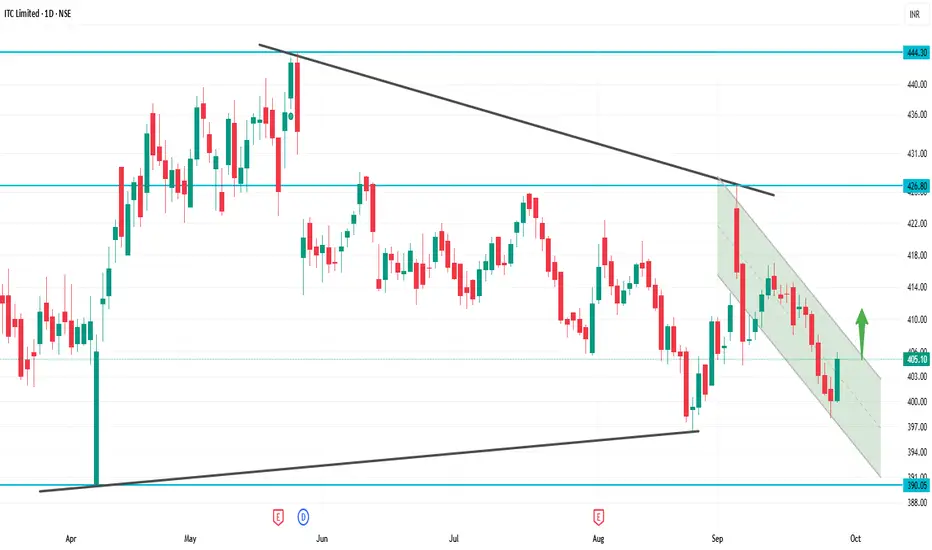
ITC 1D Time frame📊 Updated Snapshot
Current Price: ~₹405
Day Range: ₹402 – ₹410
52-Week High: ₹499
52-Week Low: ₹399
📈 Technical Outlook
Support Zones:
Strong support at ₹405 (current zone)
Next support at ₹398
Resistance Zones:
Immediate resistance at ₹410–₹416
Next resistance at ₹421
Trend Bias: Weak bearish → stock is near 52-week low, testing crucial support.
📌 Step-by-Step View
If it holds above ₹405–₹398: Buyers may step in, possible bounce toward ₹416–₹421.
If it breaks below ₹398: More downside risk opens, weakness can extend further.
Upside revival only above ₹421 closing: That will change trend toward bullish.
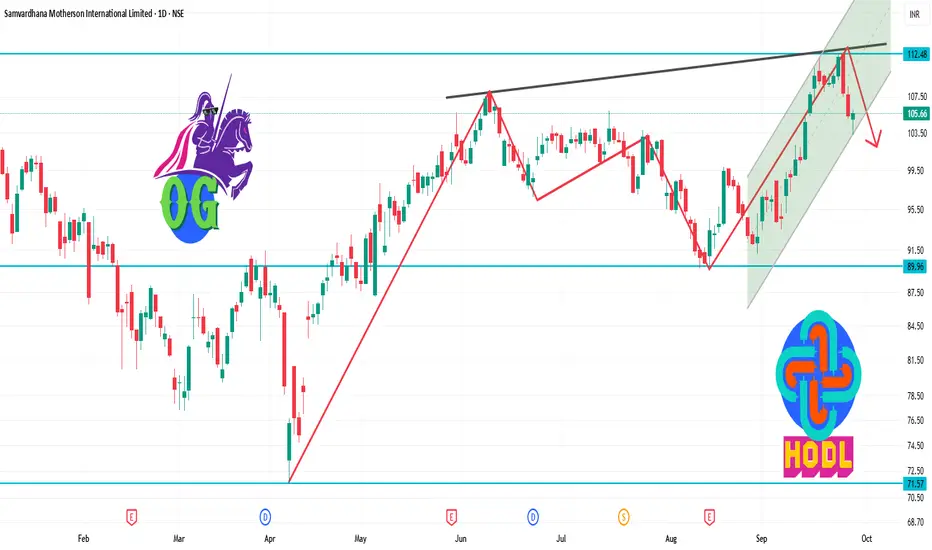
MOTHERSON 1D Time frameStock Snapshot
Closing Price: ₹105.66
Day's Range: ₹103.26 – ₹106.01
52-Week Range: ₹71.50 – ₹144.66
Market Cap: ₹1,11,518 crore
P/E Ratio (TTM): 33.54
P/B Ratio: 3.20
Dividend Yield: 0.80%
Book Value: ₹33.05
Beta: 1.64
Volume: 24,534,407 shares traded
VWAP: ₹104.93
Face Value: ₹1.00
📈 Performance Overview
1-Week Return: -3.14%
1-Month Return: +13.27%
YTD Return: +22.73%
1-Year Return: -11.16%
3-Year Return: +28.45%
5-Year Return: 0.00%
🧾 Financial Highlights
TTM EPS: ₹3.15
Net Sales (Latest Four Quarters): ₹9,271.58 crore
Net Profit (Latest Four Quarters): ₹605.86 crore
Shareholder's Funds: ₹1,676.80 crore
Total Assets: ₹3,089.00 crore
🔍 Technical Insights
Trend: Currently in a downtrend; price below VWAP indicates bearish momentum.
Support Levels: ₹103.26, ₹100.00
Resistance Levels: ₹106.01, ₹110.00
📌 Key Takeaways
Dividend: 50% (₹0.50 per share)
Bonus Issue: 1:2 ratio
Market Position: Strong over 3 years despite short-term volatility
Analyst Sentiment: Positive overall, short-term corrections possible
SENSEX 1D Time frameCurrent Snapshot
Closing / Current Level: ~ ₹ 80,426.46
Day’s Range: High ~ ₹ 81,033, Low ~ ₹ 80,332
Open: ~ ₹ 80,956
⚡ Strategy Thoughts
Bullish approach:
If it recovers above ~80,700 and holds, targets can be 81,000 → 81,300.
Bearish / defensive view:
If Sensex fails near 80,700–81,000, or breaks below ~80,300, downside toward 79,800 and lower comes into play.
Range play:
Between 80,300 and 80,700, you can trade both sides — buy near the bottom of the range, short near resistance — but use tight stops.

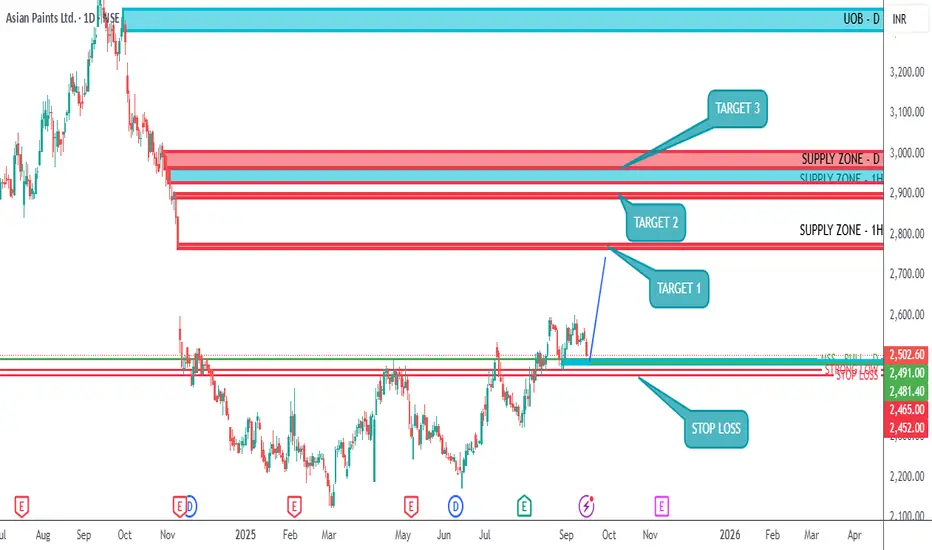
ASIANPAINT - BULLISH TRENDASIANPAINT is looking bullish with an uptrend towards 3000 mark in upcoming 4-5 months. ASIANPAINT has broken the Strong Lower High for a Market Shift of the Structure to bullish and moving towards 3000 mark very soon.
ASIANPAINT has many unmitigated order blocks and unmitigated supply zones at higher levels to be touched and processed.
Bought ASIANPAINT IN CASH at 2500 with a Stop Loss of 2440 for the first target of 2770 by next month and 2900 - 3000 in another 4 - 5 months.
📉 THIS CHANNEL IS ONLY FOR EDUCATIONAL PURPOSES.
Disclaimer: I am Not a SEBI registered analyst. I just share my positions to do paper trading and no where its a recommendation! Please do your own analysis before taking any trade.