ASIANPAINT BULLISHASIANPAINT BULLISH
Bullish setup , Upmove to 2900 to 3200
first target 2900
Elliott Wave in Action
Asianpaintsanalysis

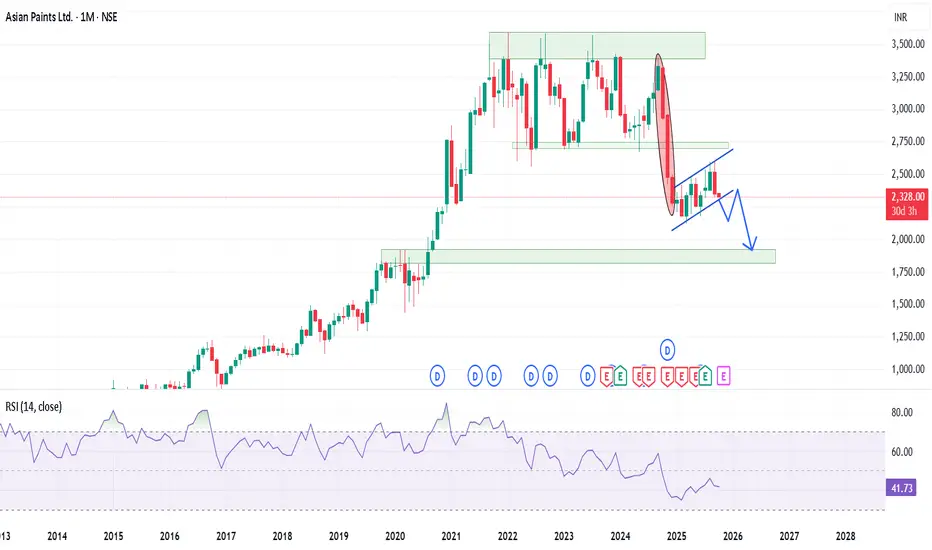
Good bearish setup on the higher time frame.Asian paints is one of the leading paint manufacturer in country and for the last few months the stock is trading in a parallel channel there are chance of it trying to retest the previous support zone of around 2700 levels before entering into another bearish leg.
Fundamentally stock shows some negativity as ~45% YoY decline in consolidated net profit in Q4 FY25.
Revenue slipped 4.3% YoY in this quater. Net profit fell 23.3% YoY in Q3 FY 2025.
Technically too the stock look to form bearish Flag and Pole pattern with a possible retracement to around 1700-1800 levels in upcoming months.
RSI is around in between on the monthly charts which is not in confluence.
BBand shows that the stock is trading below the median line of the band and chance of it travelling to the lower band it possible as stock it below the median line for around 11 months.
Exponential moving averages : 100 EMA on the monthly charts is providing good support to the stock while 20 & 50 EMA are acting as the resistance on the same time frame.
Target are different as per the trading setup.
Support and Resistance
Entry only once the channel is breached and retested.
Targe : 1815-1925 zone.
Bollinger Band
Entry has been triggered as per the BB strategy.
Target : 1935
EMA
As per the EMA strategy, there will be multiple entries in the stock.
Entry will be made once the stock closed below the 100 EMA.
Target : 200 EMA.
ASIANPAINT – Bullish Rest Zone Setup | Watch 2537–2500 🎨 ASIAN PAINTS LTD (NSE: ASIANPAINT)
Sector: Paints & Coatings | CMP: 2,516.00 | View: Bullish Rest Zone Setup
Key Levels
Resistance: 2575 / 2615 / 2640
Support: 2500 / 2478 / 2442
STWP Trade Analysis:
Stock has moved up almost 9% in the last 4 days.
Currently, the stock is resting within a tight consolidation range after a wide bullish bar, forming a Bullish Rest Zone between 2,537.10 and 2,500.70.
Two possible scenarios:
🟢 Scenario 1 – Bulls Take Charge: I would buy @ 2537.10 with a stop at around 2498.40
View: Fresh momentum supported by volume breakout, clear structural strength, and a smooth candle recovery pattern.
🔴 Scenario 2 – Bears Take Charge: I would sell at 2500.70 with a stop at around 2539.4
View: Short-term pullback setup toward 2478–2450 if price loses 2500 zone.
───────────────────────────────────────────────
⚠️ **DISCLOSURE & DISCLAIMER (SEBI-Compliant)**
───────────────────────────────────────────────
📘 **Purpose:**
This content is created **solely for educational and informational purposes** to help readers understand market structure, price action, and technical analysis.
It does **not constitute investment advice**, research recommendation, or a solicitation to buy or sell any security.
👤 **Author Disclosure:**
The author is **not a SEBI-registered investment adviser or research analyst.**
All chart studies, price levels, and observations are based on publicly available data (e.g., **NSE India**, **TradingView**) and are presented purely for **learning illustration**.
📊 **Position Status:**
No active position in * * at the time of publication.
“The author may sometimes trade in the securities discussed, but such trades are independent and shared here only for educational understanding.”
⚠️ **Risk Disclosure:**
Trading and investing involve financial risk. Market movements can be unpredictable, and losses may exceed invested capital.
Readers are strongly advised to consult a **SEBI-registered investment adviser** before making any trading or investment decisions.
🧠 **Responsibility Clause:**
By engaging with this post, you acknowledge that you are **solely responsible for your own trading or investment decisions**, and that this content is intended only for **market education and awareness**.
───────────────────────────────────────────────
💬 **Did You Find This Useful?**
If this analysis helped you understand price structure or market psychology better:
🔼 **Boost** to support transparent & structured financial education.
✍️ **Comment** your insights, observations, or questions — let’s learn together.
🔁 **Share** this post with learners and aspiring traders who value discipline.
📚 **Follow stwp** for more structured, educational breakdowns on stocks & setups.
🚀 *Stay Calm. Stay Clean. Trade With Patience.*
💡 *Trade Smart | Learn Zones | Be Self-Reliant.*
───────────────────────────────────────────────

ASIANPAINT - BULLISH TRENDASIANPAINT is looking bullish with an uptrend towards 3000 mark in upcoming 4-5 months. ASIANPAINT has broken the Strong Lower High for a Market Shift of the Structure to bullish and moving towards 3000 mark very soon.
ASIANPAINT has many unmitigated order blocks and unmitigated supply zones at higher levels to be touched and processed.
Bought ASIANPAINT IN CASH at 2500 with a Stop Loss of 2440 for the first target of 2770 by next month and 2900 - 3000 in another 4 - 5 months.
📉 THIS CHANNEL IS ONLY FOR EDUCATIONAL PURPOSES.
Disclaimer: I am Not a SEBI registered analyst. I just share my positions to do paper trading and no where its a recommendation! Please do your own analysis before taking any trade.
ASIAN PAINTS LTD – Technical Analysis________________________________________
🧠 ASIAN PAINTS LTD – Technical Analysis
Ticker: NSE:ASIANPAINT | Sector: Decorative & Industrial Coatings
CMP: 2,491 ▲ (+1.9%)
Chart Pattern: Symmetrical Triangle Breakout
Technical View: ⭐⭐⭐⭐ (Neutral-to-Positive Setup – Educational Purposes Only)
________________________________________
📈 Technical Overview (For Educational & Informational Purposes Only)
🔹 Pattern Observed:
Price action indicates a breakout from a symmetrical triangle pattern on the daily timeframe – a structure often linked to volatility contraction and potential directional movement. The stock breached the upper trendline near 2,467 with an uptick in volume, indicating possible buyer interest.
🔹 Supporting Indicators:
— MACD: Bullish crossover
— 200 EMA: Price reclaimed above the long-term average
— RSI: Reading near 66, indicating strengthening momentum
— Bollinger Bands: Price broke above upper band + BB squeeze
— SuperTrend: Bullish
— Open = Low: Potential buyer strength
🔹 Volume Context:
Volume during the breakout session was ~2.02M – higher than average, suggesting institutional participation or increased trader interest.
________________________________________
🔼 Resistance Levels (Reference Zones)
R1: 2,518
R2: 2,545
R3: 2,583
🔽 Support Levels (Reference Zones)
S1: 2,452
S2: 2,413
S3: 2,387
________________________________________
📰 News Summary & Sentiment Context (Neutral View)
📌 Earnings:
Q1 FY26 PAT declined ~6% YoY to 1,100 Cr. Revenue slightly lower YoY but largely in-line with expectations. Decorative segment volume grew ~4%, which helped cushion margin pressures.
📌 Demand Trends:
Urban & project-led demand showing signs of recovery. Rural demand is stable. Some macroeconomic caution warranted due to external factors (e.g., job market uncertainties).
📌 Regulatory Update:
The CCI has initiated a probe on alleged market dominance following a complaint. The company has contested the investigation citing procedural inconsistencies.
📌 Market Mood:
Despite regulatory concerns, post-earnings sentiment appears improved. The stock has risen ~5.2% YTD and has been among recent Nifty outperformers.
________________________________________
📚 Educational Insight for Traders & Learners
The symmetrical triangle is a common consolidation pattern formed by converging trendlines. It reflects a balance of power between buyers and sellers. A breakout (especially with volume) can signify renewed directional bias.
In this case, the stock broke out above the resistance trendline, backed by volume and confirmation from technical tools (RSI > 60, MACD, BB squeeze, etc.).
Such breakouts are monitored by traders for swing or positional opportunities, provided risk is managed and external catalysts (like earnings and macro sentiment) are factored in.
✅ Key Reminder: Technical setups should be combined with proper position sizing, exit plans, and broader market context.
________________________________________
🔍 Trade Setup (For Educational Simulation Only)
Trade Details
🔹 Long Entry: ₹2,505.60
🔹 Stop Loss (SL): ₹2,406.55
🔹 Risk-Reward Ratio: 1:1 | 1:2+
Pullback Trade Setup (Optional Re-Entry)
📍 Pullback Entry Zone: ₹2,491.20 – ₹2,505.60
📍 Protective Stop Zone: ₹2,465.87 – ₹2,453.60
📍 Risk-Reward Range: 1:1 | 1:2+
________________________________________
⚠️ Disclaimer (Please Read Carefully):
This content is shared strictly for educational and research purposes only.
I am not a SEBI-registered investment advisor, and no buy or sell recommendations are being made.
All views expressed are based on personal market analysis and experience. They are not intended as financial advice.
Trading — especially in derivatives like options — involves significant financial risk. Losses can exceed your initial investment.
👉 Always do your own research and consult a certified SEBI-registered advisor before making any investment or trading decisions.
👉 Use proper risk management and only trade with capital you can afford to lose.
The author assumes no responsibility or liability for any trading losses incurred from acting on this content.
By engaging with this material, you agree to these terms.
________________________________________
💬 Found this helpful?
Drop your thoughts, questions, or insights in the comments below ⬇️ — let’s learn together!
🔁 Share this post with your trading friends and community — help them discover clean charts, structured setups, and zone-based learning.
✅ Follow simpletradewithpatience for clear setups, educational content, and a no-nonsense approach to price action, supply-demand zones, and risk-managed trades.
🚀 Trade with patience. Trust your charts. Stay clear-headed.
Because the goal is not just to trade — it's to trade better.
Be Self-Reliant | Trade with Patience | Learn with Charts & Zones 📊

ASIAN PAINTS LTD – Gap Fill Setup Near Resistance | Price Action________________________________________________________________________________📈 ASIAN PAINTS LTD – Gap Fill Setup Near Resistance | Price Action Analysis
🕒 Chart Type: Daily (1D)
________________________________________________________________________________
🔍 What’s Catching Our Eye:
Price is testing a major resistance with a gap still left to be filled above.
________________________________________________________________________________
📌 What We’re Watching For:
A breakout above 2491 or a reversal from the resistance zone.
________________________________________________________________________________
📊 Volume Footprint:
Breakout occurred on slightly lower volume – caution advised.
________________________________________________________________________________
🔁 Trend Bias:
Short-term bullish with breakout momentum in play.
________________________________________________________________________________
🧠 Trade Logic / Reasoning:
Strong bullish candle with BB breakout and VWAP support suggest strength.
________________________________________________________________________________
📍 Important Levels to Mark:
Key zones are 2491 (Top) and 2124.75 (Bottom) for breakout or bounce setups.
________________________________________________________________________________
🎯 Trade Plan (Educational Purpose Only):
Best Buy:
Above 2491 on retest with volume; or near 2451–2419 with bullish reversal.
________________________________________________________________________________
Best Sell:
Below 2451 with rejection confirmation; or near 2520 if breakout fails.
________________________________________________________________________________
Demand Zone / Supply Zone: NA
________________________________________________________________________________
⚠️ Invalidation Below:
Breakdown below 2435 would invalidate current bullish bias.
________________________________________________________________________________
⚠️ Disclaimer:
This analysis is for educational purposes only.
STWP is not a SEBI-registered advisor.
No buy/sell recommendations are made.
Please consult your financial advisor before trading.
STWP is not responsible for trading decisions based on this post.
________________________________________________________________________________
💬 Found this helpful?
Will Asian Paints Breakout or Fakeout
Share your thoughts in the comments ⬇️
🔁 Spread the insight with fellow traders
✅ Follow STWP for smart technical setups backed by volume and price action
🚀 Let’s trade with patience, logic, and clarity!
Be Self-Reliant | Trade with Patience | Learn with Logic
________________________________________________________________________________

ASIANPAINT – Strong Bounce from Demand Zone________________________________________________________________________________📈 ASIANPAINT – Strong Bounce from Demand Zone | Option Chain + Price Action Breakdown
🕒 Chart Type: 15-Minute
📆 Date: July 3, 2025
________________________________________________________________________________
🔍 What’s Catching Our Eye:
ASIANPAINT saw a sharp intraday rebound from its marked demand zone at ₹2405–₹2397.50, with price closing near ₹2,430.90. The reversal occurred on higher volume and in the presence of long build-ups across multiple Call strikes. This suggests institutional interest and a potential shift in short-term sentiment.
________________________________________________________________________________
📌 What We’re Watching For:
The key observation is that ASIANPAINT respected its demand zone and bounced with strength. If the price sustains above ₹2,440, it could trigger continuation toward the top range of ₹2,464.40. On the downside, any failure to hold the demand zone may bring back pressure toward ₹2,400. Option chain data supports the bullish bias, with fresh long positions across ATM and OTM calls.
________________________________________________________________________________
📊 Volume Footprint:
Today’s volume was 1.55M, higher than the previous 1.36M, signaling strong participation during the bounce. A continuation move with volume > 1.5M may validate breakout setups.
________________________________________________________________________________
📈 Option Chain Highlights:
The 2,500 CE, 2,460 CE, and 2,440 CE all witnessed strong long build-ups, confirming bullish positioning. Even the deep OTM 2,600 CE showed healthy open interest increase. Meanwhile, 2,400 PE showed short build-up, suggesting put writers are confident that the ₹2,400 level will hold. Notably, 2,400 CE also saw short covering, adding further weight to the bullish narrative.
________________________________________________________________________________
🔁 Trend Bias:
🟢 Bullish above ₹2,440, especially if volume confirms a clean move
________________________________________
🧠 Trade Logic / Reasoning:
The bounce from demand was technical and backed by derivatives activity. The presence of long build-ups across multiple Calls and the short covering at 2400 CE suggests strength. Since price closed above key EMA zones and respected the lower boundary, it builds a solid case for an upward move, unless volume suddenly drops or a fresh supply emerges.
________________________________________________________________________________
📍 Important Levels to Mark:
🔺 Top Range Resistance: ₹2,464.40 – Watch for bullish breakout or reversal candlestick
🔻 Bottom Range Support: ₹2,326.10 – Deeper support; unlikely to come into play unless 2400 breaks
________________________________________________________________________________
🎯 Trade Plan (Educational Purpose Only):
✅ Best Buy (Cash/Futures):
Buy above ₹2,440 with bullish price action and volume confirmation. Reversal from the demand zone is valid as long as price holds above ₹2,405.
✅ Best Sell (Cash/Futures):
Sell only below ₹2,405 if the price breaks the demand zone with high volume and bearish structure. Downside may open toward ₹2,380–₹2,360.
💼 Best CE to Long:
2,440 CE or 2,460 CE – Both strikes show strong Long Build-Up; ideal for directional continuation above ₹2,440.
📉 Best PE to Long:
2,400 PE – Consider only if price breaks and sustains below ₹2,405 with heavy volume and weak candle close. Risk-reward turns favourable for downside hedging.
🟢 Demand Zone: ₹2405.10 – ₹2397.50 | SL: ₹2395.50
🔴 Supply Zone: Not clearly visible yet (watch ₹2464+ for fresh seller emergence)
⚠️ Invalidation Below:
Bullish bias invalid if price closes below ₹2,395 with strong volume and momentum.
________________________________________________________________________________
⚠️ Disclaimer:
This post is for educational purposes only.
STWP is not a SEBI-registered advisor.
This is not a buy/sell recommendation.
Please consult your financial advisor before trading.
STWP is not responsible for any trading outcomes.
________________________________________________________________________________
💬 Found this helpful?
Drop your thoughts in the comments ⬇️
🔁 Share this with fellow traders
✅ Follow STWP for zone-based price action & option chain insights
🚀 Let’s grow awareness for structured & patient trading!
________________________________________________________________________________
Asian paint buying range: ₹2,117 to ₹2,250. target ?Asian Paints CMP is ₹2,358. Suggested buying range: ₹2,117 to ₹2,250. Positional target: ₹3,600, offering a potential upside of over 45% from the buying range.

ASIAN PAINTS GREAT BUYING OPPORTUNITY 20% UPSIDE POTENTIAL!Hello traders, in this analysis I'm going to discuss about Asian paints, ASIAN PAINTS have corrected from almost 3400 lvl to 2200 lvl now after the correction stock is moving in Sideways stock is good above mentioned 2500 resistance zone if stock consolidate in that range for few days and than give break out than it's really a good zone to accumulate these stock. After clearing the mentioned resistance zone there is no any strong resistance in between, stock is ready to head towards 3000 lvl. Stock might face some sideways or small correction near gap down high and after filling gap it may face some rejection. But major resistance zone is not in Between so from my point of view ASIANET PAINT is ready to blast soon if it's sustain above resistance zone. You have to give some ample amount of time for our level to come.
This is my personal view your view might differ from mine, do your own research before taking any trades.

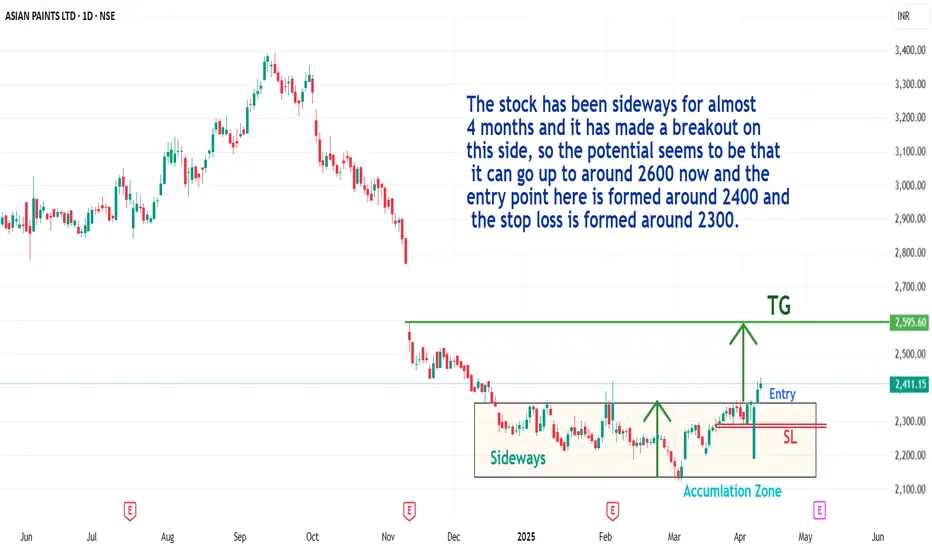
Asian paint stock 4 months sideways zone breakoutThe stock has been sideways for almost 4 months and it has made a breakout on this side, so the potential seems to be that it can go up to around 2600 now and the entry point here is formed around 2400 and the stop loss is formed around 2300.
Asian Paints cmp 2257.60 by Weekly Chart viewKeep the stock on radar basis Support Zone been tested retested for probable upside breakout movement attempts
Asian Paints cmp 2257.60 by Weekly Chart view
- Support Zone at 2115 to 2210 Price Band
- Gap Down Opening of 11-Nov-2025 will get a closure only on next upside
- Weekly Support at 2115 > 1930 > 1685 with Resistance seen at 2430 > 2665 > 2855
- Stock has been trading within 2560 to ATH 3590 price band for 4+ years, unable to break this range
- The stock has broken down from the price range but is attempting to reverse from the Support Zone
- Volumes were more on Selling side indicative of consistent weakness for the stock but taking some stable ground around Support Zone by Weekly Chart

VALUE INVESTING - ASIAN PAINTS - MEDIUM TO LONG TERM OUTLOOKSymbol - ASIANPAINT
Asian Paints is the largest home decor company in India. The 80+yr old company has major brands like Asian Paints, Berger, Apco, etc under its umbrella. The co. is into wall paints, wall coverings, waterproofing, texture painting, wall stickers, mechanized tools, adhesives, modular kitchens, sanitaryware, lightings, soft furnishings, and uPVC windows.
Asian Paints stock is currently trading at a relatively low valuation, making it an attractive investment pick for value investors. The stock has already fallen 36% from its ATH, which is notable. Large-cap industry leader companies generally do not see corrections of more than 40%, suggesting that the stock could be nearing a solid support zone and presenting a good opportunity for long-term investors.
From a fundamental standpoint, Asian Paints has strong profitability metrics and maintains robust fundamentals, which supports the case for a potential recovery. Despite the recent downturn, the company's strong market position in the paints industry and consistent financial performance provide confidence in its ability to navigate through this correction.
While the stock has faced downward pressure, these factors suggest that it could be an appealing pick for investors looking for value, especially at these lower levels. As the stock is currently undervalued, the downside risk appears limited, and the probability of a reversal or consolidation at these levels increases.
In the short term, any further drops may find support around lower price levels, but given the company's solid fundamentals, a bounce back remains highly likely over the medium to long term. Entry, SL & Target levels are indicated on the chart.
Disclaimer - Do not consider this as a buy/sell recommendation. I'm sharing my analysis & my trading position. You can track it for educational purposes. Thanks!

asian paints #support #resistanceNo support in asian paints till 2200.
Once stock reaches 2200 then only potential buyers might come
next support at 1824.
Till then dont get trapped. Sell on hourly overbought Consult your financial advisor before trading

ASIANPAINTS buy/sell?ASIANPAINTS monthly chart shows price is nearing channel lower side.
We need to see whether it takes support or breaks down longterm channel.
NOTE: Asianpaints seen-ve sales growth in Q2FY25. Its made some CAPEX, yet to see its result.
Paint Industry growth is down currently. Need to see how it grows Q3, Q4FY25.
Personally want to buy if i see any reversal near channel support. Lets see.
Check Indigo Paints in this Industry which i feel also a good player.

Asian Paints - Contractions about to endPost result fall and dividend announcement stock has been trending sideways for approximately a month
As we can see a perfect VCP pattern formation is in the play
Upside small resistance at 2470 & 2500
Downside small supports at 2450 & 2420
Any side break and retest will further decide the path for the stock in coming days

Asian Paints Crucial levelsPlease start accumulating asian paints at green line level and keep the previous low as the stoploss. Important levels are marked in the charts and also you are aware on how to trade the parallel channels.
If you like my analysis then please Boost, Follow and Share so that it keeps me motivated to work more hard and may the chosen ones be profitable.

Asian Paints - At strong support areaAsian paints 2970-3000 Strong area of support area
Also a strong flip zone
Stock may do sideways for some time before making a U turn
Any close below 2970 will negate the view
Expect stock to stop at 3150 - 3225 - 3300 on the way up

ASIAN PAINTS - POSITIONAL SWING TRADE IDEA IN CASHSYMBOL - ASIANPAINT
Asian Paints is the largest home decor company in India. The 80+ year old company has major brands like Asian Paints, Berger, Apco etc. under its umbrella. The co. is into wall paints, wall coverings, waterproofing, texture painting, wall stickers, mechanized tools, adhesives, modular kitchens, sanitaryware, lightings, soft furnishings, and uPVC windows.
Asian Paints is currently trading between two major supply and demand zones since a long time. CMP of Asian paints is 2700 & It is approaching demand zone on weekly basis.
I'm seeing a positional trade opportunity on buy side. I usually trade in futures but this time I'm taking this trade in cash as general elections are due in June which is a major event for market makers.
Current PE of Asian paints is 46 which makes it a value buy at CMP. I'm investing 50% allocation today at CMP 2700. I'll invest 50% more at 2580-2600 levels & will hold this position with 2500 as SL. Targets I'm expecting on long side will be 2950 - 3220 - 3410 & new ATH. I'm ready to hold this trade for 3 - 6 months.
Disclaimer - Do not consider this as a buy/sell recommendation. I'm sharing my analysis & my trading position. You can track it for educational purposes. Thanks!

ASIAN PAINT NSE By KRS ChartsDate: 11th July 2024
Time: 9:00 PM
Why ASIAN PAINT?
1. Stock is Extremely Bullish when it comes to overall view from the beginning. But from Sep 2021 , its range-bound between 2650 to 3550 Rs.
2. Here Range Bound movement creating Tringle Chart Pattern . Furthermore, that chart pattern's wave count ABCDE is finished with 2670 Rs low.
3. Also, Bullish Divergence in Monthly TF is clearly visible so when it comes to breakout, its likely to break upside resistance rather than downside support.
So, We can Long ASIAN PAINT with SL of 2670 Rs . for Medium to Long Term.

#ASIANPAINTS #ASIANPAINTSANALYSIS.AsianPaints was in complex correction since 3rd Jan'22 & breakout out of this range will give us a 1000 point upmove which somewhere falls in btw 4500-4600 level. Complex correction is complete & we can see volume spikes & on lower time frame we can see bullish divergence.

ASIAN PAINTS - 30% PROFIT OPPORTUNITY COMING SOON! - LONGASIAN PAINTS
Trading between the price zones 2663 and 3550 since May 2021. This gave a good opportunity for a swing trade with a 33% profit stretch
Strong rejections at 3550 during Sep 2021, Jan 2022, Aug 2022, Sep 2022, Jul 2023,
Taken good support near 2660s during Mar 2022, Jun 2022, Jan -Apr 2023, May 2024
From Dec 2023 the price is not able to touch the 3550 range - but returned down from the 3400 range. This shows the stock is weak from Dec 2023 till today.
It forms a down-side triangle pattern. Unless it breaks out the triangle pattern it won't touch the resistance zone 3550
Considering the current global market situation, there are chances it may come down to the support zone and create a buying opportunity
Buy Zone: 2663-2820
Target 1: 3036 (13% - 15%); Target 2:3550 (30-33%)
Trade and Invest Wisely with your knowledge! Good Luck!
You can also see my other stock analysis and the results in my profile ideas. Please follow me, If you would like to see more ideas on winning stocks.
**Disclaimer:
I am NOT a SEBI registered consultant/Advisor (nor any country-authorized board registered consultant/Advisor). It is completely my view and opinion.
My intention is not to provide any financial advice, training advice, or recommendations on stock/Forex/Coin buying or selling.
Please do your research and consult with your financial advisor before taking any action.
I am not responsible for any of your actions on buying, selling, or holding the above-mentioned stock or/and index or/and Forex or/and coins.


Asian Paints Ltd - Breakout OpportunityDate : 5-Jun-2024
Rating : Buy - Positional Trade
LTP : Rs. 2,961.75
Targets: (1) Rs. 3,180 --> (2) Rs. 3,308 --> (3) Rs. 3,423 --> (4) Rs. 3,590
SL : Rs. 2,777 on daily close basis
Technical View:
• Since Apr-2021, NSE:ASIANPAINT is moving sideways between 2,560 and 3,590. It was recently going through it's secondary downtrend.
• After touching the high of 3,422.95 on 29-Dec-2023, it has retraced 22% to 2,670.10 level.
• On 5-Jun-2024, NSE:ASIANPAINT has broke out from its secondary down trend with higher than average volume.
• NSE:ASIANPAINT has also closed above 20 DMA, 50 DMA and 21 DEMA on 5-Jun-2024. Very close to cross the 200 DMA.
• RSI has formed bullish cross over and trading at 61.23. MACD is in buy zone and trading at 11.65.
• Both MACD and RSI has formed positive divergence indicating trend reversal and bullish momentum.
• Looking strong to start a new swing from here.
Disclaimer : I am not a SEBI registered analyst/consultant and not recommending anyone to take any BUY or SELL position in stock market. Investing in stock market is risky and one should do a self analysis and validation before investing in stock market. Ideas are published for learning purpose only.
