Stock Analysis: Asm technologies ASM Technologies Ltd.- technical chart and fundamentals for student learnings.
Technical & Chart Pattern Analysis (Weekly Chart)
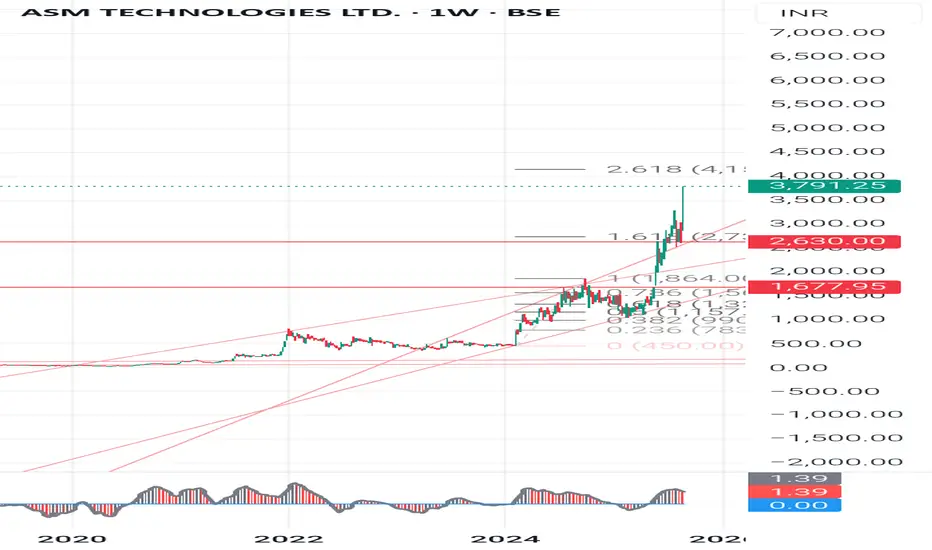
Current Price (CMP): 1,520
Recent Move: Sharp rally from -500 in mid-2024 to a peak of -3,800 (multi-bagger move within months).
Chart Pattern Observations
1. Parabolic Rally: Price rose almost vertically - unsustainable in the short term - healthy correction likely.
2. Strong Resistance Zones:
-1,675 (immediate resistance & supply zone)
-2,630 (major resistance, recent support turned resistance)
-3,800 (swing top, all-time high)
3. Strong Support Zones:
-1,450-1,500 (immediate support, CMP zone)
- 1,250 (next support)
- 950 (major strong support, base of previous rally)
4. Candlestick Observations:
The last few weekly candles show long wicks at the top - profit booking and selling pressure.
Current trend shows bearish engulfing signals near top - short-term correction expected.
🎯Perfect Entry Points for Swing / Positional
Safe Accumulation Zone: 1,250-1,450 (near support, risk-reward favorable).
Aggressive Buy Zone: 1,650-1,700 (if stock reclaims and sustains above with volume).
Breakout Zone for Big Upside: 2,650+ weekly close - can attempt 3,200-3,800 again.
Swing Analysis:
Stock is in post-parabolic correction - Expect sideways consolidation between 1,250-2,000 for some weeks/months.
Good for gradual SIP-style accumulation instead of lump sum buy.
Fundamental Snapshot (ASM vs Competition)
Metric (FY24-25) ASM Technologies Tata Elxsi KPIT Tech L&T Tech
Market Cap -800 Cr -55,000 Cr -30,000 Cr -55,000 Cr
PE Ratio -60+ (very high) -75 -65 -55
Debt/Equity Low (Good) Low Low Low
Revenue Growth (3Y CAGR) High (-30-35%) -18% -20% -15%
Profit Margins 8-10% 20%+ 15-18% 15-20%
Dividend Yield Nil 0.8% 0.5% 0.7%
👉 Observation:
ASM is a small-cap, high-growth, high-risk IT engineering services company.
Valuation is stretched (like peers) but earnings base is tiny compared to Tata Elxsi or KPIT.
High volatility due to low liquidity in stock.
Key Learnings for Students
1. Parabolic moves always correct - don’t chase at top, wait for pullbacks.
2. Support & Resistance levels guide entry/exit - better risk-reward at support zones.
3. Volume + Candlestick confirmation is important before entering.
4. Fundamentals matter in long run - Always check PE ratio, debt levels, margins, and growth.
5. Small-cap IT can give multibaggers but carry high volatility - only invest money you can hold for 3-5 years.
👉Disclaimer:
This analysis is for educational purposes only. Not a SEBI-registered advisory. Please consult your financial advisor before making any investment/trading decision.
#ASMTechnologies #StockAnalysis #SwingTrading #ChartPatterns #SupportResistance #CandleStickAnalysis #TechnicalAnalysis #FundamentalAnalysis #InvestingForBeginners #StockMarketEducation #MultibaggerStocks #LongTermInvesting
ASMTEC
ASM TECH | TARGET OF 25%+About ASM Tech:
1. ASM Tech is a global technology company with expertise in semiconductor manufacturing and packaging solutions.
2. The company specializes in advanced packaging, assembly, and test services for semiconductor devices.
3. ASM Tech plays a significant role in the semiconductor industry, providing critical components and services to semiconductor manufacturers.
4. They are known for their innovation and contributions to semiconductor manufacturing processes.
5. ASM Tech's technologies are crucial in the development of smaller, faster, and more efficient electronic devices.

ASMTEC Breakout or Break Down ???BSE:ASMTEC
Cmp : 705
Consolidation
Stock will give a breakout or breakdown... Take an entry after confirmation.
#Study

