ASTRAL - STWP Equity Snapshot📊 STWP Equity Snapshot – Astral Ltd (ASTRAL)
(Educational | Chart-Based Interpretation)
ASTRAL continues to trade within a broader range-bound structure, with price oscillating between well-defined supply and demand zones rather than establishing a sustained trend. After facing rejection near the 1593–1600 supply zone, price moved into a corrective phase and recently reacted from the 1333–1293 demand region, where buyers have previously stepped in. The current price is stabilising near the 1424 balance area, which now acts as an important near-term reference. Holding above this zone keeps the structure intact and allows price to retest higher reaction zones near 1441–1470, where selling pressure has emerged earlier. On the downside, sustained weakness below 1367, and more importantly below the 1333 demand zone, would increase downside risk and reinforce the broader range structure. Until price decisively exits either boundary, movement should be viewed as rotation within the range rather than trend development.
Indicator readings reflect a mixed but stabilising environment. The recent strong bullish candle with open near the low signals short-term buyer response from demand rather than trend confirmation. Bollinger Band behaviour highlights prior volatility contraction, with early signs of expansion emerging, though follow-through remains limited. The BB squeeze context suggests the market is transitioning from compression toward potential movement, but direction is still undecided. RSI near 47 indicates balanced momentum, neither weak nor strong, aligning with the ongoing range structure. Price interaction with short-term averages shows attempts at stabilisation, while a wide CPR structure reinforces the expectation of two-sided trade and consolidation rather than immediate directional continuation.
Volume behaviour provides constructive but cautious confirmation. Participation has expanded during the recent rebound, indicating active involvement from buyers near demand rather than a low-volume reaction. At the same time, volume intensity remains within a healthy range (Vol X ~1.4–1.5), with no signs of climax or exhaustion. Selling phases have not shown aggressive volume expansion, suggesting supply pressure is controlled. Overall, volume dynamics support range stability and recovery attempts but stop short of confirming accumulation or breakout intent.
From a short swing perspective, ASTRAL remains structurally neutral as long as price trades between the 1333–1293 demand zone and the 1593–1600 supply zone. Acceptance above intermediate resistance levels would be required to improve directional confidence toward higher range-expansion zones. Conversely, sustained acceptance below 1293 would elevate downside risk and shift focus toward deeper structural demand. Until either boundary is resolved, consolidation and rotation within the range should be expected.
Final Outlook (Condition-Based):
Momentum is improving but not decisive, the trend remains range-bound, risk stays elevated due to proximity to both demand and supply, and volume is supportive but not confirming a directional shift.
💡 STWP Learning Note
Range markets reward patience and structure awareness more than prediction.
⚠️ Disclaimer
This post is shared strictly for educational and informational purposes. It is not investment advice or a recommendation. Please consult a SEBI-registered financial advisor before making any financial decision.
🚀 Stay Calm. Stay Clean. Trade With Patience.
ASTRAL

Astral on the Verge: Technical Breakout & Investment Zones MappeAstral Limited : CMP: 1557.30: After studying its monthly chart structure and weekly Elliott Wave formations. Recent price action suggests a potential breakout setup, offering opportunities for both aggressive traders and patient investors.
Entry for Aggressive Traders:
• Aggressive traders can look for a breakout above the recent swing high near 1,579, as marked on both the monthly and weekly charts. This level has already shown strong momentum, with a notable price jump of +7.39% in the recent candle.
• Targets: 1630, 1725, 1795, 1935, 2200. Use trailing stop-loss: 1500, 1625, 1710, 1790, 1900 as you move up. Manage risk and adjust stop-loss as per levels.
Conservative Entry for Investors
• Investor Entry: Investors may enter on reasonable dips towards 1,440–1,460 support zone, as this range aligns with previous resistance turned support and is less volatile. Alternatively, entry after confirmation of the breakout above 1,579 with sustained volume is also suitable.
• Targets: Investors: Enter between 1,440–1,460. Targets: 1,935 and 2,200 for the medium term.
These represent major Fibonacci retracement zones and historical resistance levels, suggesting strong probability of acting as future price objectives. Investors can use a wider stop near 1,230 based on weekly chart support.
📌 Thanks a ton for checking out my idea! Hope it sparked some value for you.
🙏 Follow for more insights
👍 Boost if you found it helpful
✍️ Drop a comment with your thoughts below!

Astral - Good to see breakout soon.Astral is forming a ascending triangle pattern and looks good to buy at this level.
Short term it can reach to 1580-1590.
If cross and sustain above 1600, We can see 2000-2200.
Good to buy and hold for the next 6-12 months.

Astral Ltd – Strong Base, High ExpectationsNSE:ASTRAL
🔹 Fundamental Overview
Business Profile: Astral is a leading player in India’s building materials sector, engaged in manufacturing pipes, fittings, adhesives, and bathware products with a strong brand presence and pan-India distribution.
Financial Strength: The company maintains an exceptionally strong balance sheet with very low debt (Debt/Equity ~0.04), reflecting conservative financial management.
Profitability: Delivers ROE around 14 % and ROA near 10 %, demonstrating healthy operational efficiency.
Valuation: The stock trades at a premium valuation with a P/E near 80× and P/B above 10×, indicating high investor confidence and growth expectations.
Growth Trend: Revenue and profit growth have been modest recently, with single-digit YoY expansion amid a slower construction cycle.
Strengths: Industry leadership, strong brand recall, product diversification (plumbing to adhesives), and debt-free operations.
Risks: Elevated valuation levels, cyclical exposure to real estate and construction demand, and potential margin pressure from input cost fluctuations.
🔹 Technical Overview
Trend Direction: Long-term structure remains bullish, with the stock trading above its 50-day and 200-day moving averages.
Momentum: RSI around 55, showing neutral momentum — neither overbought nor oversold.
Trend Strength: ADX near 18 suggests a weak trend phase; stock may be consolidating before the next directional move.
Support Levels: ₹1,420 – ₹1,430 range offers strong support for accumulation.
Resistance Levels: ₹1,475 – ₹1,490 is a crucial breakout zone; a close above this range can trigger a fresh rally.
🔹 Investor Takeaway
Outlook: Astral combines a debt-free balance sheet, premium brand positioning, and steady market dominance—making it a high-quality compounder in the construction materials space.
Investment Horizon: Ideal for long-term investors (2–5 years) seeking exposure to India’s infrastructure and housing growth themes.
Risk Profile: Moderate to high—strong company, but entry should be disciplined due to high valuation.
⚠️ Disclaimer:
This analysis is for educational and informational purposes only.
We are not SEBI-registered analysts or advisors.
This is our personal view based on available data and market trends.
Please consult your SEBI-registered investment advisor before making any investment or trading decisions.
You are solely responsible for any financial decisions you make based on this content.
========================
Trade Secrets By Pratik
========================

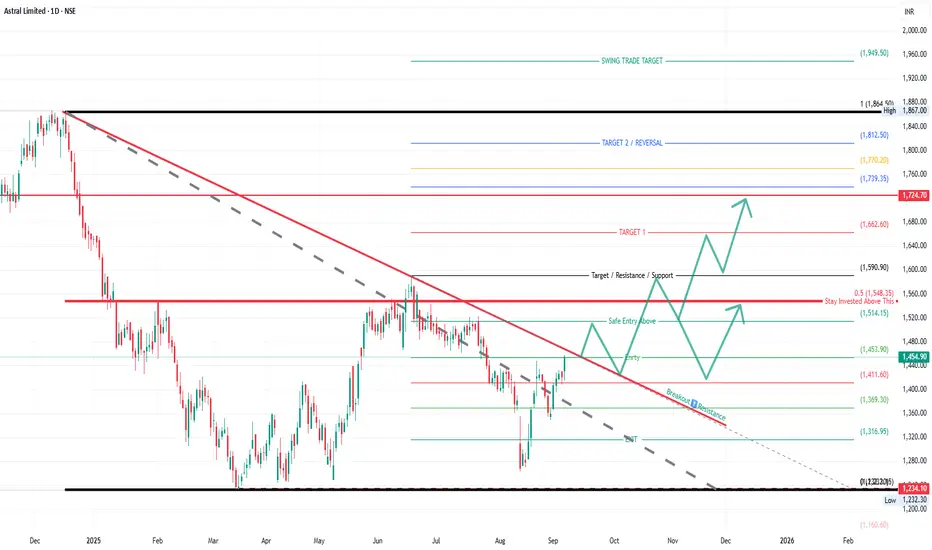
Astral Ltd – Trendline Breakout & Upside TargetsAstral Ltd has broken out of a long-term falling trendline, indicating a potential shift from bearish to bullish momentum. Price is trading above the safe entry level of ₹1,453 and holding strong. Sustaining above ₹1,514 may confirm further upside targets.
📌 Key Technical Highlights:
Pattern: Downtrend Breakout
Safe Entry: Above ₹1,453
Stay Invested Above: ₹1,514
Resistance turned Support: ₹1,590
Volume strength will be key for confirmation
🎯 Upside Target Levels:
Target 1: ₹1,662
Target 2: ₹1,724
Target 3 (Reversal Zone): ₹1,770 – ₹1,812
Swing Target: ₹1,949
⚠️ Downside Risk Levels (if breakout fails):
₹1,411
₹1,369
₹1,316
₹1,234
📈 Strategy Outlook:
A positional buying opportunity emerges above the breakout zone. Traders may consider entering above ₹1,453 with a stop-loss below ₹1,411. Holding above ₹1,514 adds confidence for higher upside targets.
Disclaimer:
This analysis is for educational purposes only and not financial advice. Do your own research before trading or investing.
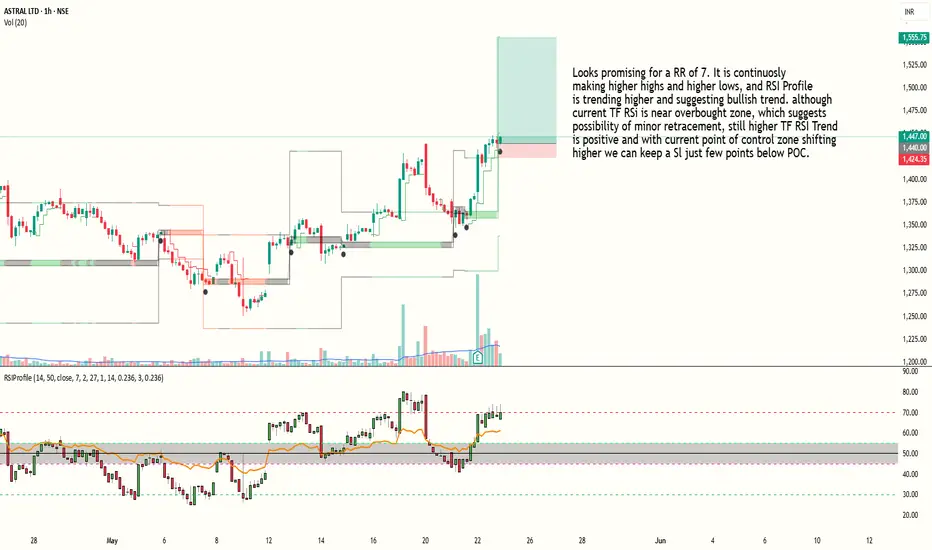
Bullish trade building up in Astral with RR of 7Looks promising for a RR of 7. It is continuosly making higher highs and higher lows, and RSI Profile is trending higher and suggesting bullish trend. although current TF RSI is near overbought zone, which suggests possibility of minor retracement, still higher TF RSI Trend
is positive and with current point of control zone shifting higher we can keep a Sl just few points below POC.
Entry at 1440
SL around 1423
Target around 1555
Risk to reward ratio is around 7.
Indicator used : RSI Hybrid Profile (Link available in my profile)
PS : This is an Educational post and doesn't constitute any trading or financial advice, just do your own research.
Astral - Looks good to buy at bottomAstral Poly Technik Ltd was established in 1996, with the aim to manufacture pro-India plumbing and drainage systems in the country. It has also forayed into adhesive business over years.
Market Cap: ₹ 36,884 Cr.
Promoter holding: 54.1 %
FII holding: 20.2 %
DII holding:14.6 %
Public holding: 11.0 %
Fundamentals are good. Near breakout level and good to hold for the next 6 months.

Astral a great BuyAstral is a great buy between 1100 to 1150.
Please wait for ASTRAL to touch the given level.

ASTRAL - SWING TRADE ON LONG SIDESymbol - ASTRAL
ASTRAL is currently trading at 1555
I'm seeing a trading opportunity on buy side.
Buying ASTRAL Futures at 1555
I will add more long position at 1535, if comes.
Holding with SL of 1515
Targets I'm expecting are 1630 - 1685 & above.
Disclaimer - Do not consider this as a buy/sell recommendation. I'm sharing my analysis & my trading position. You can track it for educational purposes. Thanks!

Astral - Keep An EyeThe stock price has dropped around 40% in the last six months. Now coming at the multiple support levels as shown on the chart. If it gives a reversal from the support levels, it may go into a bullish phase again.
It may reverse from 1550 or 1470 levels. One should wait for the reversal signs according to their setups.
Possible targets may be 1685/1770/1930+
The setup fails if the price sustains below 1440. Better to keep the position size following risk management or exercise hedging.
This is only for learning and sharing purposes, not a buy or sell recommendation. Please do your research before taking any trade.
All the best.

ASTRAL Trading within Demand Zone of ₹1720 to ₹1701.9ASTRAL's current price is ₹1713.55, positioning it in the demand zone between ₹1720 and ₹1701.9. This zone, formed on May 25, 2023, may act as a support level, suggesting potential buying interest. Investors may want to observe the price action around this range to assess opportunities for a potential rebound or consolidation.

ASTRAL BEARISH sell side "ASTRAL LTD (NSE) is showing signs of a potential bearish breakdown. The stock has been in a clear downtrend, forming lower highs and lower lows. A possible bearish flag/pennant pattern is forming, which could lead to further downside if confirmed.

ASTRAL - Reversal possible Price analysis & overview: -
1. Breaking the channel.
2. Liquidity grabbing opportunity on the below levels.
3. 1800 around zone is strong support zone and probably it should bounce.
4. RRR looks favourable.
- Stay tuned for further insights and updates, and trade safely!
- If you liked the analysis, don't forget to leave a comment and boost the post. Happy trading!
Disclaimer: This is NOT a buy/sell recommendation. This post is meant for learning purposes only. Views are personal. I share whatever I do. Please, do your due diligence before investing.
Thanks & Regards,
Anubrata Ray

Astral rising: How the Stock Price Defies Gravity in the Market(1) The price broke through resistance and surged after a prolonged consolidation
(2) It is now maintaining upward momentum with higher highs and higher lows.
(3) Following a breakout, the price is near its record high and expected to keep rising.

Astral AnalysisAstral break out of a 8+ months long consolidation zone on 23 Feb '24 with good volume. After that it formed a VCP and breakout on 10 May '24 with above average volume. Bullish view on the stock. It will be ideal to enter @2125-2155 levels with stoploss below 2000.

ASTRAL ready to run away!After months of corrections, corporate action and consolidation Astral is finally ready for new highs!

ASTRAL (Pole & FLAG)Astral gave a bounce from a weekly support and moving upside for a POLE & FLAG breakout.
NOTE: I'm not a SEBI REG. Study before investing.

ASTRAL 1 Year - Consolidation Break-out NSE:ASTRAL This Break the 1 Year Consolidation Zone Wait For Weekly Closing How Weekly Candle Closing

astral keepn under radar.cmp 2158.6
near 3 year resistance line
closed above 2 month shortterm resistance.
if closes above 2200 next week with good volumes may run towards 2300-2350
just a educational post not a trading idea.

ASTRAL ready to run away!After months of corrections, corporate action and consolidation Astral is finally ready for new highs!

ASTRAL F&P BREAKOUT WCBASTRAL breaking f&p pattern
#weekly chart basis
with huge voume
trading at ATH
#target1 2200 #target2 2500
EDUCATIONAL IDEA

ASTRAL - Ichimoku Breakout📈 Stock Name - Astral Poly Technik Limited
🌐 Ichimoku Cloud Setup:
1️⃣ Today's close is above the Conversion Line.
2️⃣ Future Kumo is Turning Bullish.
3️⃣ Chikou span is slanting upwards.
All these parameters are shouting BULLISH at the Current Market Price and even more bullishness anticipated AFTER crossing 2080.
🚨 Disclaimer: This is not a Buy or Sell recommendation. It's for educational purposes and a guiding light to learn trading in the market.
#CloudTrading
#IchimokuCloud
#IchimokuFollowers
#Ichimokuexpert
Excited about this analysis? Share your thoughts in the comments below!
👍 Like, Share, and Subscribe for daily market insights! 🚀
#StockAnalysis #MarketWatch #TradingEducation #ichimoku

Astral ready to rock n rollInside candle bar trade + Triangle breakout + Weekly Bullish candle
Small trade:
Entry: 1968.80
Target: 2073.40
SL: 1948.50
(Time: 1-2 Week)
Big target: 1968.80
Target: 2290
SL: 1808.50
(1 month)
View for educational purposes
