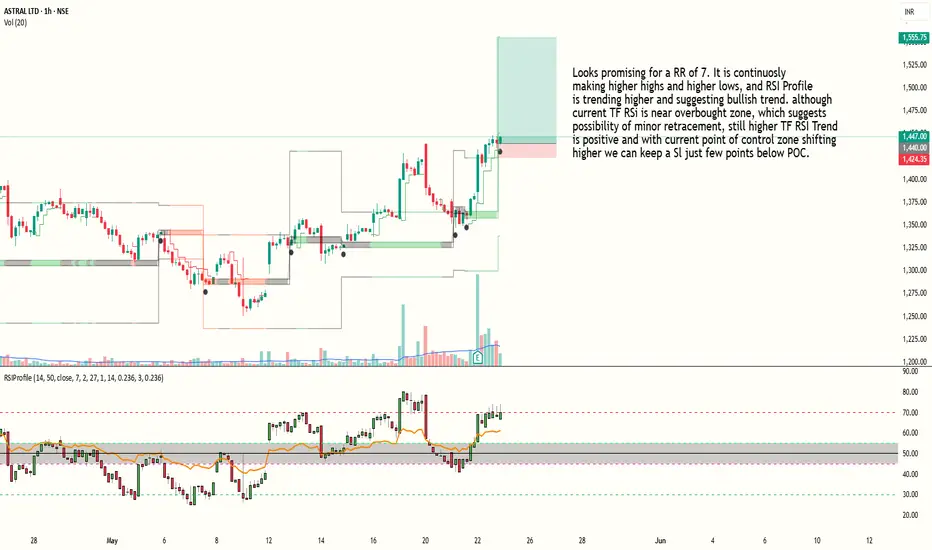
Bullish trade building up in Astral with RR of 7Looks promising for a RR of 7. It is continuosly making higher highs and higher lows, and RSI Profile is trending higher and suggesting bullish trend. although current TF RSI is near overbought zone, which suggests possibility of minor retracement, still higher TF RSI Trend
is positive and with current point of control zone shifting higher we can keep a Sl just few points below POC.
Entry at 1440
SL around 1423
Target around 1555
Risk to reward ratio is around 7.
Indicator used : RSI Hybrid Profile (Link available in my profile)
PS : This is an Educational post and doesn't constitute any trading or financial advice, just do your own research.
Astralanalysis
ASTRAL - SWING TRADE ON LONG SIDESymbol - ASTRAL
ASTRAL is currently trading at 1555
I'm seeing a trading opportunity on buy side.
Buying ASTRAL Futures at 1555
I will add more long position at 1535, if comes.
Holding with SL of 1515
Targets I'm expecting are 1630 - 1685 & above.
Disclaimer - Do not consider this as a buy/sell recommendation. I'm sharing my analysis & my trading position. You can track it for educational purposes. Thanks!

Astral AnalysisAstral break out of a 8+ months long consolidation zone on 23 Feb '24 with good volume. After that it formed a VCP and breakout on 10 May '24 with above average volume. Bullish view on the stock. It will be ideal to enter @2125-2155 levels with stoploss below 2000.

Astral-23.11.2023Trigger line above 58.80 may reach 68.12, cash price may reach 25-40
Trigger line below 52.52 may reach 40.83, cash price may reach 28-40

Astral- 21.11.2023If trigger line crosses above -54.47, may reach 63.72, Cash price - 20-45
If trigger line crosses below -47.54, may reach 38.42, Cash price - 18-28

Astral - Intraday - 07.11.2023If trigger line crosses above 54.39, will reach to 64.03, in Cash Price may go up to 25-32 Rs,
If trigger line crosses below 46.28, will reach to 34.50, price may go down 18-25

Astral -Intraday - 06.11.2023If trigger line crosses over 55.62, it may reach to 66.17, 30 to 40 Rs in cash.
If trigger line crosses below 47.96, it may reach to 37.56, 25 to 35 Rs in cash.

Wait & Watch - Possible BreakoutHi All…
Greetings!
Today I’m sharing with you Astral Ltd. Daily Chart. I think it is break out just need to wait & watch for a day or two.
In the coming time I think it should give good returns.
Thanking You
Important Things
1. This is only for educational purposes only.
2. Never over trade.
3. Always keep Stop Loss.
4. Trade in limited quantity.
5. Taking a small loss is better than wiping up your whole capital.
I hope you found this idea helpful.
Please like and comment.
Share with Your Friends.
Keep Learning,
Happy & Safe Trading
Disclaimer – These ideas shared by me to all are my personal analysis / views. Im not a SEBI registered technical analysis.

Astral - BullishStock almost bottomed out
Climax volume seen
Currently in range
Last 15 mins seen exclusive buying
Possible to give a explosive move tomorrow
R:R is great
Partial entry near 1925 Next entry if sustains 1940
1st Tgt 2050
Sl below 1880

Astral Chart Analysis !!📈 Astral 📉
My Findings :-
1. Breakout from Resistance Zone in and this zone is important because it was also acting as a support earlier.
2. Higher High and Higher Low Formation.
3. Close Above Feb, March 2022 High.
Bias- Long
Target- 2220, 2391 and 2489
SL- 1975
RR- 1: 2.5
All Important Supports and Resistances are drawn in chart. All levels are on closing basis.
Please have a look and revert back if you need some more study on it.
Disclaimer : Consult Your Financial Advisor Before Taking Any Decision On This Analysis.

Astral Ltd - 25.02.2022Astral Ltd - 25.02.2022
The stock is trading @ 1910 levels
There is a HAMMER in Daily & Weekly Charts
The prices are below EMA
Resistance @ 1930 levels
Let the prices go above 1999
watch out for the price actions
