AUBANK - Bullish Engulfing + EMA50 Breakout = Power Rally Setup________________________________________
📈 AU Small Finance Bank | Bullish Engulfing + EMA50 Breakout 🚀
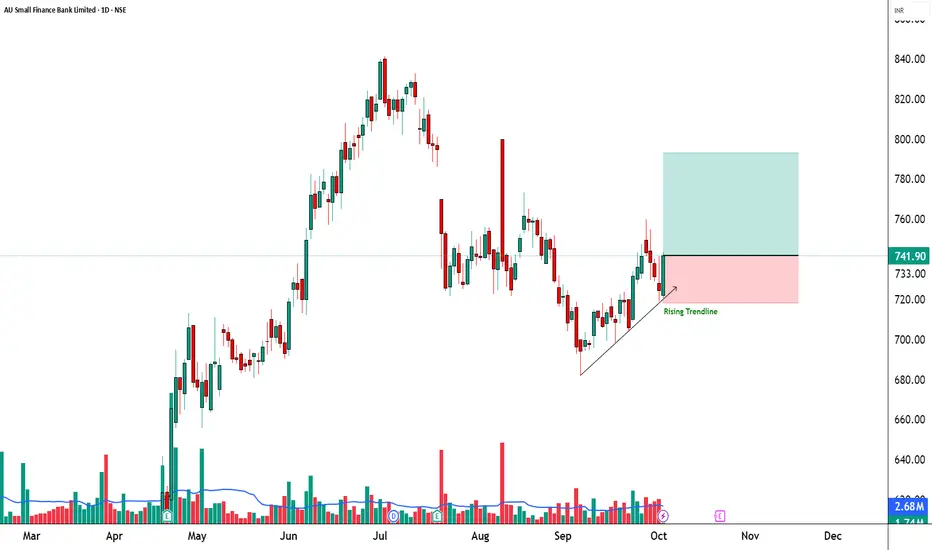
🔹 Entry Zone: ₹741.90 – ₹743.70
🔹 Stop Loss: ₹718.20 (Risk ~23 pts)
🔹 Supports: 727.17 / 712.43 / 704.17
🔹 Resistances: 750.17 / 758.43 / 773.17
________________________________________
🔑 Key Highlights
✅ Strong Bullish Candle – Engulfing pattern confirming reversal power
✅ EMA50 Breakout – trend shift signal
✅ Bullish VWAP Alignment – institutional buying confirmation
✅ Bollinger Squeeze-Off → breakout & volatility expansion expected
________________________________________
🎯 STWP Trade View
📊 Momentum indicates short-term bullish rally. A close above ₹750 may trigger an extended upside towards ₹758–773.
⚠️ Supports at ₹727 & ₹712 are important for trade protection.
________________________________________
💡 Learning Note
This setup demonstrates how a Bullish Engulfing pattern combined with EMA breakout + VWAP alignment can act as a multi-signal confirmation for a trend reversal.
________________________________________
⚠️ Disclosure & Disclaimer – Please Read Carefully
The information shared here is meant purely for learning and awareness. It is not a buy or sell recommendation and should not be taken as investment advice. I am not a SEBI-registered investment adviser, and all views expressed are based on personal study, chart patterns, and publicly available market data.
Trading—whether in stocks or options—carries risk. Markets can move unexpectedly, and losses can sometimes exceed the money you have invested. Past performance or past setups do not guarantee future results.
If you are a beginner, treat this as a guide to understand how the market works and practice on paper trades before risking real money. If you are experienced, always assess your own risk, position sizing, and strategy suitability before entering trades.
Consult a SEBI-registered financial adviser before making any real trading decision. By engaging with this content, you acknowledge full responsibility for your trades and investments.
💬 Found this useful?
🔼 Give this post a Boost to help more traders discover clean, structured learning.
✍️ Drop your thoughts, questions, or setups in the comments — let’s grow together!
🔁 Share with fellow traders and beginners to spread awareness.
👉 “If you liked this breakdown, follow for more clean, structured setups with discipline at the core.”
🚀 Stay Calm. Stay Clean. Trade With Patience.
Trade Smart | Learn Zones | Be Self-Reliant 📊
AUBANK
AUBANK – 52-Week Breakout with Strong Volume💹 A.U. Small Finance Bank Ltd (NSE: AUBANK)
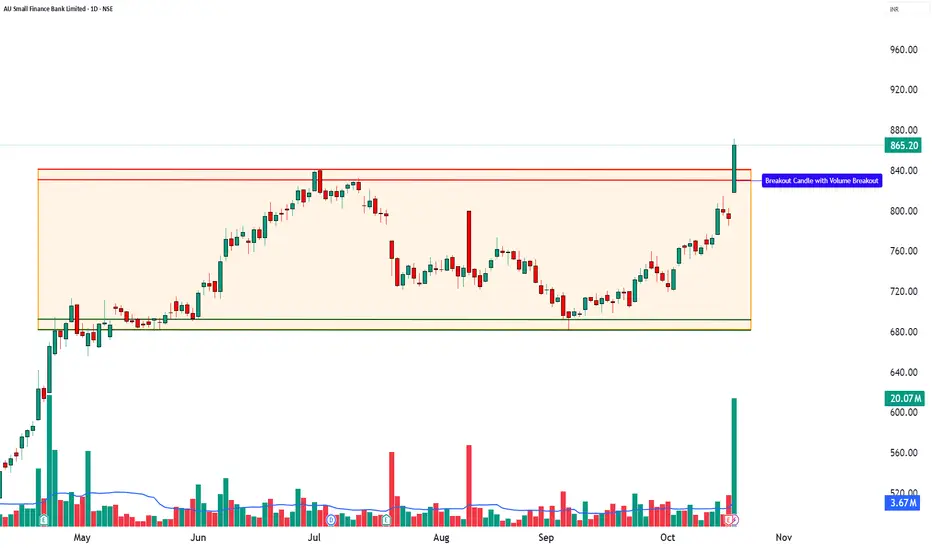
Sector: Banking & Finance | CMP: ₹865.20 | View: Bullish Momentum Setup
🔹Price Action:
A.U. Small Finance Bank showed strong upward movement with a big green candle and very high trading volume. The stock opened at its lowest point and kept rising all day, which means buyers were in full control. It also made a new 52-week high, showing that momentum and confidence are strong. In simple words, the stock is breaking out with power, and buyers are clearly leading the trend.
🔹 Technical Analysis:
AUBANK is showing strong bullish momentum with a clear 52-week breakout, signaling fresh buying interest and strong confidence among traders. The big green candle with open-equals-low formation shows that buyers were active right from the start of the session. The RSI at 81 reflects strong momentum, while MACD at 9.35 confirms a positive crossover, adding to the bullish view. Similarly, CCI at 258 and Stochastic at 96 indicate powerful buying pressure, suggesting that the uptrend is well-supported. The VWAP at ₹855.39 is acting as an important support level, helping the price stay stable even during intraday pullbacks. Meanwhile, a Bollinger Band breakout and a BB squeeze-off pattern hint that the stock may continue its sharp upward move. Altogether, the indicators show a well-supported bullish setup, ideal for short to medium-term swing trades.
🔹 Volume Analysis:
The stock saw a huge rise in trading volume — almost 5 times higher than normal! This is a strong sign that big investors or institutions are showing interest. Such a jump in both price and volume means the breakout is real and reliable, not just a short-term move. This kind of volume confirms fresh buying and positive sentiment, suggesting the stock could stay strong for some time.
🔹 Chart Analysis:
For months, AUBANK was moving sideways between ₹680 and ₹840. Now, it has broken above ₹840 with heavy volume, showing that the stock has ended its consolidation phase and started a new bullish trend. This breakout shows that buyers are taking charge, and if the volume remains high, the stock may continue to move upward in the coming sessions.
🔹 Demand Zone: ₹814 – ₹785
This area acts as a strong demand zone, where earlier buying interest was visible. If the price revisits this zone, it may attract fresh accumulation or renewed buying activity. Traders and learners can observe this region for potential re-entry setups once the price shows signs of stability or reversal — purely for educational understanding of demand zone behavior in momentum setups.
🔹 Key Levels:
Resistance: 885/905/939
Support: 832/798/778
🔹 STWP Trade Analysis:
Bias: Bullish
Breakout Level: 872
Intraday Support: 851
Swing Support: 783
Intermediate Support: 680
Observation:
🔹 Final Outlook:
Momentum: Moderate | Trend: Neutral | Risk: High | Volume: High
The setup shows strong bullish signs but comes after a sharp rally, so short-term volatility can be expected. Sustained volume above ₹850 will keep the trend positive.
🔹 Learning Note (Educational Purpose):
This setup is a good example of how volume + breakout candles signal a shift in momentum. It teaches traders that when price breaks resistance with strong volume, it often marks the beginning of a new trend rather than the end of one. Always confirm with RSI/MACD alignment for reliability.
🔹 STWP Mentor Note:
Momentum trading works best when price, structure, and volume align together. Always look for clean breakouts backed by heavy volume — they tell you where smart money is moving. As a trader, focus more on learning price behavior than just chasing the move. Every breakout teaches patience, confidence, and timing — three pillars of successful trading.
───────────────────────────────────────────────
⚠️ **DISCLOSURE & DISCLAIMER (SEBI-Compliant)**
───────────────────────────────────────────────
📘 **Purpose:**
This content is created **solely for educational and informational purposes** to help readers understand market structure, price action, and technical analysis.
It does **not constitute investment advice**, research recommendation, or a solicitation to buy or sell any security.
👤 **Author Disclosure:**
The author is **not a SEBI-registered investment adviser or research analyst.**
All chart studies, price levels, and observations are based on publicly available data (e.g., **NSE India**, **TradingView**) and are presented purely for **learning illustration**.
📊 **Position Status:**
No active position in * * at the time of publication.
“The author may sometimes trade in the securities discussed, but such trades are independent and shared here only for educational understanding.”
⚠️ **Risk Disclosure:**
Trading and investing involve financial risk. Market movements can be unpredictable, and losses may exceed invested capital.
Readers are strongly advised to consult a **SEBI-registered investment adviser** before making any trading or investment decisions.
🧠 **Responsibility Clause:**
By engaging with this post, you acknowledge that you are **solely responsible for your own trading or investment decisions**, and that this content is intended only for **market education and awareness**.
───────────────────────────────────────────────
💬 **Did You Find This Useful?**
If this analysis helped you understand price structure or market psychology better:
🔼 **Boost** to support transparent & structured financial education.
✍️ **Comment** your insights, observations, or questions — let’s learn together.
🔁 **Share** this post with learners and aspiring traders who value discipline.
📚 **Follow STWP** for more structured, educational breakdowns on stocks & setups.
🚀 *Stay Calm. Stay Clean. Trade With Patience.*
💡 *Trade Smart | Learn Zones | Be Self-Reliant.*
───────────────────────────────────────────────
#AUBANK entering 4th Wave – Downtrend likely ahead?Technical analysis suggests AU Small Finance Bank is currently in Wave 4 structure, indicating a potential correction phase. Investors should brace for a possible decline. Caution is advised in the short term.
**This is an educational market outlook, not investment advice. Please consult a SEBI-registered advisor before taking any investment decisions.**

Strong Bullish Momentum and Volume SurgeAUBANK (8.41%)
Bullish Momentum Building
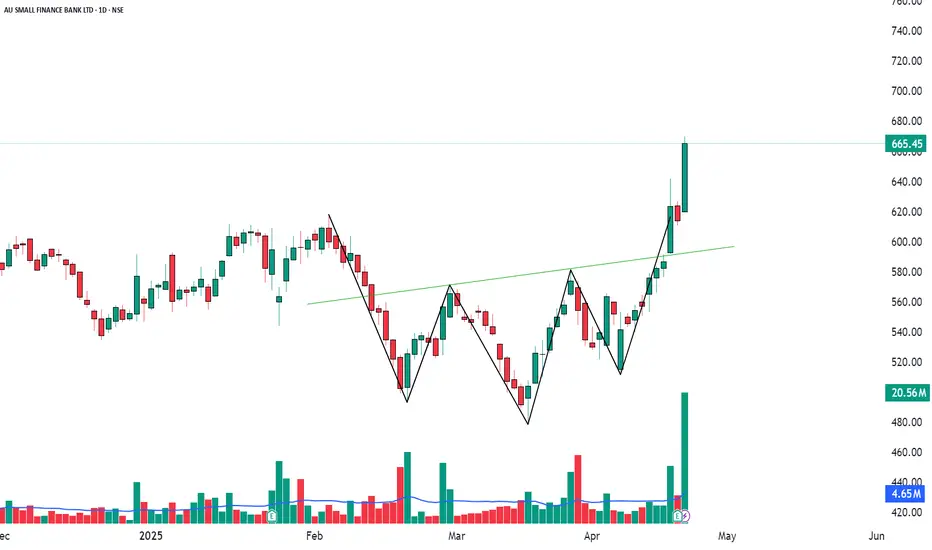
AUBANK is showing promising bullish signs across several technical indicators. A Bullish Marubozu candlestick has formed, complemented by an RSI Breakout, signaling a shift toward bullish momentum. The stock has broken out of the Bollinger Bands, with VWAP and Volume confirming the strength of this move.
Resistance Levels: 684-702-733
Support Levels: 634-602-584
Entry: @/above 669.90
Stop Loss: @/below 590.75
Volume Analysis: A significant volume breakout was observed on April 23rd, surpassing the average volume of 4.65M, suggesting strong market interest and buying power.
AU BANK | Back to back demand zonesStock finally showing signs of some positivity
As it finally managed to close above previous swing high
Downside we can find 2 entry points or demand zones (RBR & DBR)
First area of entry from 505 to 530
Second area of entry from 480 to 495
Downside SL below 475 (Options Data)
Lower TF confirmation compulsory

AU SMALL FINANCE BANK - SWING TRADING IDEASymbol - AUBANK
AUBANK is currently trading at 575
I'm seeing a trading opportunity on buy side.
Buying AUBANK Futures at 575
I will add more long position at 566, if comes.
Holding with SL of 558
Targets I'm expecting are 600 - 620 & above.
Disclaimer - Do not consider this as a buy/sell recommendation. I'm sharing my analysis & my trading position. You can track it for educational purposes. Thanks!

AU Bank On Weekly Demand ZoneNew Study For Paper Trade Au Small Finance Bank
Buying Zone 557-560 (Sorry For Late Sharing Idea)
StopLoss : 550
Target : 600,620,640
Study Logic
👉 Weekly Demand Zone
👉 Weekly Hammer Candlestick Pattern
👉 1D Bullish Harami Candlestick Pattern
👉 52 Week Low Share
👉 Sector Indices Also On Weekly Demand Zone
#Marker Is Weak And Au Small Finance Bank At Distal Risky Study
Only For Paper Trade And Education Purpose Don't Real Trade
I am not sebi Registered Person Post is only for Paper Trade, Practice And Education purpose i am not responsible for any profit and loss.

A U Bank - Good risk to reward callStock at strong daily support levels
Levels at 550-555
Can give stock a bounce at least up to 600 levels
Any close above 548 will nullify the view
Current market phase - Bearish
Stock View - Bullish
Trade cautiously

AU BANK - This Range is No Joke !Please pay attention to the range 695 to 755
If there is reakout or breakdown then consider trading that side, also keep boosting or liking this so that I am reminded to trade the same too !
Honestly, In my opinion there is a great accumulation or distribution happening (I cant figure out between the two) but I surely know that this is the preparation for a trending move 100%.
Keep watching this script and believe me, I've seen these a lot of times.

AUBANK - Ichimoku Breakout📈 Stock Name - AU Small Finance Bank
🌐 Ichimoku Cloud Setup:
1️⃣ Today's close is above the Conversion Line.
2️⃣ Future Kumo is Turning Bullish.
3️⃣ Chikou span is slanting upwards.
All these parameters are shouting BULLISH at the Current Market Price and even more bullishness anticipated AFTER crossing 753.
🚨Disclaimer: This is not a Buy or Sell recommendation. It's for educational purposes and a guiding light to learn trading in the market.
#CloudTrading
#IchimokuCloud
#IchimokuFollowers
#Ichimokuexpert
Excited about this analysis? Share your thoughts in the comments below!
👍 Like, Share, and Subscribe for daily market insights! 🚀
#StockAnalysis #MarketWatch #TradingEducation #ichimoku #midcap #smallcap #largecap #AUBANK

AUBANK - LONG TERM INVESTMENT CANDIDATE ?AU Small Finance Bank Limited is engaged in providing a range of banking and financial services including retail banking, wholesale banking, treasury operations and other services.
CMP - 565
AUBANK is currently trading in a support zone & looking good for long term investing perspective. I am allocating my investment allocation at CMP.
Targets I'm expecting are 785 & 850 which is 40-48% upside from current level.
My SL would be 500.
Disclaimer - Do not consider this as a buy/sell recommendation. I'm sharing my analysis & my investment position. You can track it for educational purposes. Thanks!

AUBANK TRIPLE BOTTOM SUPPORTAUBANK
CMP 669
Formed a TRIPLE BOTTOM support at 635 and bounced strongly
But,
Now small resistance is 690--700
If sustained above it can pump upto 720 / 740 / 760 / 780 WITHIN SHORT TERM
----------------------------------------------------------------------------------------------------------
But recently there was a huge gap up in this stock around 23rd april....
This gap filling is pending..........
So below 630 this GAP can be FILLED....
AND 575 WILL SUPPORT AUBANK TO BOUNCE
----------------------------------------------------------------------------------------------------------
Regards...
Keshav..
05/11/2023

AUBANK - Swing Trade Analysis - 30th April #stocksAU SMALL FINANCE BANK (1D TF) - Swing Trade Analysis given on 30th April, 2024
Pattern: CUP & HANDLE
- Volume Buildup at Resistance - Done ✓
- Daily Resistance Breakout - In Progress
- Demand Zone Retest & Consolidation - In Progress
* Disclaimer


20 Jan ’24 — Probably the first working Saturday for a TraderNifty Analysis - Stance Neutral ➡️
Recap from yesterday: “The last 3 candles almost gave away the clue that bearishness was ending. We would still like to see how Nifty will open tomorrow. Ideally, it should open above 21698 i.e. within the channel to cement the idea that Bears are thrown out of control.”
4mts chart
Open was right at the trendline and it acted as a resistance. Nifty was unable to breach it and it meant we would have either a flat or negative day. A lot of interesting things happened today.
NiftyIT moved down and ended with -371pts ~ 1.00%. Most of them would not have noticed IT falling.
The banks outperformed today, Kotak +2.41%, AUBANK +2.32%, CANBK +2.22%, PNB +2.74% & ICICI +0.95%. If not for these, Nifty would have had a serious fall today
Nifty’s low today was lower than yesterday’s low and it has closed the gap from 18th Jan.
The OTMs of both Nifty and BankNifty were trading in green and sometimes had unusual spikes often seen during low liquidity. Despite the quick announcement to have a working day today - the actual traded volumes or contracts were not that bad either.
Initially, we thought DII and FII would not participate, but they ended up selling 719 & 545 crores today
63mts chart
Nifty was unable to get into the ascending channel despite results from RELIANCE and major banks. We suspect some weakness is haunting N50. It could completely be news/event-driven or related to the build-up for the budget session. The selling figures from the institutions may be because of this. From a technical analysis perspective, Nifty looks range bound between 21913 and 21491. Falling below 21491 could auto-trigger further shorts and it could even be an avalanche. Our stance remains neutral for Tuesday, also note that Monday will be a holiday for the consecration of Ram Mandir in Ayodhya.

AUBANK - Watchout for weekly breakoutAUBANK - Add to your watchlist and watch out for a weekly breakout from a channel that has been around for the last 3 years.

AUBANK INVERSE H&S BREAKOUTAUBANK breaking inverse h&S pattern
with good volume and rsi
trading above all key ema
educational idea

ABCD under formation in AUBANKAUBANK is forming a harmonic pattern (possible) ABCD.
The projected completion point is 788.20 spot price.
The invalidation point for this pattern will be 758.35, the price if rejected from here and breaking the B level will invalidate this pattern.
The stock is for analysis for possible trade opportunities for SELL on the completion of this pattern.

AUBANK Stock Analysis !!AUBANK has made Brodening Pattern.
Currently Stock is around the resistance.
We can see huge upside after braekout
and
We can see Downside also if stock is not able to cross the resitance.

AUBANK - LONGAUBANK chart has given a breakout of resistance line as indicated in the above chart.
Also, it has closed the Gap down opening in last 2-3 sessions.
Momentum is also positive I feel.
Near term target 794
SL can be kept around the yellow line in the chart..
These are my views, please do your due delligence.
If you like this, please do like it and subscribe for more :)

AUBANKAUBANK:- Stock is coming for breakout deck retesting, some plan to apply strict stop loss
Hello traders,
As always, simple and neat charts so everyone can understand and not make it too complicated.
rest details mentioned in the chart.
will be posting more such ideas like this. Until that, like share and follow :)
check my other ideas to get to know about all the successful trades based on price action.
Thanks,
Ajay.
keep learning and keep earning.

AU BANK, Buy Strategy!AU BANK has been consolidating and trading in a range since about 2 years now. When will it break out? I don't know, and if anyone says they do, they are gambling. But what I can say is that if price breaks out of the range with good volumes, there is a good chance that we will see the price trending upwards for some time, which would be a very good opportunity to make some healthy profits. Keeping that in mind -
Buy above the white channel, if stock breaks out with healthy volumes.
Stoploss below just below the white channel.
A target of 940 is certainly achievable, maybe even more considering how long it has been consolidating on the weekly chart.
That said I would still advise the age old practice of having a trailing stop loss in the form of a moving average or ATR, whichever floats your boat.

Good Levels to Invest for Longterm
Good Day ,
Hello Traders,
AU Bank looks a good candidate for Long Term as it is trading at 582 , a fall of nearly 150 points from the top. Next key level is 462 which it had to sustain , below it will be a downtrend.
Chart Self Explanatory.
Time Frame : Daily
Disclaimer : I am not SEBI registered analyst, this is for educational purposes.
Please trade as per your risk and do consult with your financial advisor before taking any
trading decisions..
If you really like the analysis , please do comments, LIKE and Follow me.
