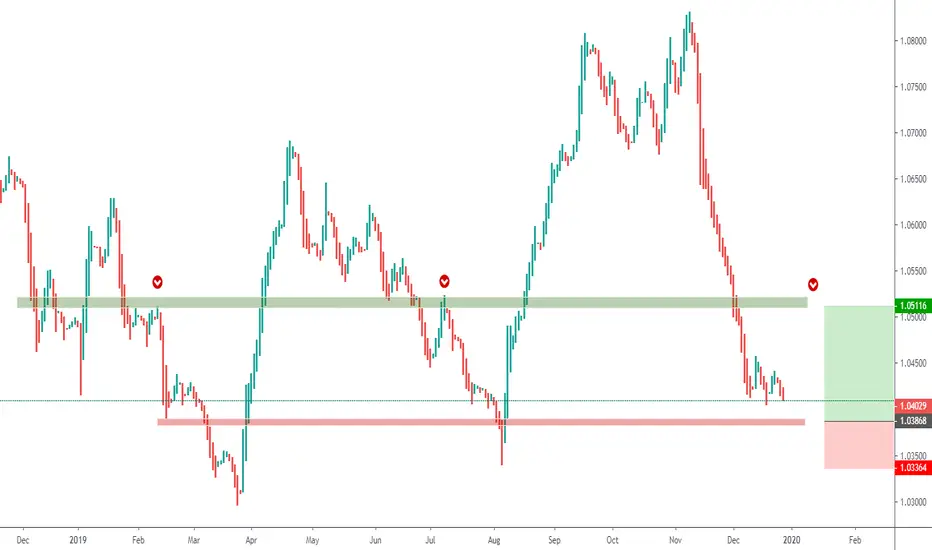
AUDNZD SHORT TERM BUYAUDNZD
The pair trading in a bearish market since November last week.and erase most of the gains.
Now its trading at major resistance level at 78.6% Fibonacci
From the 1.03900 level we can open buy orders and Potential take profit will be 1.05100
Stop lose may be placed at 1.03360 level
AUDNZD

A second Chance to Buy in AUDNZDMidterm forecast:
While the price is above the support 1.0660, resumption of uptrend is expected.
We make sure when the resistance at 1.0850 breaks.
If the support at 1.0660 is broken, the short-term forecast -resumption of uptrend- will be invalid.
We will close our open trades, if the Midterm level 1.0660 is broken.
Technical analysis:
A trough is formed in daily chart at 1.0710 on 11/04/2019, so more gains maximum to Major Resistance (1.0850) is expected.
Price is above WEMA21, if price drops more, this line can act as dynamic support against more losses.
Relative strength index (RSI) is 65.
New trading suggestion:
*There is still a possibility of temporary retracement to suggested support line (1.0660). if so, traders can set orders based on Price Action and expect to reach short-term targets.
* If you missed our first HUNT , you have a second chance to buy above the suggested support line (1.0660).
Entry signal:
Signal to enter the market occurs when the price comes to " Buy zone " then forms one of the reversal patterns, whether " Bullish Engulfing ", " Hammer " or " Valley " in other words, NO entry signal when the price comes to the zone BUT after any of reversal patterns is formed in the zone. To learn more about " Entry signal " and the special version of our " Price Action " strategy FOLLOW our lessons :
Trade Setup:
We opened 10 BUY trade(s) @ 1.0354 based on 'Hammer' entry method at 2019.08.06.
Total Profit: 3595 pip
Closed trade(s): 1659 pip Profit
Open trade(s): 1936 pip Profit
Closed Profit:
TP1 @ 1.0430 touched at 2019.08.07 with 76 pip Profit.
TP2 @ 1.0490 touched at 2019.08.07 with 136 pip Profit.
TP3 @ 1.0585 touched at 2019.08.21 with 231 pip Profit.
TP4 @ 1.0660 touched at 2019.08.29 with 306 pip Profit.
TP5 @ 1.0760 touched at 2019.09.13 with 406 pip Profit.
TP6 @ 1.0990 touched at 2019.10.07 with 504 pip Profit.
76 + 136 + 231 + 306 + 406 + 504 = 1659 pip
Open Profit:
Profit for one trade is 1.0838(current price) - 1.0354 (open price) = pip
4 trade(s) still open, therefore total profit for open trade(s) is 484 x 4 = 1936 pip
All SLs moved to Break-even point.
Take Profits:
TP7= @ 1.0990
TP8= @ 1.1140
TP9= @ 1.1335
TP10= Free


A second Chance to Buy in AUDNZDMidterm forecast:
There is no trend in the market and the price is in a range bound, but we forecast an uptrend wave above 1.0630 would begin in Midterm.
We will close our open trades, if the Midterm level 1.0630 is broken.
Technical analysis:
While the RSI support #1 at 53 is not broken, the probability of price decrease would be too low.
A peak is formed in daily chart at 1.0825 on 09/16/2019, so more losses to support(s) 1.0730, 1.0660 and minimum to Major Support (1.0630) is expected.
Price is above WEMA21, if price drops more, this line can act as dynamic support against more losses.
Relative strength index (RSI) is 57.
New trading suggestion:
*There is still a possibility of temporary retracement to suggested support line (1.0630). if so, traders can set orders based on Price Action and expect to reach short-term targets.
* If you missed our first HUNT , you have a second chance to buy above the suggested support line (1.0630).
Entry signal:
Signal to enter the market occurs when the price comes to " Buy zone " then forms one of the reversal patterns, whether " Bullish Engulfing ", " Hammer " or " Valley " in other words, NO entry signal when the price comes to the zone BUT after any of reversal patterns is formed in the zone. To learn more about " Entry signal " and the special version of our " Price Action " strategy FOLLOW our lessons :
Trade Setup:
We opened 10 BUY trade(s) @ 1.0354 based on 'Hammer' entry method at 2019.08.06.
Total Profit: 4224 pip
Closed trade(s): 1920 pip Profit
Open trade(s): 2304 pip Profit
Closed Profit:
TP1 @ 1.0430 touched at 2019.08.07 with 76 pip Profit.
TP2 @ 1.0490 touched at 2019.08.07 with 136 pip Profit.
TP3 @ 1.0585 touched at 2019.08.21 with 231 pip Profit.
TP4 @ 1.0660 touched at 2019.08.29 with 306 pip Profit.
TP5 @ 1.0760 touched at 2019.09.13 with 406 pip Profit.
76 + 136 + 231 + 306 + 406 = 1155 pip
Open Profit:
Profit for one trade is 1.0738 (current price) - 1.0354 (open price) = 384 pip
5 trade(s) still open, therefore total profit for open trade(s) is 384 x 5 = 1920 pip
All SLs moved to Break-even point.
Take Profits:
TP6= @ 1.0850
TP7= @ 1.0990
TP8= @ 1.1140
TP9= @ 1.1335
TP10= Free

A second Chance to Buy in AUDNZDMidterm forecast:
While the price is above the support 1.0530, resumption of uptrend is expected.
We make sure when the resistance at 1.0730 breaks.
If the support at 1.0530 is broken, the short-term forecast -resumption of uptrend- will be invalid.
We will close our open trades, if the Midterm level 1.0530 is broken.
Technical analysis:
The ascending flag taking shape suggests we will soon see another leg higher.
While the RSI support #1 at 53 is not broken, the probability of price decrease would be too low.
A peak is formed in daily chart at 1.0705 on 09/03/2019, so more losses to support(s) 1.0630, 1.0585, 1.0545 and minimum to Major Support (1.0530) is expected.
Price is above WEMA21, if price drops more, this line can act as dynamic support against more losses.
Relative strength index (RSI) is 63.
New trading suggestion:
*There is still a possibility of temporary retracement to suggested support line (1.0530). if so, traders can set orders based on Price Action and expect to reach short-term targets.
* If you missed our first HUNT , you have a second chance to buy above the suggested support line (1.0530).
Entry signal:
Signal to enter the market occurs when the price comes to " Buy zone " then forms one of the reversal patterns, whether " Bullish Engulfing ", " Hammer " or " Valley " in other words, NO entry signal when the price comes to the zone BUT after any of reversal patterns is formed in the zone. To learn more about " Entry signal " and the special version of our " Price Action " strategy FOLLOW our lessons :
Trade Setup:
We opened 10 BUY trade(s) @ 1.0354 based on 'Hammer' entry method at 2019.08.06.
Total Profit: 2525 pip
Closed trade(s): 617 pip Profit
Open trade(s): 1908 pip Profit
Closed Profit:
TP1 @ 1.0430 touched at 2019.08.07 with 76 pip Profit.
TP2 @ 1.0490 touched at 2019.08.07 with 136 pip Profit.
TP3 @ 1.0585 touched at 2019.08.21 with 231 pip Profit.
TP4 @ 1.0660 touched at 2019.08.29 with 306 pip Profit.
76 + 136 + 231 + 306 = 617 pip
Open Profit:
Profit for one trade is 1.0672 (current price) - 1.0354 (open price) = 318 pip
6 trade(s) still open, therefore total profit for open trade(s) is 318 x 6 = 1908 pip
All SLs moved to Break-even point.
Take Profits:
TP5= @ 1.0760
TP6= @ 1.0850
TP7= @ 1.0990
TP8= @ 1.1140
TP9= @ 1.1335
TP10= Free

Don't miss the great buy opportunity in AUDNZDTrading suggestion:
. There is a possibility of temporary retracement to suggested support line (1.04517). if so, traders can set orders based on Price Action and expect to reach short-term targets.
Technical analysis:
. AUDNZD is in a range bound and the beginning of uptrend is expected.
. The price is above the 21-Day WEMA which acts as a dynamic support.
. The RSI is at 62.
Take Profits:
TP1= @ 1.0545
TP2= @ 1.0630
TP3= @ 1.0720
SL= Break below S2

There is a trading opportunity to buy in AUDNZDMidterm forecast:
While the price is above the support 1.0275, resumption of uptrend is expected.
We make sure when the resistance at 1.0630 breaks.
If the support at 1.0275 is broken, the short-term forecast -resumption of uptrend- will be invalid.
Technical analysis:
While the RSI downtrend #1 is not broken, bearish wave in price would continue.
Price is below WEMA21, if price rises more, this line can act as dynamic resistance against more gains.
Relative strength index (RSI) is 41.
Trading suggestion:
. There is a possibility of temporary retracement to suggested support zone (1.0360 to 1.0275). if so, traders can set orders based on Price Action and expect to reach short-term targets.
Beginning of entry zone (1.0360)
Ending of entry zone (1.0275)
Entry signal:
Signal to enter the market occurs when the price comes to " Buy zone " then forms one of the reversal patterns, whether " Bullish Engulfing ", " Hammer " or " Valley " in other words, NO entry signal when the price comes to the zone BUT after any of reversal patterns is formed in the zone. To learn more about " Entry signal " and the special version of our " Price Action " strategy FOLLOW our lessons :
Take Profits:
TP1= @ 1.0430
TP2= @ 1.0490
TP3= @ 1.0585
TP4= @ 1.0660
TP5= @ 1.0760
TP6= @ 1.0850
TP7= @ 1.0990
TP8= @ 1.1140
TP9= @ 1.1335
TP10= Free

Don't miss the great buy opportunity in AUDNZDTrading suggestion:
. There is a possibility of temporary retracement to suggested support line (1.0419). if so, traders can set orders based on Price Action and expect to reach short-term targets.
Technical analysis:
. AUDNZD is in a range bound and the beginning of uptrend is expected.
. The price is above the 21-Day WEMA which acts as a dynamic support.
. The RSI is at 48.
Take Profits:
TP1= @ 1.0488
TP2= @ 1.0545
TP3= @ 1.0720
SL= @ 1.0375


The same way as last timeIf YPP (P) 1.08720 functions as a support line, think long.
The first limit is WePP (R1) 1.09559
The second limit is 1.10000
I would be grateful if you like it idea,give me follow or agrees!
------------------------- --------------------------
Brown thick line: Yearly Pivot Points (YPP in the text)
Light blue thick line: Monthly Pivot Points (MPP in the text)
Green thin line: Weekly Pivot Points (WePP in the text)
Indigo thick line: Horizontal line or Trend line seen by weekly or monthly
Indigo thin line: Horizontal line or Trend line seen by 4hourly or daily
Indigo dotted line: outstanding round number.
Red thick line: Untrustworthy line for me
Red curve: EMA 20 close
Indigo curve: EMA 200 close
Green curve: EMA 800 close
Black curve: EMA 1600 close
x mark: Line which may not function
------------------------- --------------------------

Is YPP (P) still reliable?If it judges that YPP (P) functions as support, it will be long.
The first limit is WePP (P)
The second limit is near the most high value of 1.09800
I would be grateful if you like it idea,give me follow or agrees!
------------------------- --------------------------
Brown thick line: Yearly Pivot Points (YPP in the text)
Light blue thick line: Monthly Pivot Points (MPP in the text)
Green thin line: Weekly Pivot Points (WePP in the text)
Indigo thick line: Horizontal line or Trend line seen by weekly or monthly
Indigo thin line: Horizontal line or Trend line seen by 4hourly or daily
Indigo dotted line: outstanding round number.
Red thick line: Untrustworthy line for me
Red curve: EMA 20 close
Indigo curve: EMA 200 close
Green curve: EMA 800 close
Black curve: EMA 1600 close
x mark: Line which may not function
------------------------- --------------------------

NZDUSD - Bullish Divergence As indicated on CCI a bullish divergence is seen on NZDUSD pair on the daily chart. We can buy this as per the indicated limits.
