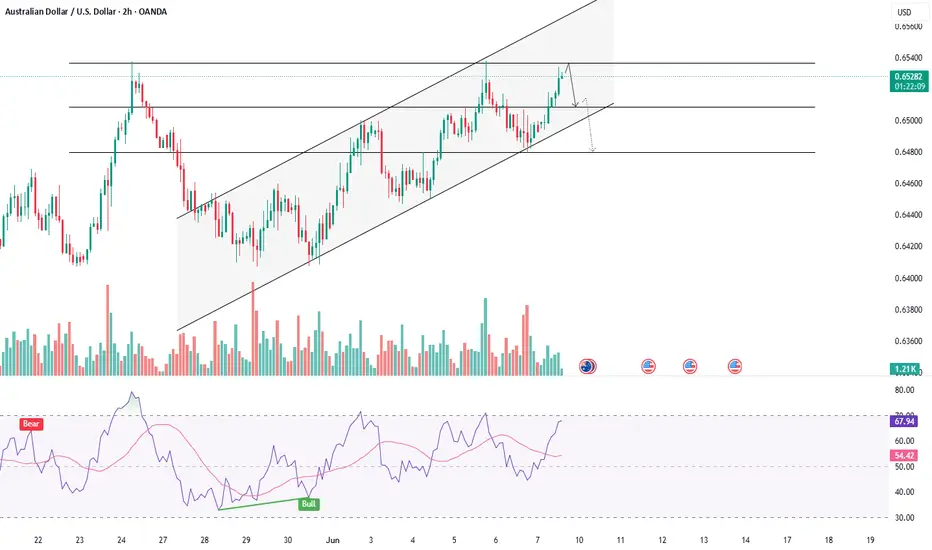
AUDUSD BREAKS CHANNEL RESISTANCE - TREND SHIFT AHEAD?Symbol - AUDUSD
AUDUSD is undergoing a corrective phase after breaking above the resistance of the descending channel. The market now requires consolidation or the formation of a trading range above 0.6525 to sustain bullish momentum.
The US dollar remains in a consolidation phase and shows limited potential for further appreciation. Mounting pressure ahead of the upcoming Federal Reserve meeting may act as a supportive factor for the Australian dollar.
The pair is transitioning into a distribution phase following a period of consolidation. The breakout above 0.6525 confirmed a breach of the descending channel’s resistance, signaling the early stages of a potential trend reversal. Sustained price action above this level could pave the way for continued upside movement.
Resistance levels: 0.6567, 0.6610
Support levels: 0.6525, 0.6493
Currently, the pair is attempting to establish a shift in trend direction. The ongoing consolidation and distribution above the previously broken trendline are constructive signs. However, the formation of a defined trading range will be essential to confirm the establishment of a new local uptrend.
Audusdforecast

AUDUSD(20250912)Today's AnalysisMarket News:
U.S. initial jobless claims surged to 263,000 in the week ending September 6, reaching a near four-year high. Traders are fully pricing in three Federal Reserve interest rate cuts by the end of 2025.
Technical Analysis:
Today's Buy/Sell Levels:
0.6636
Support and Resistance Levels:
0.6712
0.6683
0.6665
0.6607
0.6588
0.6560
Trading Strategy:
If the price breaks above 0.6665, consider a buy entry, with the first target at 0.6683.
If the price breaks below 0.6636, consider a sell entry, with the first target at 0.6607.

AUDUSD(20250911)Today's AnalysisMarket News:
The U.S. PPI annual rate for August hit 2.6%, the lowest since June. Traders are increasing bets on a Fed rate cut.
Technical Analysis:
Today's bull/bear range:
0.6608
Support and resistance levels:
0.6664
0.6643
0.6629
0.6587
0.6573
0.6553
Trading Strategy:
If the price breaks above 0.6629, consider buying, with the first target at 0.6643.
If the price breaks below 0.6608, consider selling, with the first target at 0.6587

AUDUSD(20250908)Today's AnalysisMarket News:
Non-farm payroll growth fell significantly short of expectations, with June's data revised downward to negative territory, marking the first contraction since 2020. The unemployment rate hit a nearly four-year high.
Technical Analysis:
Today's buy/sell levels:
0.6548
Support and resistance levels:
0.6633
0.6601
0.6580
0.6515
0.6494
0.6463
Trading Strategy:
On a breakout above 0.6580, consider a buy entry, with the first target at 0.6601.
On a breakout above 0.6548, consider a sell entry, with the first target at 0.6515

AUDUSD(20250904)Today's AnalysisMarket News:
① Waller: I believe we should cut interest rates at the next meeting. Multiple rate cuts are possible in the future, but the exact pace depends on the data.
② Musallem: Current interest rates are appropriate, but there are risks in the job market.
③ Bostic: Concerned about inflation, I still believe one rate cut this year is appropriate.
④ The Federal Reserve will hold a payments innovation conference on October 21st, which will discuss stablecoins, artificial intelligence, and tokenization.
⑤ Fed Governor nominee Milan: If confirmed, I will maintain the independence of the FOMC.
⑥ Kashkari: There is room for a modest rate cut.
⑦ The Federal Reserve Beige Book: Economic activity is roughly flat, with businesses and households feeling the impact of tariffs.
Technical Analysis:
Today's Buy/Sell Levels:
0.6532
Support and Resistance Levels:
0.6584
0.6564
0.6552
0.6512
0.6499
0.6480
Trading Strategy:
If the price breaks above 0.6552, consider entering a buy position, with the first target price at 0.6564.
If the price breaks below 0.6532, consider entering a sell position, with the first target price at 0.6512

AUDUSD - TESTING KEY RESISTANCESymbol - AUDUSD
CMP - 0.6530
AUDUSD continues to advance amid persistent uncertainty surrounding the US dollar, which remains in a consolidation phase. The currency pair is approaching a key resistance level at 0.6537
The dollar is currently range-bound due to prevailing market indecision. In contrast, the Australian dollar is gaining strength and appears poised to test a significant liquidity zone.
Within the context of the prevailing trend, the pair is progressing toward both resistance and the identified liquidity area. Given the considerable distance from the initial opening, the potential for continued upside may diminish as the pair nears its target. A false breakout above 0.6537 could signal the onset of a corrective pullback.
Resistance level: 0.6537
Support levels: 0.6509, 0.6480
A swift movement toward resistance without sustained bullish momentum could result in a false breakout at 0.6537 Should the price consolidate below this threshold, a corrective phase may follow before any potential resumption of the upward trend.
"AUD/USD Reversal Setup – Short from Supply Zone!''🔹 Trend Overview:
Price was in a strong uptrend 🔼, forming higher highs and higher lows.
Key Zones:
🟦 Supply Zone (🔵 Resistance Area):
0.63803 - 0.64064
Price entered this zone and started to slow down ⏸️, showing signs of seller strength.
🔵🟤🟤🟤
📍Entry Point: 0.63803
This is where the short (sell) trade is planned.
✍️ "Let’s short it here!"
🚫 Stop Loss: 0.64064
Just above the supply zone to avoid false breakouts.
🛑 "If it goes here, we're out!"
🎯 Target Point: 0.62800
Previous support zone.
🟢💰🟢
💥 "This is where we take profit!"
Indicators:
📈 EMA (7) – Black line
Shows price momentum. Currently flattening ➡️, meaning bulls are losing steam.
Trade Idea Summary:
📉 Bias: Bearish (Short)
✅ Entry: 0.63803
🛑 Stop Loss: 0.64064
🎯 Target: 0.62800
⚖️ Risk/Reward Ratio: ~1:3.8 (Very solid!)
⏱️ Timing: Watching for signs of reversal before entering

AUD/USD) Resistance level pullback Short Read The ChaptianSMC Trading point update
analysis of the AUD/USD pair on the 2-hour timeframe, showing a possible bearish setup. Here's a breakdown of the idea behind it:
Key Observations:
1. Current Trend:
The pair was in an uptrend, as indicated by the rising channel (parallel trendlines). However, it has now broken out of that channel.
2. Resistance Level:
The price has reached a resistance zone around 0.64000, and it seems to be rejecting this level.
3. 2 Timeframe Demand Zone:
Around the 0.63300 – 0.63400 range, this area previously acted as a demand zone (support), and the chart suggests price might retest it.
4. Projected Move:
First, a pullback up into the resistance zone could occur.
Then a drop to the demand zone.
If the demand zone fails to hold, the price could head down toward the key support/FVG (Fair Value Gap) around 0.61000 – 0.61500.
5. EMA (200):
The 200 EMA is below the price, suggesting longer-term bullish pressure, but it's starting to flatten, which could signal weakness in the uptrend.
6. RSI Indicator:
RSI is around 52, showing neutral momentum—neither overbought nor oversold, allowing room for movement in either direction.
Mr SMC Trading point
---
Idea Summary:
The chart suggests a potential reversal from the uptrend into a downtrend, triggered by a failure to break above resistance. The two key targets for a bearish move are:
First: the 2TF demand zone
Final: the key support/FVG zone
Pales support boost 🚀 analysis follow)

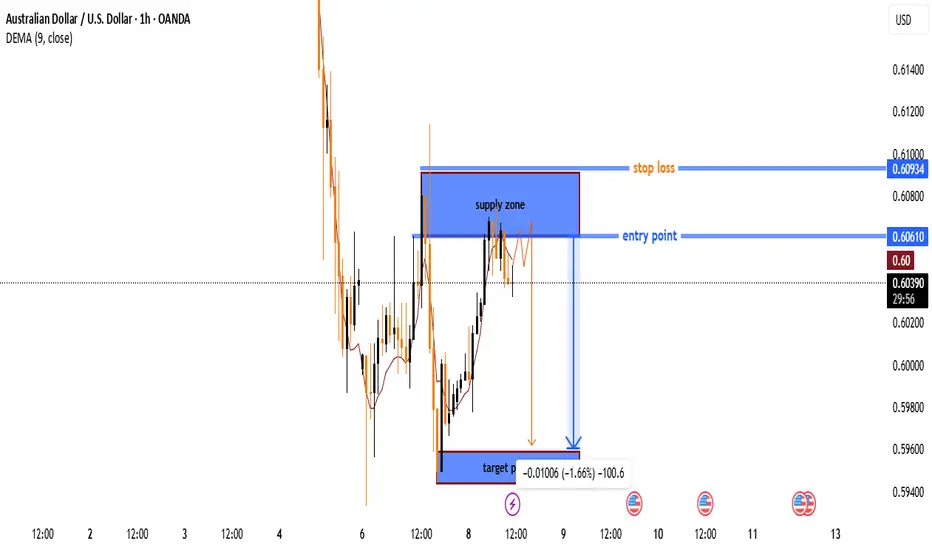
AUD/USD Supply Zone Rejection Trade Setup🔵 Supply Zone → (Blue highlighted area) The price is expected to reverse from here.
🔹 Entry Point → 0.60610 📍 (Marked with a blue line) The trade is planned to start here.
🟠 Stop Loss → 0.60934 ❌ (Marked with an orange line) If the price goes above this, the trade will be exited to prevent further loss.
🔻 Target Point → 0.59400 🎯 (Marked at the bottom) Expected profit zone if the trade moves as planned.
📉 Trade Plan:
✅ Short position (Sell trade) expected to drop from the supply zone.
🚀 Risk-to-reward ratio looks good as the potential profit is higher than the risk.
⚠️ Risk Factor: If price breaks above the supply zone, the setup might fail.
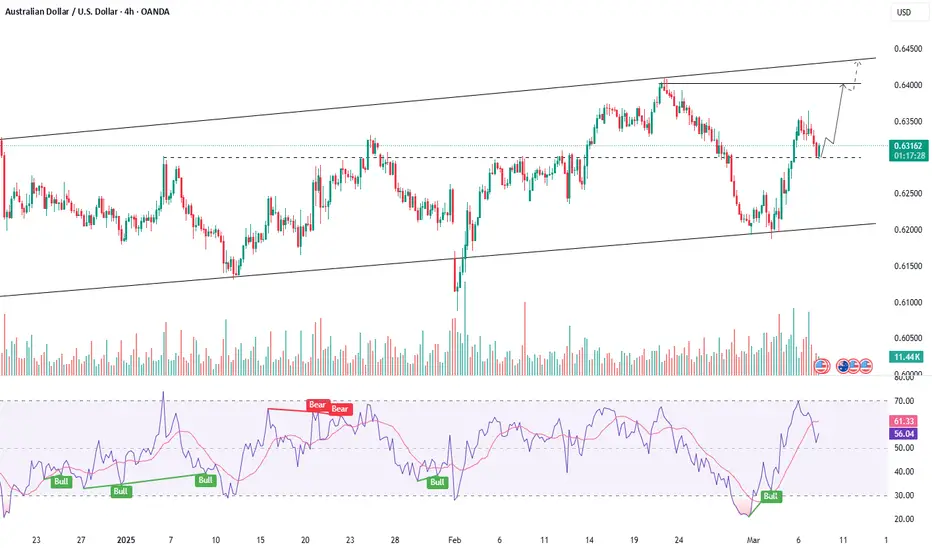
AUDUSD - RETRACEMENT WITHIN UPTREND BEFORE FURTHER GROWTHSymbol - AUDUSD
CMP - 0.6302
AUDUSD pair, supported by a decline in the US dollar, holds significant potential for continued growth. However, given the upcoming NFP release today, Friday, the associated risks are heightened.
Currently, the currency pair is establishing a local uptrend, and in conjunction with the weakening dollar, the Australian dollar may sustain its strengthening trajectory. On the 4-hour chart, a local correction is developing towards an imbalance zone, with a strong support level at 0.6300 The price is displaying a false breakout, attempting to capture liquidity and subsequently consolidate at higher levels. Should the bulls successfully defend the 0.6300 – 0.6330 range, the price is positioned to maintain its upward momentum in both the short and medium term.
Key support levels: 0.6300, 0.6255
Key resistance levels: 0.6330, 0.6363
A consolidation above the 0.6300 level, followed by a sustained rise and consolidation above 0.6330, would confirm the bulls' intentions for further upward movement. However, with the NFP release and other significant economic data on the horizon, the risks are amplified, and elevated market volatility should be expected.
AUDUSD - SWING TRADE IDEA ON LONG SIDESymbol - AUDUSD
AUDUSD is currently trading at 0.6305
I'm seeing a trading opportunity on buy side.
Buying AUDUSD pair at CMP 0.6305
I will be adding more if 0.6270 - 0.6240 comes & will hold with SL 0.6215
Targets I'm expecting are 0.6360 - 0.6410 & 0.6450
Disclaimer - Do not consider this as a buy/sell recommendation. I'm sharing my analysis & my trading position. You can track it for educational purposes. Thanks!

Audusd Pullback It also means that should the US dollar continue to strengthen and the yuan weaken, AUD/USD runs the real risk of moving below 63c. The 10-day SMA is capping as resistance and makes a likely area for bears to reload, unless the Feed deliver a dovish surprise to send AUD/USD higher.

AUDUSD R:R 1:4Liquidity Sweep and CHoCH
Imbalance with FVG
Its tapped the Previous Unmitigated supply.
Its already created the EQL and TL Liquidity.
Once entered the Entry zone go with confirmation Entry with CHOCH.

AUDUSD 1D Timeframe ProjectionAUDUSD 1D Timeframe Projection.
Daily and Weekly trends are Bullish.
DISCLAIMER: All labelling and wave counts are done by me manually and I will keep changing according to the LIVE MARKET PRICE ACTION. So don't be bias, hope on my trade plans...try to learn, and make your strategy... Following is not that easy...

AUDUSD Idea H1Here is my analysis for AUDUSD on H1 using Order Block. The price could go bullish, you can put a pending order on the Order block or find an entry on LTF within OB Zone. Trade Safe!

AUDUSD in BUY ZoneAUDUSD in BUY Zone - 4 Hour Support Zone
Buy Long @ 0.63125
SL @ 0.62832
TP @ 0.64400

AUD-USD 1h trade setupAUD-USD is moving in sideways pattern in HTF where we are aiming to buy on lows and sell on highs
on 1h time frame
there are few key areas to lookout
LTF Demand Zone 0.65190 to 0.64970
LTF Supply Zone 67395 to 67140
Pullback Area 0.66030 - 0.66320
we also have bullish divergence on RSI indicator
we can use pullback area as Target 1 and LTF supply zone as Target 2
or simply use trailing stop loss based on the trading style

AUDUSD IDEA BY GFFX Trade Idea:
📍 Entry: 🎯 Target: ⛔ Stop Loss: (MARKED IN CHART)
💡 RISK REWARD 1 : 4
💰 Risk 1% of your trading capital.
⚠️ Markets can be unpredictable; research before trading.Disclaimer: This trade idea is based on Elliott Wave analysis and is for informational purposes only. Trading involves risks; seek professional advice before making any financial decisions.Informational onLY !!!!AND IF YOU HAVE doubt , WHAT STOPPING YOU TO ASK HOW ?

32,600 Jobs Added! Aussie Dollar Skyrockets!32,600 Jobs Added! Aussie Dollar Skyrockets!
The Australian dollar has surged, driven by an impressive employment report that far exceeded expectations. In the month of June, Australia's net employment rose by a staggering 32,600 compared to the previous month, surpassing estimates by more than double.
This development propelled the Aussie currency up by over 0.9%, reaching an intra-day high of $0.6834. The New Zealand dollar also rode the wave, gaining 0.57% to reach $0.6299. Both Antipodean currencies are now poised to reverse the losses incurred over four consecutive trading sessions.
The current market sentiment favors the bulls, with both short and long-term momentum in their favor. Price action is trading above the 50 and 200-day moving averages, reinforcing the positive outlook for the Australian dollar.
Elsewhere in the currency market, the sterling is doing its best to counter deep losses following a sharp fall in the previous session. The decline was prompted by Britain's inflation data, which fell short of market expectations.
The British pound managed a modest recovery, trading 0.15% higher at $1.2958 in the latest session.

AUDUSDAUDUSD is rising in an impulsive manner and is heading towards 0.70 zone. The current price action suggests that a third of a third wave is unfolding from 0.659 odd levels. Keeping SL of 0.6745 one should buy AUDUSD and look for the target of 0.700 and 0.7050 in the coming days.

AUD/USD TECHNICAL OVERVIEWAs Per Chart ,
As Per Smart Money Concept Price Has Formed Bearish pennant Pattern. So Now Watch This Currency Pair For Trading Plan And Wait For Breakout .
# Buy Only Above 0.67231 Target : 0.68044 , 068934
# Stop loss For Long Side 40 to 50 pips.
Disclaimer:- All post are only for educational purpose . Trade With Your Risk management or Consult Your Financial Advisor before trading.

Who's Right? Hawk Economists vs. Dove Traders - RBA meets Today Who's Right? Hawk Economists vs. Dove Traders - RBA meets Today
Yesterday, the AUD/USD experienced its third consecutive day of growth. However, the upward trend is expected to face obstacles during Tuesday's trading session due to the impending Reserve Bank of Australia meeting.
Despite some analysts adopting a more hawkish stance and predicting a rate hike as the most likely outcome of today's meeting, money market traders have reduced their forecast to a one-in-three chance of an increase, down from 40 percent on Friday afternoon.
Although inflation numbers in Australia have slowed down, the Consumer Price Index remains above the target range, while the key interest rate stands at 4.1 percent, below the CPI. Furthermore, recent remarks from RBA Governor Lowe have maintained a hawkish tone, leaving the possibility of further rate hikes open, even after two unexpected increases.
As US markets remain closed in observance of Independence Day, the AUD/USD has been consolidating at 0.66700 prior to the RBA decision. With conflicting views from economists and traders, the meeting's outcome has the potential to inject some volatility into the pair.
In terms of potential resistance levels, the initial zone to watch out for is around 0.66900, followed by 0.67200. However, it is important to note that considering the RSI's decline below the 60.00 level, the upward momentum has weakened. Nevertheless, the overall inclination remains biased towards the upside. Therefore, exploring higher levels may not be immediately feasible.

AUDUSD Trade Idea AUDUSD is bullish bias and in range on the H4 structure this week we will see proper breakout upside after correction
