Is Avalon Technologies Preparing for a Major Trend Continuation?The chart of Avalon Technologies is currently sitting at a very interesting location where both advanced Demand–Supply principles and traditional technical analysis are telling a powerful story.
Let’s break the entire analysis into two separate parts so traders of all styles can understand what the chart is silently revealing.
🟢 Advanced Demand & Supply Zone Analysis 🔍
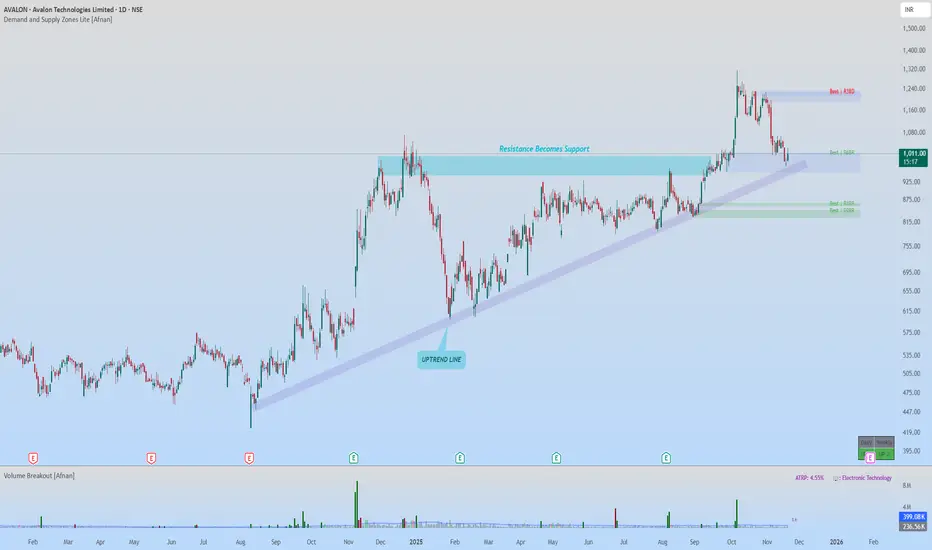
Price formed a clean Rally–Base–Rally (RBR) demand zone earlier, which later pushed the market strongly upward and even broke the all-time high, creating a new high point.
After making this new high, the stock pulled back naturally toward the same RBR demand zone — a textbook return-to-origin move.
As price reached the zone, we can clearly see a reversal candle forming right inside the demand, confirming that sellers are losing momentum and buyers are defending the zone again.
These characteristics indicate that the current decline is not a bearish fall, but simply a normal pullback within a larger uptrend, supporting the possibility of trend continuation as long as the demand zone remains intact.
📌 Curve Analysis Viewpoint
Since price rallied strongly, broke the all-time high, and has now returned to a previously created RBR demand origin:
There are no higher-timeframe supply zones above the current price structure, This positions the stock low on the curve.
Being low on the curve generally supports buying continuation trades, especially when aligned with a fresh demand zone.
📊 Traditional Technical Analysis Perspective 📈
Switching to classical TA, the chart confirms the Demand–Supply story from another angle.
📉 Trendline & Structure Analysis
The stock has respected an ascending trendline for months. Every time price approached it:
Buyers stepped in
higher lows were maintained
Trendline acted as dynamic support
Price is currently reacting near this trendline once again, suggesting structural strength.
🔄 Support Turned Resistance… Now Turned Support
A wide consolidation zone from the previous range, which acted as resistance earlier, has now flipped into support.
This phenomenon—resistance becoming support—is one of the strongest confluences in price action.
📌 Candlestick Behaviour
The rejection candles forming on the pullback indicate that:
Sellers could not maintain control
Buyers absorbed aggressive selling
Wicks show institutional order collection at lower prices
📉 Volume Confirmation
Volume shows a typical pattern seen during healthy retracements:
Strong volume on rallies
Falling volume on pullbacks
Occasional spikes confirming institutional footprints
🧩 Combined Insight From Classical TA
When a rising trendline, a former resistance-turned-support, and bullish rejection candles align together, the setup represents a high probability continuation scenario—as long as the broader trend remains intact.
🌟 Final Outlook 🌟
When evaluated independently, both Advanced Demand–Supply analysis & Traditional technical analysis reach the same conclusion:
“The stock is currently reacting from a strong area of institutional interest within an intact uptrend.”
The Price appears positioned for continuation—unless the nearest strong demand zone is cleanly violated in the future.
🔥 Trading is a journey of patience, discipline, and constant learning — every candle tells a story, keep reading the market with confidence! 🔥
Lastly, thank you for your support, your likes & comments. Feel free to ask if you have questions.
This analysis is strictly for educational purposes only . I am not a SEBI-registered analyst.
Avalon
How to Identify Right Breakout Candle ? Stocks and Price actionI make educational content videos for swing / positional trading .
In this I am sharing some information out of the vast trading knowledge I have gained through my experience in the markets .
Charts used are older than 3 months

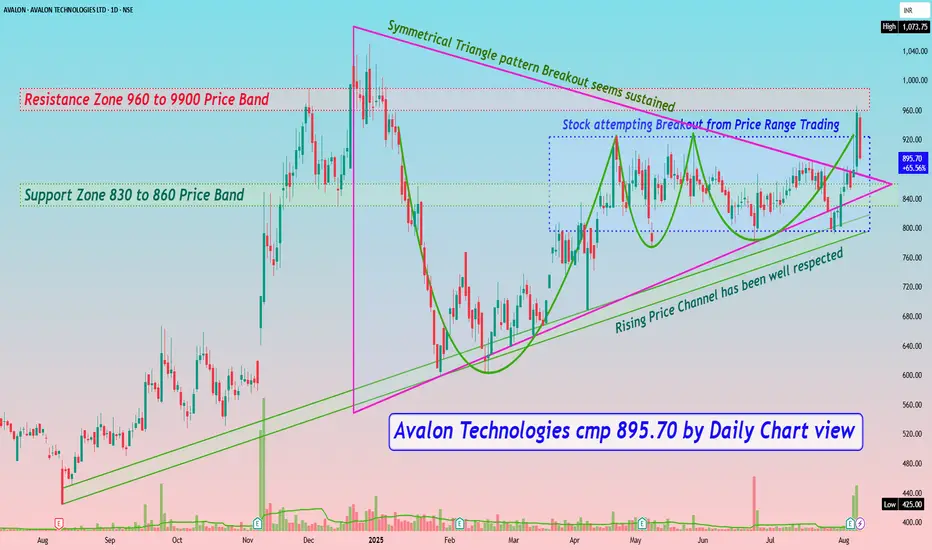
Avalon Technologies cmp 895.70 by Daily Chart viewAvalon Technologies cmp 895.70 by Daily Chart view
- Support Zone 830 to 860 Price Band
- Resistance Zone 960 to 9900 Price Band
- Rising Price Channel has been well respected
- Stock attempting Breakout from Price Range Trading
- Symmetrical Triangle pattern Breakout seems sustained
- Repeated Bullish Rounding Bottoms under Resistance Zone neckline
- Volumes spiked heavily at end of week and above average traded quantity
- Positively trending Technical Indicators BB, EMA, MACD, RSI,SAR, SuperTrend
Avalon Tech cmp 595 by Weekly Chart views since listed*Avalon Tech cmp 595 by Weekly Chart views since listed*
- 608 to 622 Resistance Zone Price band
- Weekly basis Support at 534 > 475 > 405 with Resistance at 622 > 683 > ATH 732.10
- *Bullish Rounding Bottom competed with the neckline at the Resistance Zone price band*
- *Price sustaining well above Falling Resistance Trendline supported by bullish momentum of increasing Volumes over the past few weeks*

AVALON - Horizontal Range Breakout🔊 AVALON - Horizontal Range Breakout
⌛Duration - Short Term (2 month to 4 month)
📊📈 Trade Logic - Horizontal Range Breakout
CMP - ₹587
Time Frame - Weekly
🎯Target 1 : ₹650
🎯Target 2 : ₹700
🎯Target 3 : ₹750
🛑 Stop : ₹525
🏆 Risk/Reward Ratio (1: 2.3)
Disclaimer: The stock information shared above is not a recommendation to buy, sell, or hold. It reflects my own analysis and is intended solely for educational purposes. Any actions you take based on this information are your responsibility, and the admin of this channel is not liable for any financial gains or losses. Please consult a financial advisor before making any investment decisions. I am not a SEBI-registered advisor.

AVALON - Ichimoku Breakout📈 Stock Name - Avalon Technologies Ltd
🌐 Ichimoku Cloud Setup:
1️⃣ Today's close is above the Conversion Line.
2️⃣ Future Kumo is Turning Bullish.
3️⃣ Chikou span is slanting upwards.
All these parameters are shouting BULLISH at the Current Market Price and even more bullishness anticipated AFTER crossing 591.
🚨Disclaimer: This is not a Buy or Sell recommendation. It's for educational purposes and a guiding light to learn trading in the market.
#CloudTrading
#IchimokuCloud
#IchimokuFollowers
#Ichimokuexpert
Excited about this analysis? Share your thoughts in the comments below!
👍 Like, Share, and Subscribe for daily market insights! 🚀
#StockAnalysis #MarketWatch #TradingEducation #ichimoku #midcap #smallcap #largecap #AVALON

Avalon Tech: is it Time to Buy this EMS player?NSE:AVALON is attempting to give a breakout and one can buy this counter with a stop loss at 470 for targets till 715. Post 715, that will become the stop loss and one can trail it accordingly. Company is an EMS player and boasts of a fundamentally strong business. EMS companies have low margins but the growth is being driven primarily by volume (demand).

AVALON TECHNOLOGIES LTDAvalon Technologies Limited is an electronic manufacturing services (EMS) company that is into PCB design and assembly, cable assembly and wire harnesses, sheet metal fabrication and machining, and end-to-end box build of electronic systems.
Note:
1. Views are personal and for educational purposes only. Recheck and take the trade as per your RR.
2. Always remember SL is your lifeline, not the big target...
3. Follow us for more patterns and like, share so that we feel it is helpful to many and share more patterns...
3. Views given here is not a tip rather it is for educational purpose... Aftermarket opens, the condition might change so learn to handle different conditions...
Keep an eye ladies and gentlemen. Cheers and Happy Trading

AVALON - Ichimoku BreakoutIchimoku Cloud Setup :
1). Today's close is above the Conversion Line
2). Future Kumo is Turning Bullish
3). Chikou span is slanting upwards
All these parameters are showing bullishness at Current Market Price
and more bullishness AFTER crossing 545
#This is not Buy and Sell recommendation to any one. This is for education purpose and a helping hand to learn trading in Market.
# Cloud Trading
# Ichimoku Cloud
# Ichimoku Followers
I hope you all like my analysis.
Please do share your thoughts into comment section.
Please give a like, share & subscribe for daily analysis.

