BUY TODAY SELL TOMORROW for 5%DON’T HAVE TIME TO MANAGE YOUR TRADES?
- Take BTST trades at 3:25 pm every day
- Try to exit by taking 4-7% profit of each trade
- SL can also be maintained as closing below the low of the breakout candle
Now, why do I prefer BTST over swing trades? The primary reason is that I have observed that 90% of the stocks give most of the movement in just 1-2 days and the rest of the time they either consolidate or fall
Trendline Breakout in AVANTIFEED
BUY TODAY SELL TOMORROW for 5%
AVANTIFEED

AVANTIFEED: Breaking out of Sym. Triangle, Chart of the WeekNSE:AVANTIFEED Breaking the Triangle: How Avanti Feeds is Positioned to Ride the Shrimp Export Wave Despite US Tariff Headwinds after Posting Strong Q2 FY26 Numbers. Lets Analyse in Chart of the Week.
As per the Latest SEBI Mandate, this isn't a Trading/Investment RECOMMENDATION nor for Educational Purposes; it is just for Informational purposes only. The chart data used is 3 Months old, as Showing Live Chart Data is not allowed according to the New SEBI Mandate.
Disclaimer: "I am not a SEBI REGISTERED RESEARCH ANALYST AND INVESTMENT ADVISER."
This analysis is intended solely for informational purposes and should not be interpreted as financial advice. It is advisable to consult a qualified financial advisor or conduct thorough research before making investment decisions.
Price Action Analysis:
Historical Price Journey:
- 2021-2022: Strong rally from 360 levels to 750 zone
- 2023: Consolidation and correction to 350-400 range
- 2024: Strong recovery rally pushing to new all-time highs near 964.20
- 2025: Symmetrical triangle consolidation followed by recent breakout
Current Price Behavior:
- Recent breakout candle shows strong buying with minimal upper wick
- Trading at 861.20 with +14.51% gain indicates momentum strength
- Price approaching previous resistance zones that could act as supply
Volume Spread Analysis:
Volume Characteristics:
- Recent breakout accompanied by 9x surge in volumes (19.86M vs average)
- Volume expansion during rally phases from 2023-2024 shows institutional accumulation
- Volume spikes at key support levels during consolidation indicate buying interest
- Current volume profile suggests smart money participation
Volume-Price Correlation:
- Strong positive correlation during uptrends (2023-2024 rally)
- Declining volume during consolidation phase typical of healthy correction
- Recent volume breakout confirms bullish sentiment reversal
Symmetrical Triangle Formation (2024-2025):
- The stock has been consolidating in a clear symmetrical triangle pattern since reaching its 52 Week high of 964.20 in early 2025
- Lower highs connecting from 964.20 level and higher lows forming from 630.00 support zone
- Triangle apex converging near current price levels, indicating an imminent breakout
- Pattern duration: approximately 12 months, suggesting significance of upcoming move
- Recent price action shows a breakout attempt with strong volume support
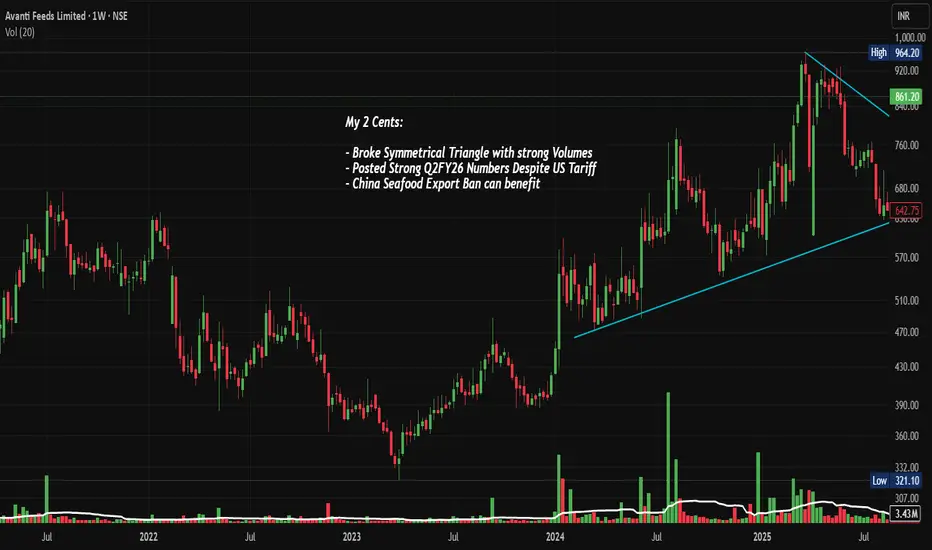
Broke Symmetrical Triangle with Strong Volumes:
- Current price at 861.20 (as of November 21, 2025) shows +14.51% gain with volume surge to 3.9M shares
- Volume expansion at 19.86M significantly exceeds average, validating breakout
- The breakout has occurred with conviction, supported by high trading activity
Key Technical Levels:
Support Zones:
- Primary Support: 680.00 - 700.00 (recent consolidation base)
- Secondary Support: 630.00 (lower triangle trendline)
- Critical Support: 570.00 (psychological and structural level)
- Ultimate Support: 470.00-510.00 (2024 demand zone)
Resistance Levels:
- Immediate Resistance: 860.00 (swing high zone)
- Major Resistance: 920.00 - 964.20 (all-time high region)
- If ATH breaks, next targets: 1,000.00 and 1,100.00
Base Formation:
- A strong base has been established between 630.00 to 760.00 through 2025
- Multiple retests of lower support levels throughout the year have strengthened the base
- Base duration of 10-12 months provides solid foundation for next leg up
Trend Analysis:
Long-term Trend (Weekly/Monthly):
- Primary uptrend intact despite year-long consolidation
- Price remains well above rising 200-week moving average
- Higher lows pattern from 2022 onwards indicates bullish structure
Medium-term Trend (Daily):
- Breaking out of consolidation range with strong momentum
- Upper triangle trendline resistance conquered
- Price action suggesting potential trend reversal from sideways to bullish
Short-term Momentum:
- Sharp upward move with strong candles indicating buying pressure
- Current momentum favors bulls with potential for continuation
Fundamental & Sectoral Backdrop:
Company Overview & Business Segments:
Core Business Operations:
- India's leading shrimp feed manufacturer with integrated operations
- Two primary divisions: Shrimp Feed Division and Shrimp Processing & Export Division
- Market capitalization: Rs 9,633 crores (approximately $1.15 billion)
- Strategic partnership with Thai Union Group (Thailand) - minority stake holder
Production Capacity & Scale:
- Annual shrimp feed manufacturing capacity: 775,000 metric tons (largest in India)
- Shrimp processing capacity: Producing 28,000 metric tons annually
- Multiple manufacturing facilities across coastal states
- Hatchery division with capacity of 600 million post-larvae
Recent Financial Performance:
Q2 FY26 Results (Quarter Ended September 2025):
- Consolidated Net Profit: Rs 153.29 crores (up 34.88% YoY, down 14.02% QoQ)
- Net Sales: Rs 1,609.69 crores (up 18.79% YoY, flat 0.21% QoQ)
- Operating Performance shows mixed signals with YoY growth but QoQ softness
- EPS: Rs 11.25 (vs Rs 8.34 in Q2 FY25)
H1 FY26 Performance (Six Months Ended September 2025):
- Total Income: Rs 3,316.11 crores (up 13.11% YoY)
- Net Profit: Rs 331.57 crores (up 37.09% YoY)
- EPS: Rs 24.34 (vs Rs 17.75 in H1 FY25)
- Strong first-half performance despite challenging conditions
Segment Performance Highlights:
- Shrimp Feed Division: Facing margin pressure from rising raw material costs (fishmeal, soybean meal)
- Shrimp Processing Division: 62% YoY growth in gross income for Q2 FY26, driven by diversification and favorable forex rates
- Profit Before Tax (PBT): Rs 227 crores in Q2, down 8.83% QoQ indicating margin compression
Key Financial Metrics & Valuation:
Profitability Ratios:
- Return on Equity (ROE): 18.88% - well above industry average
- Return on Capital Employed (ROCE): 65.44% - exceptional capital efficiency
- Operating Margin: Declining by 126 basis points QoQ in Q2 FY26
- Net Profit Margin: 10.5% (Q2 FY26)
Balance Sheet Strength:
- Debt-to-Equity Ratio: Negative -0.69 (debt-free, net cash position)
- Fortress balance sheet with zero debt burden
- Strong working capital position despite rising debtor turnover pressures
Valuation Metrics:
- Current P/E Ratio: 19x
- Price-to-Book Value: 3.90x (reasonable given high ROE)
- Dividend Yield: 1.05%
- Latest Dividend: Rs 9.00 per share (August 2025), payout ratio of 23.19%
Quality Indicators:
- Consistent dividend payer with conservative payout ratios
- High ROCE indicates superior capital allocation
- Zero leverage provides financial flexibility and risk cushion
Sectoral Landscape - Indian Aquaculture & Shrimp Industry:
Market Size & Growth Trajectory:
- Indian Shrimp Market: Valued at $9.2 billion in 2024, projected to reach $22.7 billion by 2033 (CAGR: 10.1%)
- Indian Shrimp Feed Market: $2.0 billion in 2024, expected to grow to $7.4 billion by 2033 (CAGR: 15.7%)
- India Aquafeed Market: $3.51 billion in 2024, projected at $6.40 billion by 2032 (CAGR: 7.8%)
- India ranks as second-largest shrimp producer and exporter globally after Ecuador
Production & Export Statistics:
- FY24 Seafood Exports: Rs 60,523.89 crores (1.78 million metric tons), up 2.67% in volume
- Frozen shrimp accounts for 66.12% of export earnings and 40.19% of export volume
- India shipped seafood worth approximately $7.4 billion last fiscal year
- Production volumes show resilience despite global headwinds
Key Export Markets (Traditional):
- United States: Largest market, historically accounting for 40-50% of exports
- China: Second-largest market with 451,000 MT ($1.38 billion)
- Japan: Third major destination
- Other significant markets: Vietnam, Thailand, EU (Belgium, Spain), Canada, UAE, Italy
Domestic Market Dynamics:
- 72.1% of Indian population (967 million individuals) include fish in their diet
- Growing domestic consumption driven by health awareness and rising incomes
- Shift toward value-added products (ready-to-cook, processed seafood)
Major Industry Challenges & Headwinds:
US Tariff Crisis:
- August 27, 2025: US imposed 50% reciprocal tariff on Indian shrimp imports (25% base + 25% penalty)
- Combined with existing duties: Anti-dumping (3.96%), Countervailing duty (5.77%)
- Total effective duty burden: 58.26% on Indian shrimp exports to US
- August 2025 impact: Indian shrimp exports to US collapsed 43% YoY to 16,495 MT
- Total Indian export volumes fell 9% YoY in August 2025
Cost Pressures:
- Rising raw material costs for feed production (fishmeal, soybean meal)
- Increasing labor and energy costs impacting margins
- Competition from Ecuador in US market, especially in headless shell-on segment
- Global oversupply situation causing price depression
Disease & Environmental Risks:
- Disease outbreaks remain persistent risk in aquaculture
- Climate change and water quality challenges
- Regulatory compliance and sustainability certification requirements
Emerging Opportunities & Positive Catalysts:
Posted Strong Q2FY26 Numbers Despite US Tariff:
- Despite 50% US tariff headwinds, company posted 34.88% YoY profit growth
- Revenue growth of 18.79% YoY demonstrates resilience
- Shrimp processing division grew 62% YoY, offsetting feed segment pressures
- Management successfully diversifying away from US market dependence
China Seafood Export Ban Can Benefit Indian Exporters:
- China banned all Japanese seafood imports (November 2025) amid diplomatic tensions
- This creates substantial market opportunity for Indian seafood exporters
- Indian companies can fill supply gap in massive Chinese market
- China already importing 12,190 MT from India in August 2025, up 33% YoY
- Market diversification reducing US dependency from 48% toward 30-35%
Government Support & Policy Initiatives:
- Union Budget 2025: Proposed 5% Basic Customs Duty on key feed production inputs (down from higher rates)
- Rs 4.5 lakh crore support package for export sectors including seafood
- Pradhan Mantri Matsya Sampada Yojana (PMMSY): Rs 2,352 crores allocated (56% increase)
- Department of Fisheries budget: Rs 2,616.44 crores (54% increase YoY)
- Government targeting $14 billion+ seafood exports by 2025
- Fishery Infrastructure Development Fund (FIDF) for modernization
Market Diversification Strategy:
- Companies actively expanding presence in EU, Middle East, Southeast Asia, Japan, South Korea
- Vietnam, Thailand, Canada becoming key alternative markets
- Development of value-added products commanding higher margins
- China emerging as third-largest market for Indian shrimp after US and Europe
Technology & Innovation Adoption:
- Advanced breeding techniques producing disease-resistant varieties
- Biofloc technology and Recirculating Aquaculture Systems (RAS) improving efficiency
- Precision feeding technologies enhancing feed conversion ratios
- Integration of probiotics and functional ingredients in feed formulations
- Cold chain infrastructure growing 15-30% annually
Product Portfolio Expansion:
- Avanti Feeds launched new pet food products receiving positive market acceptance
- Shift toward value-added products: cooked, breaded, marinated offerings
- Value-added exports up 27% year-to-date despite overall volume pressure
- Premium products targeting European and Asian markets
Structural Competitive Advantages:
- Zero-debt balance sheet provides flexibility during market disruptions
- Highest feed manufacturing capacity (775,000 MT) among Indian players
- Integrated operations from hatchery to processing create vertical synergies
- Strong R&D capabilities and partnerships (Thai Union Group)
- Established distribution networks and brand recognition
Ecuador Supply Disruptions:
- Ecuador facing energy rationing issues disrupting shrimp production
- May redirect global buyers toward Indian suppliers
- Potential to strengthen pricing power and market share gains
- Ecuador's challenges provide tactical advantage for Indian exporters
Sustainability Certifications & Premium Markets:
- Growing demand for certified sustainable seafood (BAP, ASC standards)
- Indian producers investing in traceability and quality systems
- Access to premium European markets requiring strict compliance
- Competitive advantage in environmentally-conscious consumer segments
Competitive Positioning:
Market Leadership:
- Avanti Feeds ranked #1 in Indian shrimp sector by production and revenue
- Feed manufacturing: 775,000 MT capacity (largest)
- Shrimp production: 28,000 MT annually
- Revenue: EUR 615 million (Rs 5,500+ crores) for FY 2022-23
Key Competitors:
- Devi Sea Foods: #2 ranked, EUR 391 million revenue, 52,000 MT shrimp production, 300,000 MT feed capacity
- Waterbase Limited: Major player with diversified operations
- Coastal Corporation: Expanding China presence, up 5% recently on China opportunity
- Apex Frozen Foods: Strong Q2 with positive earnings surprise
Industry Consolidation Trends:
- Top 19 players dominating production and processing
- Increasing entry of multinational companies through JVs
- Consolidation driven by scale requirements and technology investments
Risk Factors & Concerns:
Short-term Challenges:
- US tariff situation remains fluid; potential for escalation to full 50% or negotiation down to 15%
- Sequential margin compression (Q2 vs Q1) indicates near-term profitability pressure
- Raw material cost inflation continuing into FY26
- Working capital pressures with rising debtor turnover ratio
Medium-term Uncertainties:
- Global shrimp prices at lowest inflation-adjusted levels since 2020
- Industry growth stagnation: India's peak exports in 2021 (704,160 MT) not yet regained
- Competitive intensity from Ecuador, Vietnam, Thailand, Indonesia
- EU and other markets may also impose trade restrictions
Operational Risks:
- Disease outbreaks can rapidly impact production
- Water quality and environmental compliance requirements
- Climate-related risks (extreme weather, temperature variations)
- Forex volatility impacting export realizations
Strategic Concerns:
- Slower than expected market diversification progress
- Dependence on commodity shrimp prices
- Shift to Black Tiger (Monodon) from Vannamei faces adoption challenges
- Pet food venture in highly competitive market against established players like Mars
Bull Case Scenario:
Technical Setup:
- Clean breakout from year-long symmetrical triangle with high volume
- If momentum sustains, targets of 860, 920, and new highs above 1,000 are achievable
- Strong base formation provides downside support
Fundamental Strengths:
- China-Japan seafood ban creates immediate export opportunity
- Government support package and duty cuts improve cost structure
- Debt-free balance sheet provides safety margin
- Exceptional ROCE (65.44%) and ROE (18.88%) demonstrate operational excellence
- Valuation attractive at 16.26x P/E with 9.7% discount to industry
Growth Drivers:
- Shrimp feed market growing at 15.7% CAGR through 2033
- Market diversification reducing US exposure from 48% to 30-35%
- Value-added product strategy improving margins
- Capacity leadership position (775,000 MT feed) creates moat
Bear Case Scenario:
Technical Risks:
- Failure to hold above 700 support could trigger return to triangle
- Overhead resistance at 860-920 zone may cap upside
- Volume sustainability crucial; fading volumes could signal false breakout
Fundamental Concerns:
- Sequential profit decline (Q2 vs Q1) signals margin pressure
- US tariffs may worsen if no trade deal materialized
- Global shrimp prices at multi-year lows (inflation-adjusted)
- Raw material cost inflation squeezing feed margins
- Industry growth stagnation since 2021 peak
Structural Headwinds:
- Mature business with 5-year sales CAGR of only 7.5%
- Intense competition from Ecuador in key US market
- Working capital pressures building (deteriorating debtor turnover)
Key Monitorables:
Quarterly Metrics:
- Feed sales volumes and pricing trends
- Shrimp processing margins and export realizations
- Geographic revenue mix (US vs other markets)
- Raw material cost trends (fishmeal, soybean meal)
Market Developments:
- Progress on US-India trade negotiations (tariff reduction to 15%?)
- China market penetration success metrics
- Ecuador supply situation and competitive dynamics
- Government policy implementation and subsidy flows
Technical Levels:
- Sustenance above 700 crucial for bullish structure
- Volume patterns on approach to 860-920 resistance
- Any breakdown below 630 would be major warning sign
My 2 Cents:
The technical breakout from the symmetrical triangle, combined with the China-Japan seafood ban opportunity, creates an interesting risk-reward setup. The company has demonstrated resilience by posting strong YoY numbers despite the US tariff shock. However, the sequential margin compression and global shrimp price weakness remain concerns.
The debt-free balance sheet and exceptional capital efficiency metrics (65% ROCE) provide a strong safety cushion. Market diversification efforts are progressing, though slower than ideal. The 15.7% CAGR expected in the shrimp feed market through 2033 provides secular tailwinds.
From a technical perspective, the stock needs to sustain above 700 and break through 860 with volume to confirm the bullish breakout. The year-long consolidation provides a solid base, but overhead supply at 860-920 could test conviction.
So Avanti Feeds presents a compelling case of a fundamentally strong company navigating through short-term headwinds while benefiting from emerging opportunities. The technical breakout aligns with positive fundamental catalysts (China ban on Japan, government support), though execution challenges and margin pressures remain. The company's market leadership, zero-debt status, and superior returns metrics make it a quality play on India's growing aquaculture story.
Investors should monitor the sustainability of the technical breakout, progress on market diversification, and margin trajectory in coming quarters. The current setup offers an asymmetric opportunity with defined risk.
Full Coverage on my Newsletter this Week
Keep in the Watchlist and DOYR.
NO RECO. For Buy/Sell.
📌Thank you for exploring my idea! I hope you found it valuable.
🙏FOLLOW for more
👍BOOST if you found it useful.
✍️COMMENT below with your views.
Meanwhile, check out my other stock ideas on the right side until this trade is activated. I would love your feedback.
As per the Latest SEBI Mandate, this isn't a Trading/Investment RECOMMENDATION nor for Educational Purposes; it is just for Informational purposes only. The chart data used is 3 Months old, as Showing Live Chart Data is not allowed according to the New SEBI Mandate.
Disclaimer: "I am not a SEBI REGISTERED RESEARCH ANALYST AND INVESTMENT ADVISER."
This analysis is intended solely for informational purposes and should not be interpreted as financial advice. It is advisable to consult a qualified financial advisor or conduct thorough research before making investment decisions.
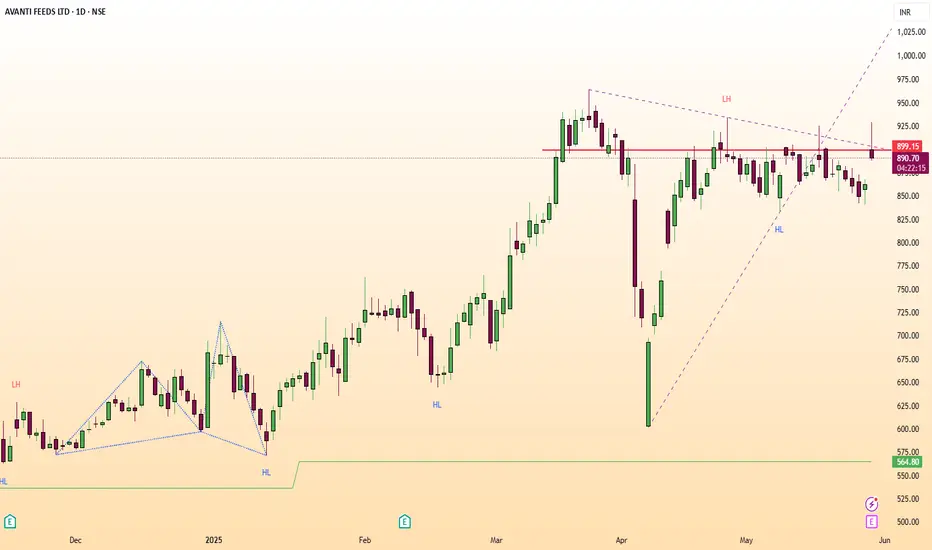
AVANTIFEED Breakout StockGood Above 900 on Closing Basis.
For Educational Purpose only.
Rationale:-
Volume:
Volume is greater than previous session by 848.49%.
Volume is greater than last 10 sessions average volume.
Volume is greater than last 10 sessions volume. That is a high volume.
Highest volume marked in last 20 sessions. That is a volume spurt.
Volatility:
ATR% of the stock is 3.96%
Average of last 20-day is 4.33%
Moving Average Observations:
Price remains above 200-day Moving average.
Price went above 50-day Moving average in the current session, it is a bullish crossover.
Price above 50-day, 100-day and 200-day Moving average.
Moving average alignment is bullish. It is an uptrend & a bullish setup.
RSI Observations:
The Daily RSI indicator has crossed above 50 in the current session. Current Daily RSI reading is 56.32.
The Weekly RSI indicator has remained above 50. This is a bullish zone. Current Weekly RSI reading is 60.34.
The Monthly RSI indicator has remained above 70. Current Monthly RSI reading is 72.59.
ADX Observations:
The Daily DMI position turned bullish. Its a bullish crossover.
The Daily ADX went up by 4.34%. Current ADX reading is 10.76.
The Daily distance between DMI lines is 28.43%.
The Weekly DMI position remains bullish.
The Monthly DMI position remains bullish.
Donchian Channel Observations:
Price is above middle Donchian channel (Bullish).
Price is at Upper Donchian channel band.
Upper band is rising. 20-day new high marked.
Difference between bands is 11.53%.
Ichimoku Observations:
Price above Ichimoku clouds.
Clouds are bullish.
Tenkan line went above Kinjun line in current session. Bullish crossover.
Tenkan line is above Kijun line. Ichimoku setup is bullish.
Current cloud range is 1.25% and Future cloud range is 11.34%.
Bollinger Band Observations:
Price is above middle Bollinger band (Bullish).
Price is above Upper Bollinger band.
Bands are expanding.
Difference between bands is 6.05%.
AVANTIFEED : 7 Year old BreakoutAvanti Feeds is showing a 2018 year breakout in this so called Bear Market.. with a good amount of Volume... Fundamentally good company...
All data is available in public domain..
CMP : 780
TG : 1270
SL : 8 to 10% from breakout
Stock's selection based on 5 Point Analysis:
1: Idea : Breakout.
2: Support : Volume, Delivery .
3: Technical : 21/55/200-EMA, Super trend up, RS>0 RSI.
4: Fundamental : PE, PAT, Industry & peer PE and sector performance.
5: Timing : Entry Timing on Daily chart.
Disclaimer : It is my personal view as a trader and for educational purpose only. Equity market involves risk .
Please consult your financial adviser before taking any decision.

Avanti Feeds Showing Strength.NSE:AVANTIFEED today Crossed above Major Key Levels and Respecting 200 DEMA in this Weak Market and Currently Closed above 10 DSMA with Huge Volumes and RSI and MACD Showing Strength.
A move up to R1 and ATH Looks Possible Positionally until S1 and 200 DEMA is Protected.
NSE:AVANTIFEED manufactures and sells shrimp feed, and exports processed shrimp also it is the largest producer of shrimp feed in India with a market share of ~45% in the domestic feed business.
📌Thank you for exploring my idea! I hope you found it valuable.
🙏FLLOW for more
👍BOOST if useful
✍️COMMENT Below your views.
Meanwhile, check out my other stock ideas below until this trade is activated. I would love your feedback.
Disclaimer: This analysis is intended solely for informational and educational purposes and should not be interpreted as financial advice. It is advisable to consult a qualified financial advisor or conduct thorough research before making investment decisions.

Avanti Feeds NSE (Mid to Long Term)Date- 15 March 2024
Time - 10 Am
Points to be Noted-
1. As we can see, Avanti Feeds breakout from its long-term triangle formation with Inverted Head & Shoulder Chart Pattern with strong Volume Green Candle.
2. As supporting indicator MACD is showing Seller Exhaustion with decent bullish movement so far.
3. I know we are little late but one more concept call, Poisitve Order Block with FVG (Fair Value Gap) is also applied now for more bullish confirmation.
Approx Targets we can see in Chart as per previous resistances and +order block.
Close this trade if Price move down and close below 420 on a weekly candle.
Thank You!

AVANTI FEEDSI like the Pattern that is being created.
Currently taking support and making Higher Lows.
Political scenario also seems to be favorable.

AVANTI FEED Swing Long Setup - Avanti Feed is currently trading at 684
- Avanti feed recently made a high where we saw it moving up impulsively and it continued to rally for weeks
- Post the rally we saw prices taking healthy retracements and it's trying to form a small base now
- If you look at this small range a lot of scalpers might have got trapped with the wick shown as Sell Side Liquidity or if you look at the basic support which a lot of retailers consider
- Before looking for swings and positional plays make sure that you wait for the base to mature first and then take entries as of now try to learn and understand the price delivery
- I will post another update once I see this ready for an upside if it does before that I will scout another stock, till then trade safe manage risk and stay tuned

AVANTI FEEDS - A Hidden Multibagger!Overview & Observation:
1. Trendline break.
2. Change in price structure.
3. Prices are reversing with double bottom formation and breakouts are sustaining.
4. Buyers have started dominating
5. Good volume support is also present.
6. Momentum will be slow since multiple hurdles are present!
Trade Plan
Entry = CMP
SL = 10%
TP = Minimum double and more based on trailing and holding capacity.
-Stay tuned for further insights, updates and trade safely!
- If you liked the analysis, don't forget to leave a comment and boost the post. Happy trading!
Disclaimer: This is NOT a buy/sell recommendation. This post is meant for learning purposes only. Please, do your due diligence before investing.
Thanks & Regards,
Anubrata Ray

AVANTIFEED: Ready to FEED!!AVANTIFEED is in a Flag pattern and expected to breakout soon with great volumes. Keep this on radar and can give handsome returns in coming weeks.
Targets are marked on the trendlines.
NOTE: I'm not a SEBI REG. Study before investing.

good positional entry setup avantifeed...good swing may happen1) breakout from a long base then VCP pattern seen
2) respecting previous support area as box marked
3) previous long base and in this VCP seen strong evidence of institutional accumulation/large operator may be (waycoff principle)
4) 4 marked risk managed system with trailing and pyramiding...only full exit made if some unusal happen
5) will comment in future if going according to plan

BTSTshort term trendline break and get support on previos sup line,double bottomseen,may go for a btst

Avanti Feeds Ltd | Momentum pattern BOAvanti Feeds Ltd | Momentum pattern BO
Avanti Feeds is a leading provider of high quality shrimp feed, best technical support to the farmer and caters to the quality standards of global shrimp customers
Financial :strong
Market Cap = 7,554 Cr. ROCE =18.3 % ROE = 13.4 %
Debt to equity = 0.00 Promoter holding = 43.3 %
Quick ratio = 3.84 Current ratio = 5.52 Piotroski score =8.00
Profit Var 3Yrs = -7.62 % Sales growth 3Years = 7.32 % Return on assets = 11.4 %
this is pure symmetrical triangle pattern break out with large volume.
as well as RSI also shows in full momentum zone .
you should watch this stock for long term.
Note: I am not SEBI registered financial Adviser. I solely present my views on chart .I do not charge any kind of service. This is not buy sell recommendation.
If you like my ideas than like boost and follow me for more ideas.
Thanks and comment freely

Largest Producer of Shrimp feed Stock has given breakoutHello Guy's i hope you all will be doing good in your life and your trading as well, i have brought another stock which has given breakout of triangle pattern and price is sustaining above the breakout zone, stock has given huge volume spike while breakout, it means there is higher probability for upside from here, short term to long term bet can be bet from here. Stock was consolidating in Triangle pattern from long time, finally it has given breakout with huge volume.
Technicals:- MACD AND RSI is showing bullish crossover (I have not put indicators here, but i have done analysis on that)
Price is above 200-DEMA in all major timeframes.
Good spike in volume supporting the breakout
Market Cap
₹ 8,385 Cr.
Current Price
₹ 615
High / Low
₹ 647 / 377
Stock P/E
23.5
Book Value
₹ 174
Dividend Yield
1.02 %
ROCE
21.2 %
ROE
16.0 %
Face Value
₹ 1.00
Industry PE
33.8
Debt
₹ 16.5 Cr.
EPS
₹ 26.2
Promoter holding
43.2 %
Intrinsic Value
₹ 326
Pledged percentage
0.00 %
EVEBITDA
12.9
Change in Prom Hold
-0.03 %
Profit Var 5Yrs
6.55 %
Sales growth 5Years
9.01 %
Return over 5years
11.3 %
Debt to equity
0.01
Net profit
₹ 394 Cr.
ROE 5Yr
16.8 %
Profit growth
33.2 %
Disclaimer:- Please always do your own analysis or consult with your financial advisor before taking any kind of trades.
Dear traders, If you like my work then do not forget to hit like and follow me, and guy's let me know what do you think about this idea in comment box, i would be love to reply all of you guy's.
Thankyou.

Avanti Feeds move after breakout and long consolidation Avanti Feed has been forming the triangle pattern and gave the breakout move in Jan 24 after crossing the levels of 470. Since then it has been in the consolidation phase after its retracement and shows good signs of up move.
With the current momentum I am expecting it close to double. My levels to watch are 668-748-833 and can give even more based on market conditions. Base levels of 435.
No recommendations, just my view based on chart pattern.

AVANTI FEEDS - Swing Trade Analysis - 7th June #stocksAVANTI FEEDS (1D TF) - Swing Trade Analysis given on 7th June, 2024
Pattern: RECTANGLE BOX
- Volume Buildup at Resistance - Done ✓
- Resistance Breakout - In Progress
- Demand Zone Retest & Consolidation - In Progress
Please ensure that the pullback to the demand zone gives a nice small SL for a better RR
* Disclaimer

Avanti Feed is ready Blast Hey Family, there is a one more stock Which is showing a great opportunity.
Key Points:-
* Forming Rectangular Pattern in daily & Weekly TF.
* From Jan 2024 to June 2024 Tested Resistance Many times.
* It's Near resistance Zone and trying to breakout.
* Rise in Volume.
* If Stock break's resistance zone then we can see a move to 670 and if sustain above 670 then we can see a good move, let's see breakout sustain or not.
What is your view please comment it down and also boost the idea this help to motivate us. We are Certified. All views shared on this channel are my personal opinion and is shared for educational purpose and should not be considered advise of any nature. Don't know how we miss this amazing stock and forget to share this with you all family.

AVANTIFEEDS | SWING BUYThings to Note:
1) Stock is trading inside a parallel channel with good volumes.
2) Can expect a breakout soon, one can take trade once it breaks out of the channel and keep a close above the channel in daily time frame and should break with good volumes
Educational Purpose!

AVANTIFEEDHi Stock in connsolidating from a long time, forming a trianlge type strucuture
we can see a consolidation on a breakout of a trendline, we cann se a good move till 680
Kindly mange your risk and reward
Thanks

AVANTI FEED - SWINGMy Fav pattern IHnS and a good variant.
Long Consolidation.
Signs of Strength.
#FDTRADE

AVANTIFEED review --- 598 from 420, 42% gains in 5 monthsNSE:AVANTIFEED
cmp 561
posted on August 24, 2024, when the price was at 420 with a 30%–40% gain goal in mind.
The 1st target is achieved
The updated target is now 700. So let's capitalize on this trend and see how much more we can profit from
The objective of this analysis is knowledge sharing and education. There isn't any buy or sell advise in this article. Every stock is held for a short to medium amount of time and is positional.
It is expected of each person to carry out independent research and evaluation to ascertain whether my perspective is consistent with your studies.

Avanti Feeds BreakoutNSE:AVANTIFEED has given a strong breakout on monthly charts. The stock has come out of a very long consolidation. Keep a stop loss at 500 and expect targets of 880. Go long.

Avanti Feeds Above trendline Bullish..🚀Avanti Feeds is a leading provider of high quality shrimp feed, best technical support to the farmer and caters to the quality standards of global shrimp customers.
Good financial....
