DMART - What can you possibly expect next......💹 Avenue Supermarts Ltd (DMart)
Context: Q3 FY26 Results vs Market Expectations
Chart View: Daily
Market Context: When Good Results Are Not Enough
DMart reported growth in both revenue and profit in its latest quarterly results. The company continues to add stores, customer demand remains steady, and the business model is stable. There was no major negative surprise in the results, and the long-term business story remains intact.
However, the stock market does not react only to whether results are good or bad. It reacts to whether results are better or worse than what the market was expecting. Before the results, many participants were expecting faster sales growth, better margin improvement, and clearer signs of stronger earnings momentum.
The reported numbers, although positive, did not go much beyond these expectations. Because of this, the stock price did not show a strong positive reaction. When a stock is already trading at higher valuations, the market looks for improvement, not just stability.
This difference between expectations and actual results explains the price behaviour. When expectations are high and results only meet them, prices often move sideways or see short-term selling. This does not mean the business is weak — it simply means the market is adjusting its expectations.
From a chart point of view, the stock is facing selling pressure near earlier price levels. Buying interest is limited for now, and price action suggests the stock is taking time to absorb the results rather than moving in a clear direction.
While DMart continues to report double-digit growth, the market is becoming cautious about the pace of that growth. Revenue growth in the latest quarter was lower than the company’s longer-term average and also slower than the rate at which new stores are being added. This suggests pressure on same-store sales. In addition, margins are facing challenges due to intense competition, price cuts in daily-use products, and changes in GST rates. These factors explain why the stock price has remained under pressure despite healthy headline numbers.
The key learning for beginners is simple: stocks do not always go up after good results. Sometimes prices move sideways to allow expectations to cool down. Patience and understanding the bigger picture are more important than reacting emotionally to quarterly numbers.
⚠️ Disclosure & Disclaimer
This post is shared only for educational and informational purposes. It is not investment advice or a recommendation. Stock market investments involve risk. Please consult a SEBI-registered financial advisor before making any investment or trading decisions.
🚀 Stay Calm. Stay Clean. Trade With Patience. Trade Smart | Learn Zones | Be Self-Reliant
Avenuesupermarts

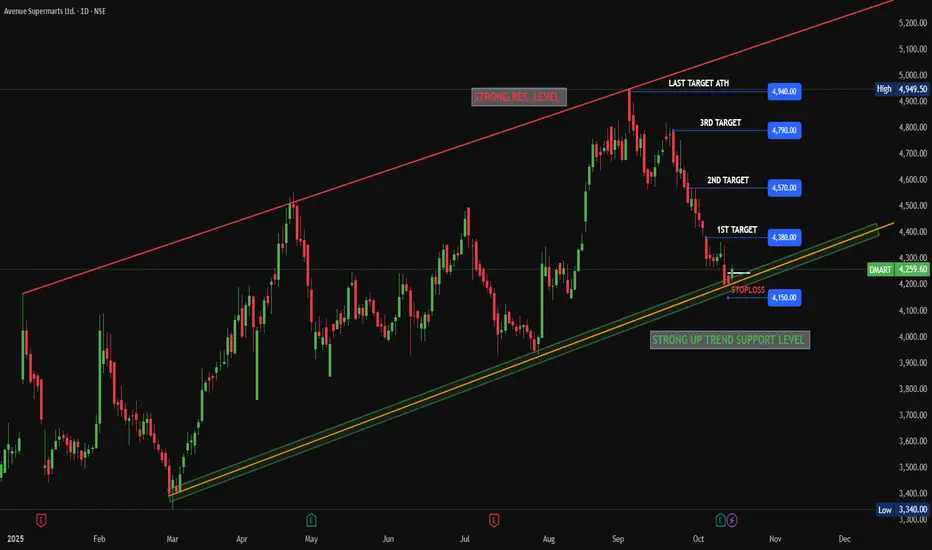
DMART LONGDMART (Avenue Supermarts) has reached a strong trend support level. Additionally, in the daily timeframe, the current candle closed at the previous day's candle level.
Therefore, we can go long in DMART for a swing trade. Fundamentally, the quarterly results are already out, so there is no immediate issue regarding upcoming events.
Go long on DMART, but make sure to manage your trade quantity, risk, and reward based on your risk appetite. This is for educational purposes only and does not guarantee returns.
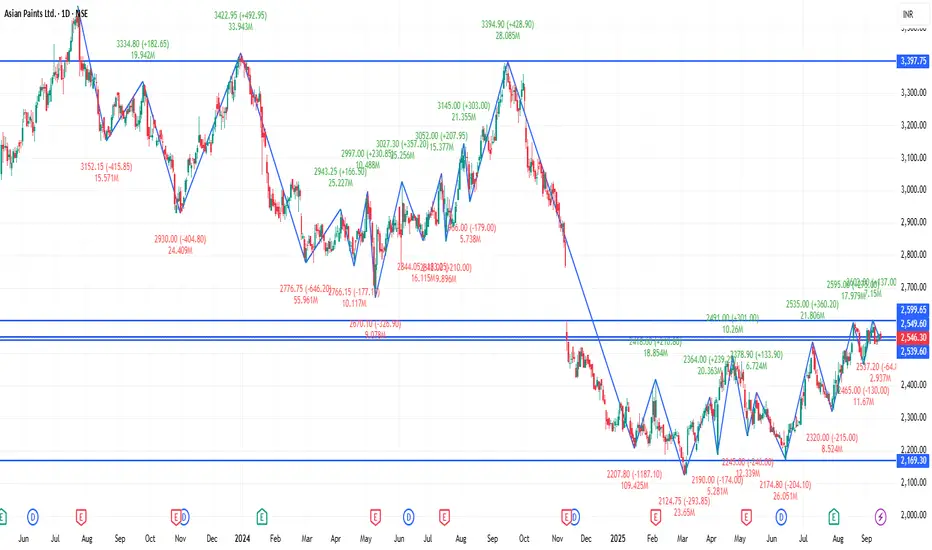
ASIANPAINT 1D Time frame🔢 Current Level
Trading around ₹2,546 – ₹2,560
🔑 Key Resistance & Support Levels
Resistance Zones:
₹2,559 – ₹2,560 (recent highs; breakout above this may lead to further upside)
₹2,580 – ₹2,600 (stronger resistance above)
Support Zones:
₹2,540 – ₹2,545 (immediate support; failure to hold above this may lead to a decline)
₹2,520 – ₹2,530 (short-term support; a break below this could indicate weakness)
₹2,500 – ₹2,510 (deeper support zone if price dips further)
📉 Outlook
Bullish Scenario: If Asian Paints holds above ₹2,545, upward momentum may continue. Break above ₹2,560 can open the way toward ₹2,580+.
Bearish Scenario: If it falls below ₹2,520, risk increases toward ₹2,500 – ₹2,510.
Neutral / Range: Between ₹2,545 – ₹2,560, Asian Paints may consolidate before a directional move.
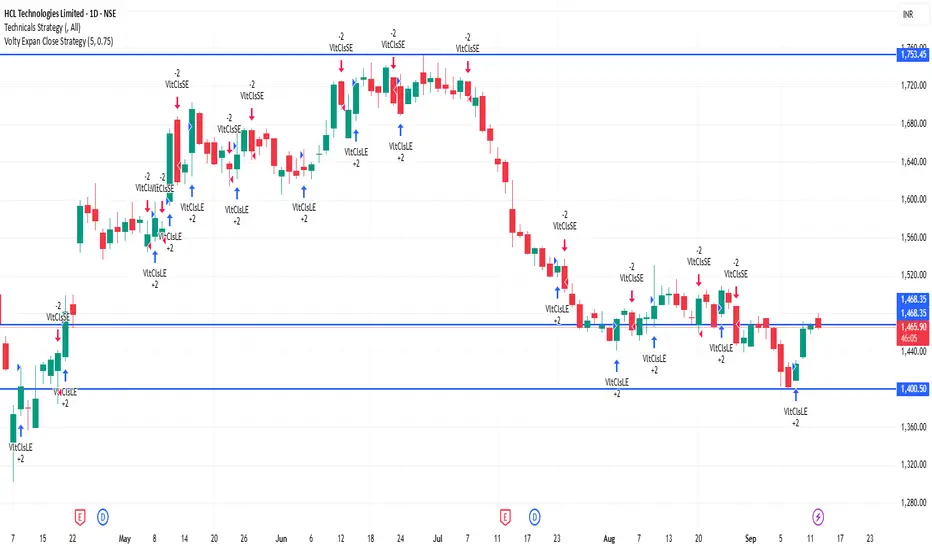
HCLTECH 1D Time frame🔢 Current Level
Trading around ₹1,465.80 - ₹1,467.80
🔑 Key Resistance & Support Levels
Resistance Zones:
₹1,472 – ₹1,475 (recent highs; breakout above this may lead to further upside)
₹1,485 – ₹1,490 (stronger resistance above)
Support Zones:
₹1,460 – ₹1,463 (immediate support; failure to hold above this may lead to a decline)
₹1,450 – ₹1,453 (short-term support; a break below this could indicate weakness)
₹1,440 – ₹1,445 (deeper support zone if price dips further)
📉 Outlook
Bullish Scenario: If HCL Technologies holds above ₹1,463, upward momentum may continue. Break above ₹1,475 can open the way toward ₹1,485+.
Bearish Scenario: If it falls below ₹1,440, risk increases toward ₹1,430 – ₹1,445.
Neutral / Range: Between ₹1,463 – ₹1,475, HCL Technologies may consolidate before a directional move.
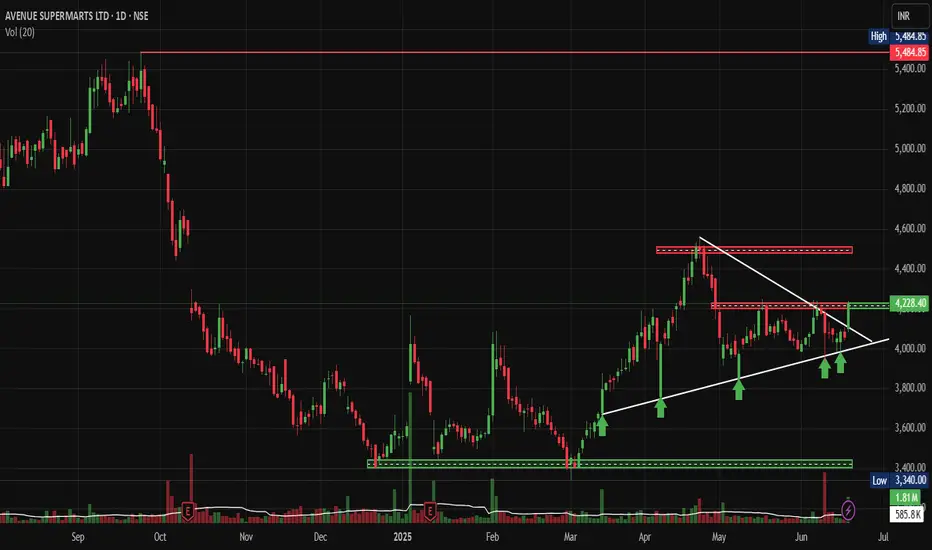
DMART: Technical Breakout Signals Major Rally AheadNSE:DMART Technical Breakout Signals Major Rally Ahead after news of its Entry in Uttar Pradesh as the First Store Opened in Agra.
Price Action:
• Current Price: ₹4,228.40 (up 4.17% or ₹169.30)
• 52-Week Range: ₹3,340 (Low) to ₹5,484.85 (High)
• Stock is trading in the upper half of its annual range, showing strong momentum
• Recent price action indicates a successful breakout from the consolidation phase
Volume Spread Analysis:
• Volume spike visible during recent breakout sessions
• Above-average volume of 585.8K shares traded, confirming institutional participation
• Volume pattern supports the bullish price movement
• Higher volume on green candles indicates genuine buying interest
Key Technical Levels:
Support Levels:
• Primary Support: ₹4,100-4,150 (recent breakout level)
• Secondary Support: ₹3,900-3,950 (previous resistance turned support)
• Major Support: ₹3,600-3,700 (demand zone from March-April consolidation)
• Critical Support: ₹3,400-3,450 (psychological level and volume-based support)
Resistance Levels:
• Immediate Resistance: ₹4,400-4,450 (supply zone marked on chart)
• Major Resistance: ₹4,600-4,700 (previous swing high area)
• Target Resistance: ₹5,200-5,300 (approaching 52-week high zone)
• Ultimate Target: ₹5,484 (52-week high)
Base Formation:
• Stock formed a strong accumulation base between December 2024 and April 2025
• Base depth: Approximately 25-30% from peak to trough
• Duration: A 5-month consolidation period indicates institutional accumulation
• Base breakout occurred with strong volume confirmation in May 2025
Technical Patterns:
• Cup and Handle formation visible from October 2024 to May 2025
• Ascending triangle pattern during the consolidation phase
• Higher lows formation indicating strong underlying demand
• Breakout from falling wedge pattern in early May 2025
Trend Analysis:
• Primary Trend: Bullish (upward sloping trendline from December lows)
• Intermediate Trend: Bullish breakout from consolidation
• Short-term Trend: Strong upward momentum with minor pullback potential
Trade Setup:
Bull Case Scenario:
• Entry Strategy: Buy on dips approach recommended
• Momentum continues toward ₹4,600-4,800 levels
• Volume expansion supports further upside
• Sector rotation favouring retail stocks
Entry Levels:
• Aggressive Entry: ₹4,200-4,250 (current market price area)
• Conservative Entry: ₹4,050-4,100 (on pullback to support)
• Ideal Entry: ₹4,000-4,050 (strong support retest)
Exit Levels:
• Partial Profit Booking: ₹4,500-4,600 (book 30-40% position)
• Second Target: ₹4,800-4,900 (book another 30-40%)
• Final Target: ₹5,200-5,300 (ride remaining 20-30% position)
Stop-Loss Strategy:
• Initial Stop-Loss: ₹3,950 (below recent support)
• Trailing Stop-Loss: Trail stops by ₹150-200 as price advances
• Final Stop-Loss: ₹3,800 (if major support breaks)
Risk Management:
Position Sizing:
• Conservative Allocation: 2-3% of total portfolio
• Moderate Allocation: 3-5% of total portfolio
• Aggressive Allocation: 5-7% of total portfolio (only for high-conviction traders)
Risk Factors:
• Market volatility during the quarterly results season
• Retail sector sensitivity to economic cycles
• High valuations may limit upside potential
• Profit booking pressure near previous highs
Risk Mitigation:
• Diversify across multiple retail stocks
• Use a staggered entry approach
• Maintain strict stop-loss discipline
• Monitor sector rotation trends
Sectoral Backdrop:
Retail Sector Overview:
• The Indian retail sector is following the "Everyday Low Cost - Everyday Low Price" strategy
• Strong, organised retail penetration growth expected
• Consumer spending recovery supporting sector growth
• E-commerce competition intensifying, but offline retail remains resilient
Sector Catalysts:
• Festival season approaching (positive for retail)
• Rural consumption recovery expected
• Urban consumption remains steady
• Government policies supporting organised retail
Fundamental Backdrop:
Company Overview:
• Avenue Supermarts follows a competitive procurement, operational efficiency, and cost-effective distribution strategy
• Market Cap: ₹2,75,237 Crores with almost debt-free status
• Leading hypermarket chain with strong brand presence
Financial Performance:
• Q4 FY25: Sales of ₹14,872 crore (16.9% YoY growth)
• Revenue projected to grow 15% to ₹68,000 to ₹70,000 crore
Business Strengths:
• Strong operational efficiency and supply chain management
• Consistent store expansion strategy
• High customer loyalty and repeat business
• Strong cash generation and a debt-free balance sheet
Growth Drivers:
• New store openings in Tier-2 and Tier-3 cities
• Same-store sales growth improvement
• Category expansion and private label growth
• Digital initiatives and omnichannel presence
My Take:
NSE:DMART presents a compelling technical setup with strong fundamental backing. The stock has successfully broken out from a 5-month consolidation base with volume confirmation. Risk-reward ratio favours bulls with proper position sizing and stop-loss management. Traders should consider entering on minor pullbacks, while investors can accumulate on any meaningful corrections toward support levels.
Keep in the Watchlist.
NO RECO. For Buy/Sell.
📌Thank you for exploring my idea! I hope you found it valuable.
🙏FOLLOW for more
👍BOOST if you found it useful.
✍️COMMENT below with your views.
Meanwhile, check out my other stock ideas on the right side until this trade is activated. I would love your feedback.
Disclaimer: "I am not a SEBI REGISTERED RESEARCH ANALYST AND INVESTMENT ADVISER."
This analysis is intended solely for informational and educational purposes and should not be interpreted as financial advice. It is advisable to consult a qualified financial advisor or conduct thorough research before making investment decisions.
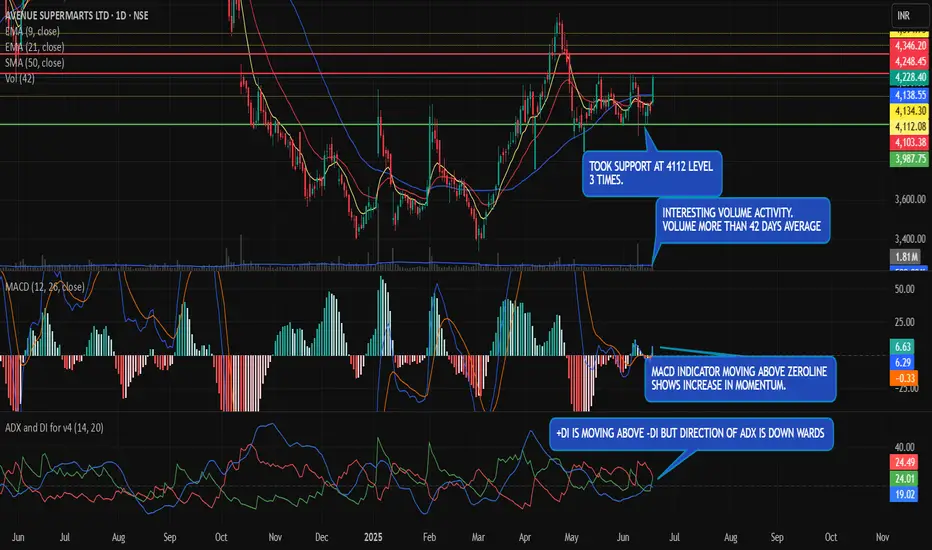
AVENUE SUPERMART AN INTERESTING MOVEMENT.DMART Stock came into notice after a strong bullish candle with above average volume.
The stock is taking support at 4112 multiple times which makes the level even more strong support.
A close above 4248-4250 level will give a confirmation on upside momentum on daily time frame which can push the stock towards 4346 which is next resistnce level.
The 50 day SMA is also evelving and the driection of the moving average is moving upwards. A more confidence can be seen in momentum when 21 day EMA (blue colour) and 9 day EMA (red colour) crosses above 50 day SMA.
Resistance :
1) 4248-4250
2) 4346
Support :
1) 4134
2) 3987
Discaimer & Disclosure : I am not a SEBI regitered reserch Analyst. This is purely for Educational purpose only.
DMART - VCP Pattern Breakout On Weekly ChartDMART - VCP Pattern Breakout On Weekly Chart
The stock has formed a Volatility Contraction Pattern (VCP), indicating a potential bullish move.
A breakout above the resistance level has occurred, signaling further upside potential.
Volume - A noticeable increase in volume supports the breakout, which is a positive sign for continuation of the upward trend.
Entry, Targets, and Stop-Loss:
Entry:
Ideal entry point is above ₹5,350, to confirm the breakout.
Targets:
First Target (T1): ₹5,900
Second Target (T2): ₹6,400
Third Target (T3): ₹8,500 (longer-term target based on the measured move from the breakout).
Stop-Loss:
Set stop-loss at ₹4,650, just below the breakout level to manage risk.
Summary:
Entry: Above ₹5,350.
Targets: ₹5,900, ₹6,400, ₹8,500.
Stop-Loss: ₹4,650.
Disclaimer: The stock information shared here is not a recommendation to buy, sell, or hold. It reflects my own analysis and is intended solely for educational purposes. Any actions you take based on this information are your responsibility, and the admin of this channel is not liable for any financial gains or losses. Please consult a financial advisor before making any investment decisions. I am not a SEBI-registered advisor.

DMart-Is the breakout for ATH done?Dmart has been consolidating in an ascending triangle pattern since it had tested its strong demand zone of 3200-3300.
Stock managed to give a weekly closing above the resistance of 4200.
It is a high risk, high growth stock, so trade accordingly. Valuation at current price is not good for investing.
Stock can touch ATH if we see a bullish market again.

Momentum swing idea|Avenue Supermarts LtdAvenue Supermarts Ltd
venue Supermarts Limited (DMart) is a national supermarket chain, with a focus on value-retailing. We offer a wide range of products with a focus on the Foods, Non-Foods (FMCG) and General Merchandise & Apparel product categories.
Fundamental : strong
Market Cap₹ 2,79,659 Current Price ₹ 4,298 Stock P/E 115
ROCE 20.1 % ROE 16.0 % Debt to equity 0.04
Promoter holding 74.6 % Quick ratio 1.08 Current ratio 3.52
Piotroski score 8.00 Profit Var 3Ys 22.5 % Sales growth 3Years 19.9 %
Return on assets 14.1 %
This is large cap stock with high momentum stock with FMCG sector in trend.
keep in radar. although stock PE is high but their sales is also improving since last some years.
lets how market react and closely watch stock performance.
Note: I am not SEBI registered financial Adviser. I solely present my views on chart .I do not charge any kind of service. This is not buy sell recommendation. This is just educational purpose only. I am not responsible for any profit and loss. Do your own research before investing.
If you like my momentum strategy and ideas than like boost and follow me for more ideas.
Thanks and comment freely

Avenue Supermarts Ltd - DMART - Positional TradeDate : 8-May-2024
Rating : Buy - Positional Trade
LTP : Rs. 4,806.75
Targets: (1) Rs. 5,180 --> (2) Rs. 5,900 --> (3) Rs. 7,577
SL : Rs. 4,450 on daily close basis
Technical View:
• NSE:DMART is in its primary uptrend and was going through it's secondary downtrend.
• After breaking out from its 2.5 years long secondary down trend on 19-Mar-2024, NSE:DMART has started the upward journey.
• After making a new 52w high of 4,890 on 23-Apr-2024, it has taken support at 4,450 on 29-Apr-2024 and again started the upward journey on 30-Apr-2024.
• RSI is trading at 65.32 and MACD is trading at 84.74
• Looking strong from here on.
Disclaimer : I am not a SEBI registered analyst/consultant and not recommending anyone to take any BUY or SELL position in stock market. Investing in stock market is risky and one should do a self analysis and validation before investing in stock market. Ideas are published for learning purpose only.

REVERSAL IN AVENUE SUPERMARTSAvenue Supermarts is BULLISH on Monthly timeframe and has changed its price structure on Weekly timeframe which gives a strong conviction that it is going to test its ATH once again. There is a scope of accumulation if it is available at a discounted price between 4200 and 4300 . The idea will be invalid below 4000 . The targets are crystal clear according to price action. Hourly timeframe should be followed for a good entry with a minimum risk for a greater reward.

Looking for long!DMART is looking for long opportunity after forming descending channel on weekly timeframe & has formed reversal fill on daily timeframe. Expecting target to reach at 6000 for longterm.

Dmart Avenue Supermart: Traingle patternGreat setup for a great company
traingle breakout with good risk and reward mentioned in chart
#DMART #Triangle

Triangle Pattern Breakout and Pull back pattern Seen in DMARTHello Traders, i have brought another analysis on a pattern breakout which called (Triangle Pattern Breakout and Pull back pattern). Well i have marked and written most of the things on chart, but still i am gonna to teach you here guy's about this pattern so if you see this next time, at least you guy's will be able to trade. So Let's start:-
Q:- What Is the Triangle Continuation Pattern?
Rahul:- The Triangle is a continuation pattern using the concepts of support and resistance and price breakouts. Generally, when prices make significant moves, they go through a period of resting. Usually with a Triangle pattern, the price consolidation period consists of higher lows and lower lows, forming the shape of a “triangle”.
Q:- What Does the Triangle Continuation Pattern Look Like?
Rahul:- Guy's check above the Nifty chart, i have rectified Triangle pattern.
Q:-How to Interpret the Triangle Continuation Pattern?
Rahul:- When the support and resistance lines begin converging, price can burst out of the consolidation area and it is expected that the price action will continue trending in the direction that prices have been moving previously.
Q:- Is Triangle Continuation Breakout Pattern is a Buy Signal?
Rahul:- Yes it gives signal to buy when the resistance line is penetrated to the upside. The signal is generally expected to be stronger if prices have been in an uptrend prior to the upside breakout.
I hope guy's you have learned now about this Bullish Triangle pattern.
Let's Focus on about company:-
Avenue Supermarts is primarily engaged in the business of organized retail and operates supermarkets under the brand name of D-Mart.
Market Cap
₹ 2,46,882 Cr.
Current Price
₹ 3,796
High / Low
₹ 4,602 / 3,292
Stock P/E
103
Book Value
₹ 248
Dividend Yield
0.00 %
ROCE
20.1 %
ROE
16.0 %
Face Value
₹ 10.0
Debt
₹ 643 Cr.
EPS
₹ 36.9
PEG Ratio
4.21
Promoter holding
74.6 %
Intrinsic Value
₹ 958
Pledged percentage
0.00 %
EVEBITDA
64.7
PROS
Company is almost debt free.
Company has delivered good profit growth of 24.5% CAGR over last 5 years
Company's median sales growth is 33.1% of last 10 years
CONS
Stock is trading at 15.3 times its book value
Though the company is reporting repeated profits, it is not paying out dividend
Company has a low return on equity of 12.6% over last 3 years.
Disclaimer:- Please always do your own analysis or consult with your financial advisor before taking any kind of trades.
Dear traders, If you like my work then do not forget to hit like and follow me, and guy's let me know what do you think about this idea in comment box, i would be love to reply all of you guy's.
Thankyou.

triangle pattern breakout.Elliott Wave Analysis:-
View 1:- swing trade,
A triangle has formed in the 4th wave Correction wave and it seems to be ready to give an impulse breakout. if it so then the target will be
Target 1:- 4800
T2:- 5150
T3:-6100
Stop loss:-3291
if the pattern had broken up and crossed the 4610 then the stop may be adjusted to 3485.
View 2:-
there may be an alternative view which the triangle may breakout in bottom and it may also go till 2500-2900. we can average at bottom. if long term investor can also think of choosing second view else only 1st view is advisable.
i'm not a SEBI advisor. kindly consider your own analysis before taking the trade or consult your own financial advisor.

whether the correction over in damrt?the correction taken has over to certain level.
the script may start a rise from the CMP (or) the script may give a deep correction and then it may strat to raise.
recent quarter has shown a good results.
there are 2 possibility in impulse and one in corrective way nature. as of now we can go for the buy at CMP and we can average if the price come down.
Disclaimer.
im not a SEBI registered advisor.
this trade setup is my idea and it is not a call or tips.
before taking your trade kindly consult your investment advisor.

#Dmart I use support /resistance to find liquidity traps with volume hence "BUY".
Uptrend 👍 🚀
#StocksInFocus
#StocksToWatch
#StocksToTrade
#StocksToBuy
#StocksToInvest

Downward Sloping Trendline Breakout Seen in Avenue SupermarketABOUT COMPANY
Avenue Supermarts is primarily engaged in the business of organized retail and operates supermarkets under the brand name of D-Mart.
We have seen Neat & Clean Breakout of Downward Sloping Trendline in Avenue Supermarket(D-Mart). This is a huge breakout, this momentum can take this ticker towards All time high 5323 levels. Price and Action Showing a bullish momentum in it. Volume increment also higher from previous week.
According to this breakout price should move in upward direction very fast. As previously we have seen a gap down, so this breakout has filled that gap up also. All that indicating a price reversal in D-Mart.
All levels i have marked on chart, like entry, target, stop loss, all support, breakout levels etc.
If you guy's like my work then don't forget to hit like and follow me and comment your thoughts on this idea.
Thankyou.
Disclaimer:- This is one of my best stock which i am holding from down levels, and still going to add more here as this is showing clearly price reversal. This is not a recommendation, You guy's do your own research or consult with your financial advisor before taking any position in it.

D-MART (Avenue Supermart) AnalysisD-MART is Coming near to supportive trendline level (3400-3320). it is looking good near to the support line, As 1 Day RSI Level (27) also showing it is in oversold zone. Considering it for short term move with upside potential of 10-12%.
Target 1 : 3850
Target 2 : 4000
Disclaimer : The Above shared Content is for information and education purposes only and should not be treated as investment or trading advice. Im not SEBI registered, Contact your financial advisor before any investment.

D-Mart Looks weak below 3836.Looks good to short below 3836. It has formed Bearish hammer on its Resistance.

Avenue suparmarkets buy side tradeAfter the long rangebound market Avenue supermarket can break it's level of 4531 Then the bullish move can be seen

Dmart long opportunityNSE:DMART
Stock -> Dmart
TimeFrame -> Weekly
Hello all!
Dmart has been consolidating in a flag structure since October 2021, thus forming a flag and pole pattern. It finally broke out of it with good volumes last week. This makes for a good opportunity to go long.
There are multiple reasons which strengthen my conviction on going long:
1) The stock has bounced back from 3200 levels which is a good support.
2) The weekly closing is above 50 EMA.
3) The breakout has happened with good volumes.
Risk-averse traders can wait for the stock to sustain above 4000 on a daily timeFrame for going long, although accumulation in small quantities can be done.
*NOT A CALL*

Dmart Dmart Share Analysis On Monthly Chart .
Market Capital ₹263,155 Cr.
Promoter Holding 75%
ROE 9.45%
Stock P/E 178
Sales Growth 28.8%
Debt ₹ 510 Cr.
