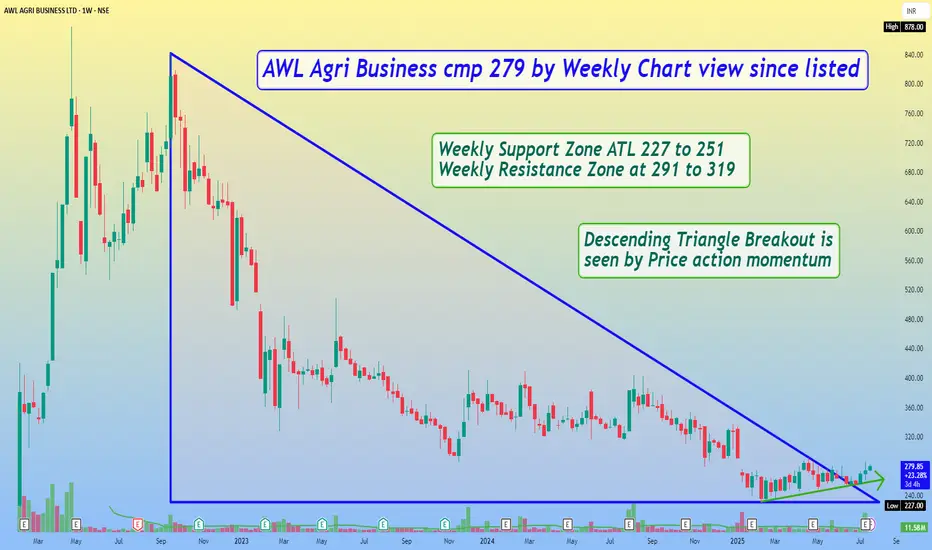
AWL Agri Business cmp 279 by Weekly Chart view since listedAWL Agri Business cmp 279 by Weekly Chart view since listed
- Weekly Support Zone ATL 227 to 251
- Weekly Resistance Zone at 291 to 319
- Descending Triangle Breakout is seen by Price action momentum
AWL
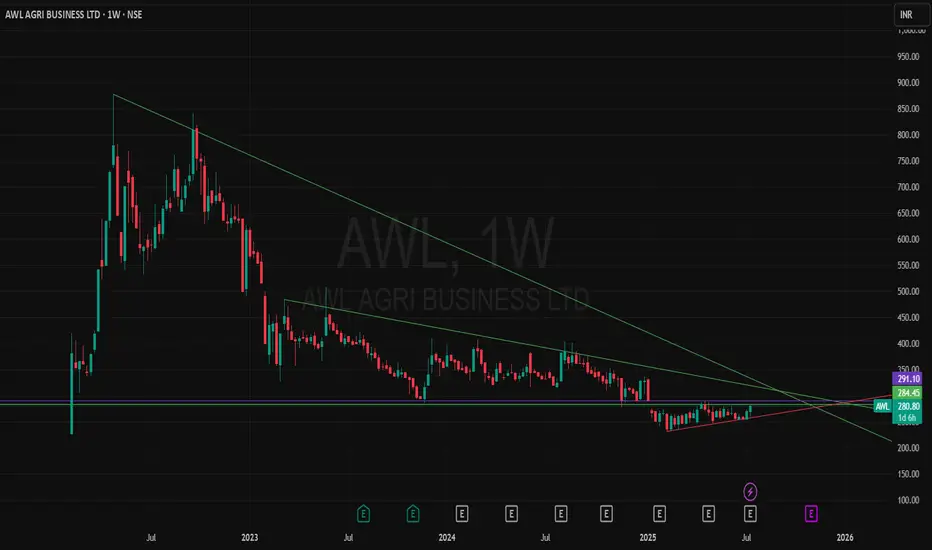
"Nurturing Growth, Nourishing India,"🟢 AWL Agri Business Ltd – Signs of Bottoming Out 🧩
CMP: ₹278.80 | NSE: AWL
🔹 Multi-year downtrend seems to be ending with breakout from falling wedge
🔹 MACD turning positive on monthly & weekly charts – early sign of trend reversal
🔹 RSI rebounding from oversold zone with higher lows
🔹 Consistent volume buildup suggests accumulation by strong hands
🔹 Technicals + Valuation hint that downside may be limited
💼 AWL, a key player in India's agri supply chain, may benefit from rising demand for edible oils & food products. At current levels, valuations are attractive for long-term investors.
📌 Ideal for staggered portfolio addition with 3–5 year view
📈 Potential for re-rating if fundamentals improve and prices hold above ₹285–₹292 zone
🔍 Not a buy/sell recommendation. Only for study & educational purposes.
📝 Note: Please do your own due diligence. This is not a recommendation, just a view based on charts and fundamentals.
🧠 Disclaimer: For educational and research purposes only. No buy/sell advice.
📝 Chart Purpose & Disclaimer:
This chart is shared purely for educational and personal tracking purposes. I use this space to record my views and improve decision-making over time.
Investment Style:
All stocks posted are for long-term investment or minimum positional trades only. No intraday or speculative trades are intended.
⚠️ Disclaimer:
I am not a SEBI registered advisor. These are not buy/sell recommendations. Please consult a qualified financial advisor before taking any investment decision. I do not take responsibility for any profit or loss incurred based on this content.
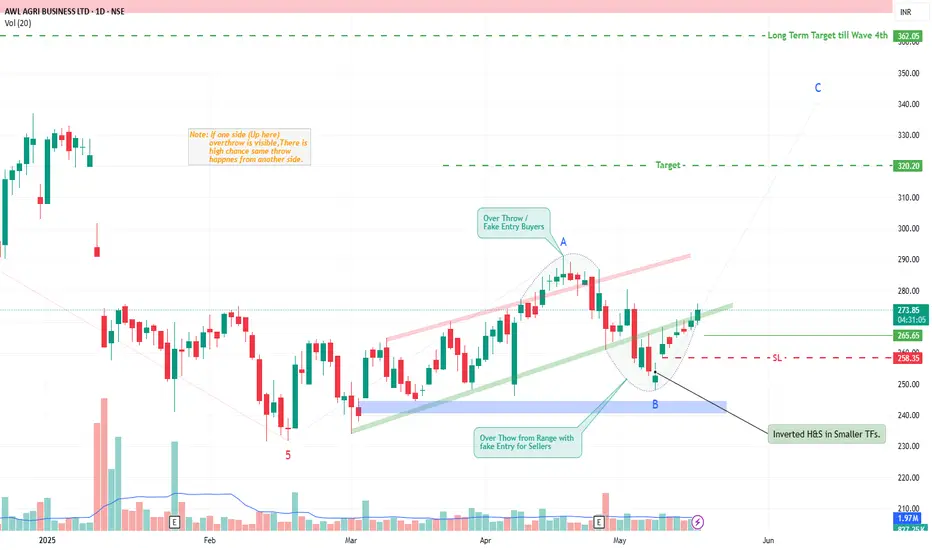
AWL Agri Business By KRS Charts 19th May 2025 / 10:42AM
Why AWL?
1. AWL was in Huge Correction mode after its first high after listed.
2. Correction path is showing clear Wave counts , finished Wave 5 downside and recently it likely in ABC Wave upside.
3. AWL was range bound for quite a time and recently shown upside overthrow (Fake Entry Buyside) from strong range and now likely same overthrow for downside also.
4. Price Action does this when some big move about to come it shakeout both Buyers & Sellers before going for final move.
5. Bullish traits like Inv. H&S and Wave counts , and Bullish Range bound is giving enough conviction to bet on this.
SL & Targets are pinned in Chart.
AWL has low P/E Ratio compared to its Industry.
Wave Count shown in Chart is rough prediction can be varied👍
Long Term Target SL will be 250 Rs.
ADANI WILMAR ON SUPPORT When WILMAR falls from high and start accumulating in the bottom zone , when price go up volume also goes up but price goes down volume doesn’t. It’s shows that there is opportunity to invest in this support area . Charts price shows rectangular channel bottom price . Now if we pick up from here then we have low risk.

Monthly Chart Looking GoodKey Highlights : 🔰
🔷 Script Name : Adani Wilmar
🔷 Script Symbol : NSE:AWL
🔶 Stock In Demand Zone 🔥
🔶 Stock Support Level Near ₹ 300/- 🔥
🔶 Narrow Monthly Bollinger Bands 🔥
🔶 Volume Supported Price Move 💚
🔷 Stop Loss : Below ₹300/- Weekly Close 👀
🔷 Target : 🤔😊
Disclaimer: This is NOT investment advice. This post is meant for learning purposes only. Invest your capital at your own risk.
Happy learning. Cheers!!
Shyorawat Arun Singh ❤️
(@Shyorawat_ArunSingh)
Founder : Shyorawat Investing School

SELL ADANI WILMAR @ 385 - 410Adani Wilmar is trading in a range which is 410 on upside and 325 to 315 is on downside. The stock is currently trading at upper range and we expect stock to heading towards lower range again. Sell @ 385 and add more if it goes upside until 411 is intact.
To motivate us, Please like the idea If you agree with the analysis.
Happy Trading!
InvestPro India

AWL - Readying for breakoutAlmost a year of accumulation
Last 2 weeks showing HIgh Delivery
Ready for Breakout
Target seems 4 figures in coming
Sl approx 20% so Trade accordingly

ADANI wilmar symmetrical triangle breakoutADANI WILMAR has formed symmetrical triangle and has given breakout.
1st target 400
2nd target 500

BUY AWLBuy this fundamentally strong stock on dips. Purchase 50% at the current price and add more if it reaches 321.
Stop loss: if two consecutive daily candle closes below the support trendline.

Adani Wilmar Limited: 148% upmove possible➡️adani group
➡️148% upmove possible
➡️market leader in some segments with continuous Capex
Cons:
Margins are weak (safe traders to wait for improvement in op. margin)

Adani Wilmar Ltd - Breakout OpportunityDate : 27-Feb-2024
Rating : Buy
LTP : Rs. 387.85
Targets: (1) Rs. 419 --> (2) Rs. 492 --> (3) Rs. 532 --> (4) Rs. 639
SL : Rs. 350
Technical View:
Since SEP 2022 NSE:AWL has been in primary down trend. On 19-Feb-2024, NSE:AWL has given break out from its primary down trend with higher than average volume. RSI is above 50 and MACD is above 0. Indicating bullish sign for coming days.
Disclaimer : I am not a SEBI registered analyst/consultant and not recommending anyone to take any BUY or SELL position in stock market. Investing in stock market is risky and one should do a self analysis and validation before investing in stock market.

Amazing swing trading idea for 26 Feb Markets I daily make educational content videos for swing / positional trading.

Can go long on Adani Wilmar after Breakout Stock has come under a brought zone. I may think as chart suggest, if it's give Breakout above 396, we can go for long.
So Target are T-1 427 , T-2 482, T-3 543
SL - 355.
As of above just watch this stock, entry after 396.

AWL Long IdeaAs per price pattern, AWL consolidating near major support point or sharp demand zone.
History shows it will be bounce back upto 540


ADANI WILMAR long and shortAWL break the downward trend line and closed above the trend line (above 406.55). Now stand at make and break level. It can go 384 down side and anyone go for long with 390 SL.
Summarily, it is the good accumulation zone atleast for 20% in short term.
In short time frame, with 399 SL long is good.
Thank you.

AWL - Short Term Investment Disclaimer.
I am not SEBI registered analyst.
My studies are for educational purposes only.
Please Consult your financial advisor before trading or investing.
I am not responsible for any kind of your profits and your losses.

HEAD AND SHOULDER BREAKOUT (AWL)Head And Shoulder Breakout
CMP: 435
Targets for Downside: 591 and 551
SL: 671 Above Previous Swing High
AWL Broke this years major support retested the support area and now heading to downside.
Disclaimer: This is for educational purposes only, not any recommendations to buy or sell.

Adani Wilmar LONG Adani wilmar has formed pole and flag on daily time frame
stoploss and target mentioned on the charts
Educational purpose only,Trade accordingly

ADANI WILMAR (AWL) Consolidating in Long Term Triangle PatternVERDICT ADANI WILMAR (AWL) NSE:AWL
Consolidating in Long Term Triangle Pattern
Indicators Getting Bullish
Will Go Up to 1030 If Breaks out
Watch The Move , Buy on Trend Line Breakout
Only For Study Purpose

ADANI WILMAR LTD AWL Getting Ready For a Big MoveNSE:AWL
ADANI WILMAR LTD AWL
Getting Ready For a Big Move
Grab it For
T1 840
T2 880
SL 665
Only For Study Purpose

Adani Wilmar Ltd - Price action looks good at these levels...I see significant traction above 764.
With a strict stop loss at 5-8%, one can take positions based on one's risk management.
Note: Not a buy / sell recommendation. Do consult your financial advisor.

