Part 3 Trading Master Class With ExpertsOption Trading Psychology
Patience: Many options expire worthless, don’t chase every trade.
Discipline: Stick to stop-loss and position sizing.
Avoid Greed: Sellers earn small consistent income but risk blow-up if careless.
Stay Informed: News, earnings, and events impact volatility.
Tips for Beginners in Options Trading
Start with buying calls/puts before selling.
Trade liquid instruments like Nifty/Bank Nifty.
Learn Greeks slowly, don’t jump into complex strategies.
Avoid naked option selling without hedging.
Paper trade before risking real capital.
Role of Volatility in Options
Volatility is the lifeblood of options.
High Volatility = Expensive Premiums.
Low Volatility = Cheap Premiums.
Traders often use Implied Volatility (IV) to decide whether to buy (when IV is low) or sell (when IV is high).
AXISBANK

Part 2 Support and ResistanceWhy Trade Options? (Advantages)
Leverage: Small capital controls big positions.
Hedging: Protect stock portfolio from losses.
Flexibility: Profit in bullish, bearish, or sideways markets.
Income: Selling options generates consistent premiums.
Risk Control: Losses can be predefined by structuring trades.
8. Risks of Options Trading
Time Decay (Theta): Options lose value as expiration approaches.
Liquidity Risk: Not all options are actively traded.
Complexity: Strategies can be difficult for beginners.
Unlimited Risk (for sellers): Selling naked calls can wipe out capital.
Over-leverage: Small margin requirements may encourage oversized positions.

Part 1 Support and ResistanceCall and Put Options in Action
Call Option Example
Reliance is trading at ₹2500.
You buy a 1-month call option with strike price ₹2550, premium ₹50, lot size 505.
If Reliance rises to ₹2700 → Profit = (2700 - 2550 - 50) × 505 = ₹50,500.
If Reliance falls below 2550 → You lose only the premium (₹25,250).
Put Option Example
Nifty is at 20,000.
You buy a 1-month put option, strike 19,800, premium 100, lot size 50.
If Nifty falls to 19,200 → Profit = (19,800 - 19,200 - 100) × 50 = ₹25,000.
If Nifty rises above 19,800 → You lose premium (₹5,000).
Participants in Options Trading
Option Buyer – Pays premium, has limited risk and unlimited profit potential.
Option Seller (Writer) – Receives premium, has limited profit and potentially unlimited risk.
Example:
Buyer of call: Unlimited upside, limited loss (premium).
Seller of call: Limited profit (premium), unlimited loss if stock rises.

Divergence SecretsOption Greeks – The Science Behind Pricing
Options pricing is influenced by multiple factors. These sensitivities are known as the Greeks:
Delta – Measures how much option price changes with stock price.
Gamma – Rate of change of Delta.
Theta – Time decay (options lose value daily).
Vega – Sensitivity to volatility.
Rho – Sensitivity to interest rates.
Example: A call option with Delta = 0.6 means for every ₹10 rise in stock, option premium increases by ₹6.
Basic Option Strategies (Beginner Level)
Buying Calls – Bullish bet.
Buying Puts – Bearish bet.
Covered Call – Hold stock + sell call for extra income.
Protective Put – Own stock + buy put for downside insurance.

Option Trading 1. Introduction to Options Trading
Options trading is one of the most powerful tools in the financial markets. Unlike traditional stock trading, where you buy or sell shares directly, options allow you to control an asset without owning it outright. This gives traders flexibility, leverage, and a wide range of strategies for both profits and risk management.
At its core, an option is a contract that gives the buyer the right, but not the obligation, to buy or sell an underlying asset at a specific price (called the strike price) on or before a certain date (the expiration date).
The beauty of options lies in choice: you can profit whether markets are rising, falling, or even staying flat—if you know how to use them.
2. What is an Option?
An option is a derivative instrument, meaning its value is derived from the price of another asset (the “underlying”), such as:
Stocks (e.g., Reliance, Apple)
Indexes (e.g., Nifty, S&P 500)
Commodities (e.g., Gold, Oil)
Currencies
Two Main Types of Options:
Call Option – Gives the right to buy the underlying asset.
Put Option – Gives the right to sell the underlying asset.
Example:
A call option on Reliance with a strike price of ₹2500 expiring in one month gives you the right (not the obligation) to buy Reliance shares at ₹2500, regardless of the market price.
A put option with a strike of ₹2500 gives you the right to sell at ₹2500.

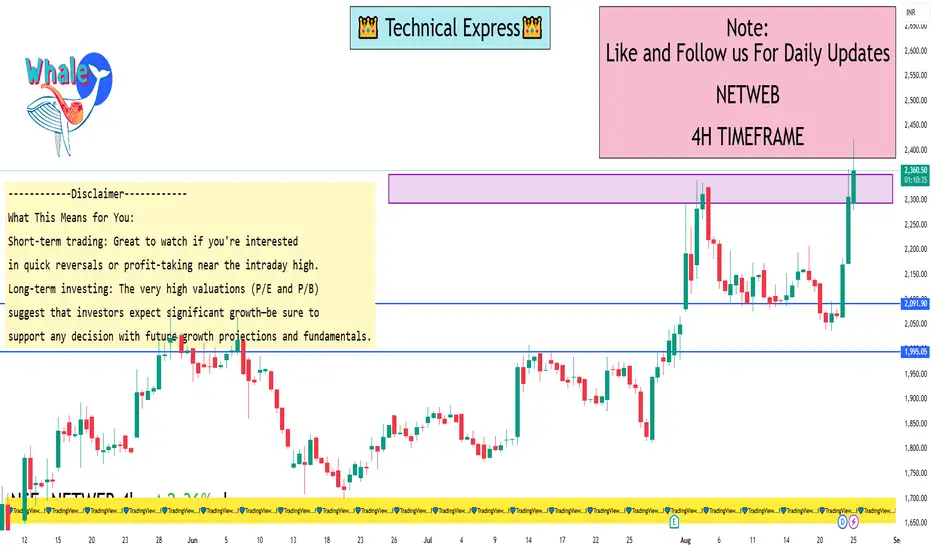
NETWEB Tech India 1 Day ViewIntraday Snapshot as of August 25, 2025:
Current Price: ₹2,353.00
Previous Close: ₹2,322.40
Day’s Range: ₹2,280.60 to ₹2,423.90
Key Refreshers on Today’s Movement:
The stock is trading slightly higher than yesterday’s closing price, signaling a modest intraday gain.
The intra-day high of ₹2,423.90 indicates a strong session, though it hasn't crossed the 52-week high of ₹3,060.
Additional Key Metrics (As of August 25, 2025):
P/E (TTM): ~114.94
P/B Ratio: ~24.8
Indicative of a richly valued stock—priced at a premium compared to industry averages.
Nykaa 4 Hour View 1. TradingView Analyst Highlight
Suggests a key support zone between ₹190–₹195, forming the base of an ascending broadening wedge. If this holds, a potential upward breakout could be expected.
2. MarketScreener Technical Overview
Short-term (4-hour) trend: Bullish
Support: ~₹213.84
Resistance: ~₹226.83
3. MunafaSutra (Intraday Levels)
Short-term resistance: ₹207.84
Support: ₹200.77
Interpretation & Strategy
Intraday/Very Short-Term: Monitor support at ₹200–₹201 and resistance near ₹208. Breakout/breakdown from these lines may trigger short-term moves.
Medium-Term (4-Hour Setups): A move above ₹214 could signal continuation toward ₹227, while a break below ₹214 may draw price toward the ₹190–₹195 zone.
Key Area to Watch:
Lower Support: ₹190–₹195 — critical for longer-term setup.
Major Resistance: Around ₹227 — validated by MarketScreener resistance.

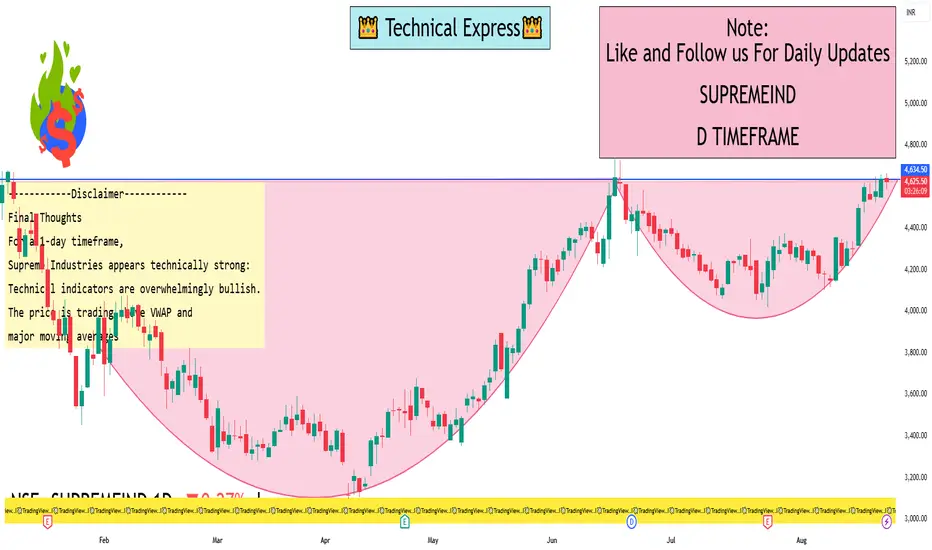
Supreme Industries 1 Day View1-Day Technical Overview
Consensus Ratings
TradingView signals a Buy rating for today, with a Strong Buy for the 1-week timeframe
Investing.com offers a robust Strong Buy across multiple timeframes (30 min, hourly, daily, weekly, and monthly)
Similarly, another Investing.com source reiterates: Strong Buy on both moving averages (12:0 buy:sell) and technical indicators (9:0)
Indicator Highlights (as of Aug 25, 2025)
RSI (14): 68.5 — indicates bullish momentum, nearing overbought territory
MACD, ADX, CCI, ROC, Ultimate Oscillator, Bull/Bear Power: All show Buy signals. Williams %R and StochRSI suggest Overbought
Moving Averages (Simple & Exponential): All tracked periods (5, 10, 20, 50, 100, 200) yield Buy signals
1-Day Price & Market Context
Latest stock price sits around ₹4,652–4,664, with intraday highs near ₹4,664.90 and lows round ₹4,586
VWAP (intraday volume-weighted average price) stands at approximately ₹4,634–4,636, suggesting current trading is slightly above average price levels
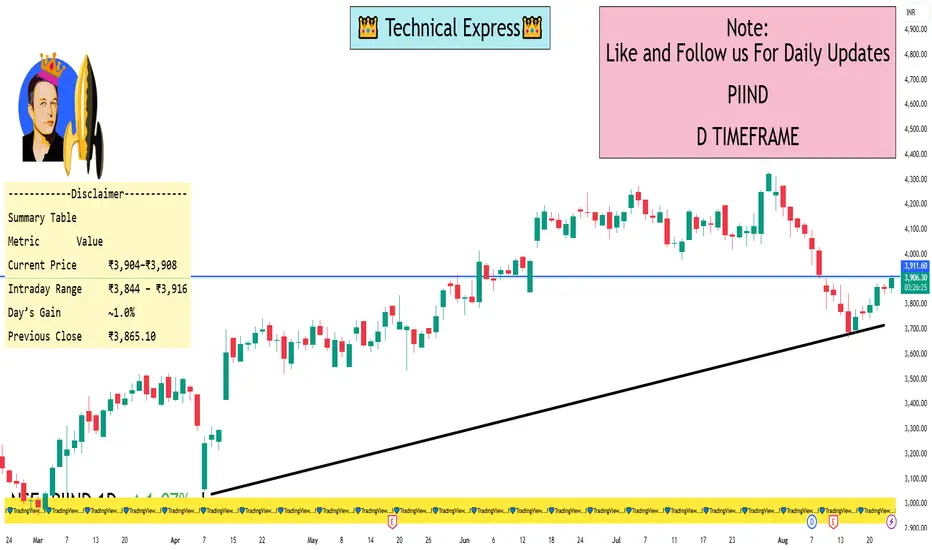
PI Industries 1 Day ViewIntraday Snapshot
Latest Price:
As per Investing.com, the price on August 25, 2025, stood at ₹3,903.80, marking a 1.00% gain for the day
Moneycontrol shows a pre-opening/early trading figure of ₹3,907.70, up roughly 1.10%
Daily Price Range:
Highest: ₹3,915.80
Lowest: ₹3,844.10
Previous Close: ₹3,865.10 on August 22, 2025, meaning today’s gain is from this base
Summary Table
Metric Value
Current Price ₹3,904–₹3,908
Intraday Range ₹3,844 – ₹3,916
Day’s Gain ~1.0%
Previous Close ₹3,865.10
Futures Trading ExplainedIntroduction
Futures trading is one of the most powerful financial instruments in the world of investing and trading. Unlike traditional stock buying where you own a piece of a company, futures are derivative contracts that allow you to speculate on the price movement of commodities, currencies, indices, and financial assets without owning them directly.
The futures market plays a crucial role in global finance by providing price discovery, risk management (hedging), and speculative opportunities. From farmers locking in prices for crops to institutional traders speculating on crude oil, futures are everywhere in the financial ecosystem.
In this guide, we’ll explore futures trading in detail, covering everything from the basics to advanced strategies, with real-world examples.
1. What are Futures?
A futures contract is a legally binding agreement to buy or sell an underlying asset at a predetermined price at a specific time in the future.
Key points:
Underlying asset: The thing being traded (wheat, crude oil, gold, stock index, currency, etc.).
Standardized contract: The size, quality, and delivery date are pre-defined by the exchange.
Leverage: Traders can control large positions with small capital (margin).
Cash-settled or physical delivery: Some futures end with cash settlement, others with delivery of the actual asset.
For example:
A wheat farmer agrees to sell 1000 bushels of wheat at $7 per bushel for delivery in 3 months. The buyer agrees to purchase it. Regardless of where the price goes, both are bound to the contract terms.
2. History and Evolution of Futures
Futures are not new – they date back centuries.
Japan (1700s): The Dojima Rice Exchange in Osaka is considered the birthplace of futures. Rice merchants used contracts to stabilize income.
Chicago Board of Trade (1848): Modern futures trading started in the U.S. with grain contracts.
20th Century: Expansion into metals, livestock, and energy.
Late 20th to 21st Century: Financial futures (currencies, indices, interest rates) became dominant.
Today, futures are traded worldwide on major exchanges like CME (Chicago Mercantile Exchange), ICE (Intercontinental Exchange), and NSE (National Stock Exchange of India).
3. Futures vs. Other Instruments
To understand futures better, let’s compare them with other markets:
Futures vs. Stocks
Stocks = Ownership of a company.
Futures = Contract to trade an asset, no ownership.
Stocks are unleveraged by default; futures use leverage.
Futures vs. Options
Options = Right but not obligation.
Futures = Obligation for both buyer and seller.
Options limit risk (premium paid); futures have unlimited risk.
Futures vs. Forwards
Forwards = Customized, private contracts (OTC).
Futures = Standardized, exchange-traded, regulated.
4. How Futures Trading Works
Let’s break down the mechanics:
a) Contract Specifications
Every futures contract specifies:
Underlying asset (Gold, Nifty index, Crude oil, etc.)
Contract size (e.g., 100 barrels of oil)
Expiration date (e.g., March 2025 contract)
Tick size (minimum price movement)
Settlement type (cash/physical)
b) Margin and Leverage
Traders don’t pay full value; they post margin (a percentage, usually 5–15%).
Example: 1 crude oil futures contract = 100 barrels. If price = $80, contract value = $8,000. Margin required may be $800. You control $8,000 with just $800.
c) Mark-to-Market (MTM)
Futures are settled daily. Profits and losses are adjusted every day.
If your trade is in profit, money is credited; if in loss, debited.
d) Long and Short Positions
Long = Buy (expecting price rise).
Short = Sell (expecting price fall).
Unlike stocks, short selling in futures is easy because contracts don’t require ownership of the asset.
5. Participants in Futures Market
The market brings together different players:
Hedgers – Reduce risk.
Example: A farmer sells wheat futures to lock in price; an airline buys crude oil futures to hedge fuel cost.
Speculators – Profit from price movements.
Traders, investors, hedge funds.
They provide liquidity but assume higher risk.
Arbitrageurs – Exploit price differences.
Example: Buy in spot market and sell futures if mispricing exists.
6. Types of Futures Contracts
Futures are available across asset classes:
a) Commodity Futures
Agricultural: Wheat, corn, soybeans, coffee.
Energy: Crude oil, natural gas.
Metals: Gold, silver, copper.
b) Financial Futures
Index futures (Nifty, S&P 500).
Currency futures (USD/INR, EUR/USD).
Interest rate futures (10-year bond yields).
c) Other Emerging Futures
Volatility index futures (VIX).
Crypto futures (Bitcoin, Ethereum).
7. Futures Trading Strategies
Futures are flexible and allow many trading approaches:
a) Directional Trading
Going long if expecting price rise.
Going short if expecting price fall.
b) Hedging
Farmers hedge crop prices.
Exporters/importers hedge currency fluctuations.
Investors hedge stock portfolios with index futures.
c) Spread Trading
Buy one contract, sell another.
Example: Buy December crude oil futures, sell March crude oil futures (calendar spread).
d) Arbitrage
Exploiting mispricing between spot and futures.
Example: If Gold futures are overpriced compared to spot, arbitrageurs sell futures and buy spot.
e) Advanced Strategies
Pairs trading: Trade correlated futures.
Hedged positions: Combining futures with options.
8. Advantages of Futures Trading
High Leverage: Amplifies potential returns.
Liquidity: Major futures markets have deep liquidity.
Transparency: Regulated by exchanges.
Flexibility: Can trade both rising and falling markets.
Hedging tool: Reduces risk exposure.
9. Risks in Futures Trading
While powerful, futures are risky:
Leverage risk: Losses are amplified just like profits.
Volatility risk: Futures can swing widely.
Margin calls: If losses exceed margin, traders must add funds.
Liquidity risk: Some contracts may have low volume.
Unlimited losses: Unlike options, risk is not capped.
Example: If you short crude oil at $80 and it rises to $120, your losses are massive.
10. Practical Example of Futures Trade
Imagine you believe gold prices will rise.
Gold futures contract size: 100 grams.
Current price: ₹60,000 per 10 grams → Contract value = ₹600,000.
Margin requirement: 10% = ₹60,000.
You buy one contract at ₹60,000.
If gold rises to ₹61,000 → Profit = ₹1,000 × 10 = ₹10,000.
If gold falls to ₹59,000 → Loss = ₹10,000.
A small move in price leads to large gains or losses due to leverage.
Conclusion
Futures trading is a double-edged sword – a tool of immense power for hedging and speculation, but equally capable of wiping out capital if misused. Traders must understand contract mechanics, manage leverage wisely, and apply strict risk management.
For professionals and disciplined traders, futures offer unparalleled opportunities. For careless traders, they can be disastrous.
The bottom line:
Learn the basics thoroughly.
Start small with proper risk controls.
Treat futures trading as a skill to master, not a gamble.
If used smartly, futures trading can become a gateway to financial growth and protection against market uncertainty.
Trading Master Class With ExpertsTips for Beginners in Options Trading
Start with buying calls/puts before selling.
Trade liquid instruments like Nifty/Bank Nifty.
Learn Greeks slowly, don’t jump into complex strategies.
Avoid naked option selling without hedging.
Paper trade before risking real capital.
Role of Volatility in Options
Volatility is the lifeblood of options.
High Volatility = Expensive Premiums.
Low Volatility = Cheap Premiums.
Traders often use Implied Volatility (IV) to decide whether to buy (when IV is low) or sell (when IV is high).
Mastering Options
Options are like a Swiss Army Knife of trading—one tool with multiple uses: speculation, hedging, and income generation. But with great power comes great responsibility.
To succeed in options trading:
Understand the basics thoroughly.
Start small and simple.
Master risk management.
Use strategies suited to your market outlook.
Keep emotions under control.
With practice and discipline, options can become a game-changer in your trading journey.

Part 6 Learn Institutional TradingOptions in Indian Markets
In India, options are traded on NSE and BSE, primarily on:
Index Options: Nifty, Bank Nifty (most liquid).
Stock Options: Reliance, TCS, Infosys, etc.
Weekly Expiry: Every Thursday (Nifty/Bank Nifty).
Lot Sizes: Fixed by exchanges (e.g., Nifty = 50 units).
Practical Example – Nifty Options Trade
Scenario:
Nifty at 20,000.
You expect big movement after RBI policy.
Strategy: Buy straddle (20,000 call + 20,000 put).
Cost = ₹200 (call) + ₹180 (put) = ₹380 × 50 = ₹19,000.
If Nifty moves to 20,800 → Call worth ₹800, Put worthless. Profit = ₹21,000.
If Nifty stays at 20,000 → Both expire worthless. Loss = ₹19,000.
Option Trading Psychology
Patience: Many options expire worthless, don’t chase every trade.
Discipline: Stick to stop-loss and position sizing.
Avoid Greed: Sellers earn small consistent income but risk blow-up if careless.
Stay Informed: News, earnings, and events impact volatility.

Part 2 Master Candlestick PatternKey Terms in Options Trading
Before diving into strategies, let’s master some core concepts:
Underlying Asset: The stock/index/commodity on which the option is based.
Strike Price: The price at which the option can be exercised.
Expiration Date: The date on which the option contract ends.
Premium: The price paid by the option buyer to the seller (writer) for the contract.
In-the-Money (ITM): Option has intrinsic value (profitable if exercised).
At-the-Money (ATM): Underlying price = Strike price.
Out-of-the-Money (OTM): Option has no intrinsic value yet (not profitable to exercise).
Lot Size: Options are traded in lots (e.g., Nifty option has a fixed lot of 50 units).
Leverage: Options allow control of large positions with smaller capital.
How Options Work
Options are like insurance. Imagine you own a house worth ₹50 lakh and buy insurance. You pay a small premium so that if the house burns down, you can recover your value. Similarly:
A call option is like paying for the right to buy a stock cheaper later.
A put option is like insurance against stock prices falling.

Part 1 Master Candlestick PatternIntroduction to Options Trading
Options trading is one of the most powerful tools in the financial markets. Unlike traditional stock trading, where you buy or sell shares directly, options allow you to control an asset without owning it outright. This gives traders flexibility, leverage, and a wide range of strategies for both profits and risk management.
At its core, an option is a contract that gives the buyer the right, but not the obligation, to buy or sell an underlying asset at a specific price (called the strike price) on or before a certain date (the expiration date).
The beauty of options lies in choice: you can profit whether markets are rising, falling, or even staying flat—if you know how to use them.
What is an Option?
An option is a derivative instrument, meaning its value is derived from the price of another asset (the “underlying”), such as:
Stocks (e.g., Reliance, Apple)
Indexes (e.g., Nifty, S&P 500)
Commodities (e.g., Gold, Oil)
Currencies
Two Main Types of Options:
Call Option – Gives the right to buy the underlying asset.
Put Option – Gives the right to sell the underlying asset.
Example:
A call option on Reliance with a strike price of ₹2500 expiring in one month gives you the right (not the obligation) to buy Reliance shares at ₹2500, regardless of the market price.
A put option with a strike of ₹2500 gives you the right to sell at ₹2500.

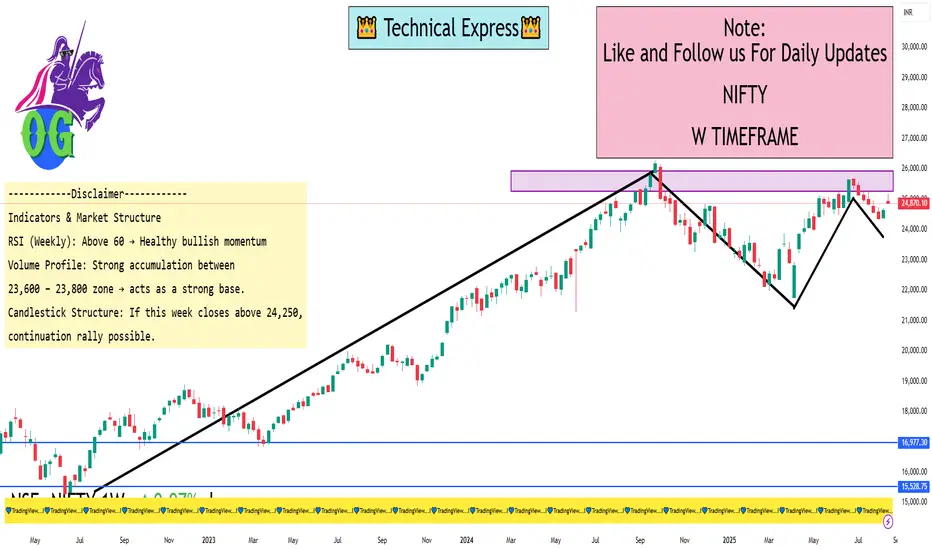
Nifty 1 Week ViewKey Levels (Weekly Time Frame)
Resistance Zones (Upside):
24,250 – 24,300 → Immediate supply zone / resistance
24,500 – 24,600 → Next major resistance (if breakout sustains)
24,850 – 25,000 → Psychological round level + possible profit booking
Support Zones (Downside):
23,950 – 24,000 → Immediate weekly support
23,700 – 23,750 → Strong demand zone (previous breakout level)
23,400 – 23,450 → Deeper support; trend reversal only if broken
Indicators & Market Structure
RSI (Weekly): Above 60 → Healthy bullish momentum, but slightly overbought.
Volume Profile: Strong accumulation between 23,600 – 23,800 zone → acts as a strong base.
Candlestick Structure: If this week closes above 24,250, continuation rally possible. If rejection happens, sideways to mild correction.
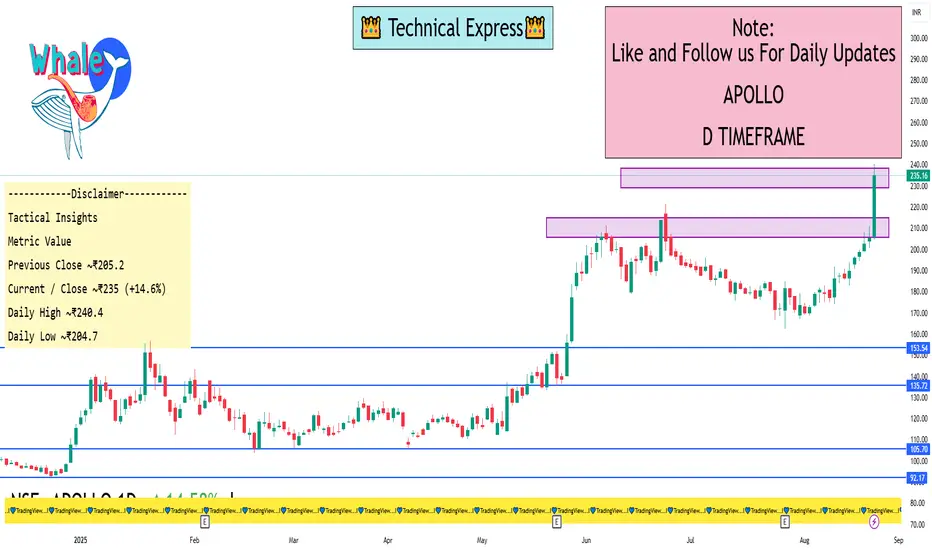
APOLLO 1 Day ViewRecent Catalysts
Apollo Micro Systems saw a significant price spike recently, following an announcement of securing defense contracts worth ₹25.12 crore from DRDO and other public sector undertakings. This triggered a ~15.4% jump in share price and contributed to the new high.
Based on the most recent data:
The current/closing price was around ₹235, up 14.6%, setting a 52-week high of ₹240.40 on August 22, 2025.
Daily high: approximately ₹240.4
Daily low: around ₹204.7
VWAP (Volume-Weighted Average Price): ₹231.79
Volume traded: reported as 88,960,249 shares
Summary Table
Metric Value
Previous Close ~₹205.2
Current / Close ~₹235 (+14.6%)
Daily High ~₹240.4
Daily Low ~₹204.7
VWAP ₹231.79
Volume ~88.96 million shares
Important Trigger Defense order win announcement
BTCUSD 4 Hours View Support Zones & Turning Points
** ~$115,000 Pivot Zone**
A consolidation area around $115,000 (± $600) acts as a short-term support base and momentum gauge.
~$117,430 (4H MA50)
The 50-period moving average on the 4H chart sits near $117,430, serving as a dynamic support level.
Previous ATH zones ($110K–$112K)
These levels have historically flipped as support after bullish retreats.
Resistance & Overhead Supply
$120,000 Psychological Barrier
A major round-number resistance that needs to be overcome for sustained bullish momentum.
$121K–$123K (Current and Previous ATH Range)
These levels remain formidable obstacles, marking the highest recent peaks.
$124,500 Zone
The recent all-time high, now under challenging supply and selling pressure.
Elliott Wave & Retracement Support
~$118,657 (38.2% Fibonacci retracement)
This level aligns with the corrective wave (Wave IV) in the Elliott Wave count, suggesting a solid bounce zone for potential Wave V continuation.

Global Events & Market ImpactIntroduction
Financial markets are like living organisms—sensitive, reactive, and constantly adapting to external influences. While company fundamentals, earnings, and investor psychology play a large role in stock price movements, global events often serve as the real catalysts for dramatic market swings.
A political decision in Washington, a sudden military conflict in the Middle East, a central bank announcement in Europe, or even a natural disaster in Asia can ripple across global financial markets within minutes. In today’s hyper-connected economy, where capital flows across borders instantly and news spreads in real time, no country or investor is fully insulated from worldwide developments.
This article explores in detail how different global events—ranging from geopolitical tensions, pandemics, and trade wars to central bank policies, technological revolutions, and climate change—affect financial markets. We’ll also study both short-term volatility and long-term structural shifts that such events trigger.
1. The Nature of Market Sensitivity to Global Events
Markets are essentially forward-looking. They do not simply react to present conditions but rather try to price in future risks and opportunities. This is why even rumors of a war, speculation about interest rate changes, or forecasts of a hurricane can cause markets to swing before the actual event occurs.
Three key characteristics define market responses to global events:
Speed – In the era of high-frequency trading and global media, reactions can happen within seconds.
Magnitude – The scale of reaction depends on how “systemic” the event is (for example, the 2008 financial crisis vs. a localized earthquake).
Duration – Some events cause short-term panic but markets recover quickly; others reshape the global economy for decades.
2. Categories of Global Events Affecting Markets
Global events can be broadly classified into several categories, each with distinct market impacts:
Geopolitical Events – wars, terrorism, political instability, sanctions, and diplomatic conflicts.
Economic Policies & Central Bank Decisions – interest rate changes, fiscal stimulus, tax reforms.
Global Trade & Supply Chain Disruptions – tariffs, trade wars, port blockages, shipping crises.
Natural Disasters & Climate Change – hurricanes, floods, wildfires, long-term climate risks.
Health Crises & Pandemics – global spread of diseases like COVID-19, SARS, Ebola.
Technological Disruptions – breakthroughs in AI, energy, and digital finance.
Commodity Shocks – sudden movements in oil, gold, or food prices.
Financial Crises & Systemic Shocks – banking collapses, currency devaluations, debt crises.
Let’s examine each in detail.
3. Geopolitical Events
Wars and Conflicts
Wars often cause energy and commodity prices to spike, especially when they involve major producers.
Example: The Russia-Ukraine war (2022) sent oil, gas, and wheat prices soaring, creating inflationary pressures worldwide.
Defense stocks usually rally, while riskier assets like emerging markets decline.
Political Instability
Elections, regime changes, and coups often create uncertainty.
Example: Brexit (2016) caused volatility in the pound sterling, reshaped European equity flows, and influenced global trade policy.
Terrorism
Major attacks (e.g., 9/11) often trigger immediate sell-offs in equity markets, with a flight to safe-haven assets like gold and US Treasury bonds.
4. Economic Policies & Central Banks
Interest Rate Decisions
Central banks like the US Federal Reserve, European Central Bank (ECB), and RBI (India) are powerful drivers of markets.
When rates rise, borrowing becomes expensive, which usually depresses stock markets but strengthens the currency.
Conversely, rate cuts often boost equities but weaken currencies.
Quantitative Easing (QE)
During crises (2008, COVID-19), central banks injected liquidity into markets, which drove asset prices upward.
Fiscal Stimulus & Taxation
Government spending plans, subsidies, or corporate tax cuts influence corporate earnings expectations and therefore stock valuations.
5. Global Trade & Supply Chains
Trade Wars
Example: The US-China trade war (2018–2019) disrupted global technology and manufacturing supply chains, causing volatility in stock markets and commodity markets.
Supply Chain Disruptions
COVID lockdowns in China created shortages in semiconductors and other goods, which impacted global auto and electronics industries.
Shipping & Logistics
Events like the Suez Canal blockage (2021) caused billions in losses and exposed how dependent markets are on smooth global logistics.
6. Natural Disasters & Climate Change
Natural Disasters
Hurricanes, tsunamis, or earthquakes often create localized stock market declines.
Example: The 2011 Japan earthquake & Fukushima nuclear disaster had global impacts on energy and auto supply chains.
Climate Change
Increasingly, investors are pricing climate risk into valuations.
Companies in fossil fuel industries face long-term risks, while renewable energy firms attract capital.
ESG (Environmental, Social, Governance) investing has emerged as a global trend.
7. Health Crises & Pandemics
COVID-19 (2020–2022)
One of the most impactful global events in modern history.
Stock markets initially crashed in March 2020 but rebounded sharply due to massive fiscal and monetary support.
Certain sectors like airlines, hotels, and oil were devastated, while tech and healthcare boomed.
Past Examples
SARS (2003) hit Asian markets temporarily.
Ebola (2014) affected African economies but had limited global effect compared to COVID.
8. Technological Disruptions
Innovations Driving Markets
The dot-com bubble (1999–2000) showed how technology hype can inflate markets.
More recently, AI and EV (Electric Vehicles) have created massive rallies in companies like Nvidia and Tesla.
Risks from Technology
Cyberattacks on financial institutions or major corporations can cause sudden market dips.
Example: Ransomware attacks or hacking of exchanges.
9. Commodity Shocks
Oil Price Volatility
Oil remains one of the most geopolitically sensitive commodities.
Example: The 1973 oil crisis caused stagflation globally.
In 2020, oil futures briefly turned negative due to demand collapse.
Gold as a Safe Haven
During uncertainty, gold prices usually rise.
Investors view it as a hedge against inflation, currency depreciation, and geopolitical risks.
Food Commodities
Droughts or export bans (e.g., India restricting rice exports) can push global food inflation higher.
10. Financial Crises & Systemic Shocks
Global Financial Crisis (2008)
Triggered by the collapse of Lehman Brothers, this event led to the worst global recession since the Great Depression.
Stock markets fell over 50%, but also created long-term changes in regulation and central bank behavior.
Asian Financial Crisis (1997)
Currency devaluations in Thailand, Indonesia, and South Korea triggered capital flight and market crashes.
European Debt Crisis (2010–2012)
Greece’s sovereign debt problems shook confidence in the Eurozone and created long-term structural reforms.
Conclusion
Global events are unavoidable in financial markets. While some are unpredictable “black swan” shocks, others evolve slowly, giving investors time to adjust. Understanding how markets react to wars, pandemics, central bank decisions, and technological disruptions can help investors navigate uncertainty more effectively.
In the short term, markets may appear chaotic. But history shows that crises often accelerate long-term transformations in economies and industries. The winners are those who maintain discipline, manage risk, and adapt strategies as global dynamics shift.

Trading Plan & JournalingIntroduction
The financial markets are often described as a battlefield where only the disciplined survive. Traders from all walks of life enter this arena, each armed with different strategies, mindsets, and risk appetites. However, history shows that the majority of traders lose money in the long run—not because the markets are unbeatable, but because they lack structure and discipline.
Two of the most powerful tools for achieving consistency and long-term profitability are:
A Trading Plan – the strategic blueprint that guides every action in the market.
A Trading Journal – the mirror that reflects one’s behavior, decisions, and growth as a trader.
Together, they form the foundation of professional trading. Without them, traders are prone to emotional decision-making, impulsive trades, and recurring mistakes.
This guide will deeply explore both concepts in detail, breaking them into digestible parts, supported by examples, techniques, and psychological insights.
Part I – The Trading Plan
1. What is a Trading Plan?
A trading plan is a written, structured framework that outlines how a trader will approach the market. It defines entry and exit strategies, risk management rules, trading goals, and performance evaluation metrics.
Think of it as the business plan of a trader. Just like a company can’t run without a business plan, a trader cannot succeed long term without a trading plan.
2. Why Do You Need a Trading Plan?
Eliminates guesswork – prevents random or impulsive trades.
Brings consistency – ensures that you execute your strategy the same way every time.
Controls emotions – reduces the impact of fear and greed.
Improves risk management – avoids catastrophic losses.
Helps evaluation – allows you to track results and refine your strategy.
Without a trading plan, traders end up chasing tips, rumors, and news blindly—leading to inconsistent results.
3. Components of a Trading Plan
A solid trading plan should cover the following areas:
A. Personal Assessment
Before crafting strategies, a trader must understand themselves.
Risk tolerance – how much can you afford to lose per trade?
Time availability – are you a full-time day trader, part-time swing trader, or long-term investor?
Psychological strengths and weaknesses – are you patient, disciplined, or easily distracted?
B. Market Selection
Define which markets and instruments you will trade:
Equities (large-cap, mid-cap, small-cap)
Forex
Commodities
Indices
Options & derivatives
Focusing on a limited set of instruments helps you specialize rather than becoming a jack of all trades.
C. Trading Strategy
This section answers the “How” of trading.
Technical approach (candlestick patterns, moving averages, volume profile, market structure).
Fundamental analysis (earnings reports, macroeconomic data).
Hybrid approach (combining both).
Each setup should be clearly defined:
Conditions for entry.
Stop-loss placement.
Profit targets or trailing stops.
Position-sizing rules.
D. Risk & Money Management
The most crucial element. Decide:
Maximum risk per trade (commonly 1–2% of account size).
Maximum daily/weekly drawdown before stopping.
Position sizing formula (e.g., fixed percentage, volatility-based sizing).
Risk-reward ratio (minimum 1:2 or better).
E. Trade Management
Scaling in and out of trades.
Adjusting stop-loss as price moves in your favor.
Handling trades that gap overnight.
F. Trading Schedule
Decide when you’ll trade:
Day trading → during market hours.
Swing trading → end-of-day analysis.
Long-term investing → weekly/monthly review.
G. Performance Evaluation
Set measurable goals:
Win rate (%)
Average profit per trade
Risk-reward ratio
Monthly return target
Maximum acceptable drawdown
4. Example of a Simple Trading Plan
Trader Type: Swing trader
Market: Nifty 50 stocks
Strategy: Trade only bullish engulfing & hammer candlestick patterns near support zones.
Entry Rule: Buy at confirmation candle with above-average volume.
Stop-loss: Below support or candle low.
Target: 2x risk.
Risk Management: 1% per trade, max 3 trades per day.
Review: Weekly journal analysis to refine entries/exits.
5. Mistakes Traders Make with Trading Plans
Not writing it down (keeping it “in the head”).
Overcomplicating strategies.
Ignoring rules when emotions take over.
Constantly changing the plan after small losses.
A plan only works if you follow it with discipline.
Part II – The Trading Journal
1. What is a Trading Journal?
A trading journal is a written or digital record of all trades taken, along with notes on reasoning, emotions, and outcomes. It’s like a diary for traders, where every action in the market is logged for review.
2. Why Keep a Trading Journal?
Identifies strengths & weaknesses – shows what’s working and what isn’t.
Tracks emotional state – helps detect patterns of impulsive trades.
Improves accountability – forces you to justify every trade.
Sharpens discipline – prevents repeating mistakes.
Boosts confidence – reinforces good habits by showing progress.
3. Components of a Trading Journal
A good journal records both quantitative and qualitative data.
Quantitative Data (Numbers):
Date & time of trade
Asset traded
Entry price, exit price, stop-loss, target
Position size
Profit/loss in % and amount
Risk-reward ratio
Qualitative Data (Thoughts & Emotions):
Reason for taking trade
Market conditions (trend, volatility, news)
Emotional state (confident, fearful, greedy)
Mistakes made (if any)
Lessons learned
4. Tools for Trading Journaling
Excel/Google Sheets – customizable, easy to analyze.
TradingView screenshots – annotate charts for visual learning.
Dedicated software – Edgewonk, TraderSync, or simple Notion templates.
Pen & paper – traditional, but effective for emotional notes.
5. Example Trading Journal Entry
Date: 20 Aug 2025
Stock: Infosys
Setup: Bullish engulfing near 200 DMA + support zone.
Entry: ₹1550
Stop-loss: ₹1530
Target: ₹1590 (2:1 RR)
Result: Exited at ₹1585, profit ₹35/share.
Emotion: Felt confident but exited early due to fear of reversal.
Lesson: Stick to plan; don’t book profits too soon.
6. Reviewing Your Journal
The real power of journaling lies in reviewing it regularly.
End of week → review all trades taken.
End of month → calculate win rate, average RR, emotional mistakes.
Quarterly → refine strategy based on data.
Patterns will emerge. For example:
You may find most profits come from trend-following trades, while counter-trend trades lose money.
You may notice losses increase when you trade after 3 consecutive wins (overconfidence).
You may realize that impulsive entries happen more often when you skip morning preparation.
7. Common Mistakes with Journals
Not recording losing trades (only writing about wins).
Writing vague reasons (“felt good about this trade”).
Not reviewing the journal frequently.
Treating it as a chore instead of a learning tool.
Part III – Psychology, Discipline & Growth
A trading plan and journal are useless without the right mindset.
1. Emotional Control
Markets constantly test patience, greed, and fear. A plan provides structure, while a journal helps spot recurring psychological pitfalls.
2. The Role of Discipline
Discipline is simply the act of sticking to your plan regardless of temptation. The journal is your accountability partner.
3. Growth Mindset
Losses are inevitable. Journaling turns losses into lessons, making them investments in education rather than failures.
4. The Feedback Loop
Execute trades according to plan.
Record them in the journal.
Review & identify improvements.
Refine the trading plan.
This cycle creates continuous improvement.
Part IV – Practical Tips for Success
Start simple – don’t overload your plan/journal with unnecessary data.
Use screenshots – visual memory is stronger than written notes.
Reward yourself – celebrate when you stick to your plan, even on losing trades.
Keep emotions in check – note them honestly, even if embarrassing.
Backtest strategies – before adding to your plan, test them historically.
Conclusion
A trader without a plan and journal is like a ship sailing without a compass—drifting aimlessly in stormy seas. The combination of a well-structured trading plan and a disciplined journaling practice transforms trading from a gamble into a business.
The plan gives direction.
The journal provides feedback.
Together, they create consistency, accountability, and growth.
Successful trading is not about predicting the market perfectly—it’s about managing risk, executing with discipline, and learning continuously.
If you dedicate yourself to creating and following your trading plan, while diligently maintaining a journal, you’ll find yourself ahead of 90% of traders who rely solely on intuition.

Part3 Trading MasterclassOption Trading vs Stock Trading
Stocks = Ownership, long-term growth, dividends.
Options = Contracts, leverage, flexible strategies.
Stocks = Simpler, but capital-intensive.
Options = Complex, but require less capital and offer hedging.
For example:
Buying 100 shares of Reliance at ₹2500 = ₹2,50,000.
Buying 1 call option of Reliance at ₹100 premium with lot size 250 = only ₹25,000.
This leverage makes options attractive—but also riskier.
Real-Life Examples & Case Studies
Case 1: Bull Market
A trader buys Nifty 20000 Call at ₹200 premium. Nifty rallies to 20500. Profit = ₹300 (500 – 200). Huge return on a small premium.
Case 2: Bear Market
Investor holds TCS shares but fears a fall. Buys a protective put. When stock drops, put increases in value, reducing losses.
Case 3: Neutral Market
Trader sells an Iron Condor on Bank Nifty, betting price will stay range-bound. Premium collected = profit if market stays sideways.

Part 1 Trading MasterclassRisks & Rewards in Option Trading
Option trading can be thrilling, but it’s not without risks.
For Buyers:
Maximum loss = premium paid.
Maximum profit = potentially unlimited (for calls) or huge (for puts).
For Sellers:
Maximum gain = premium received.
Maximum loss = unlimited (for calls) or very large (for puts).
Risks also come from:
Time decay (options lose value daily).
Volatility crush (sudden drop in implied volatility can reduce premiums).
Liquidity issues (wide bid-ask spreads can hurt execution).
That’s why risk management (stop-losses, proper sizing, hedging) is crucial.
Option Trading vs Stock Trading
Stocks = Ownership, long-term growth, dividends.
Options = Contracts, leverage, flexible strategies.
Stocks = Simpler, but capital-intensive.
Options = Complex, but require less capital and offer hedging.
For example:
Buying 100 shares of Reliance at ₹2500 = ₹2,50,000.
Buying 1 call option of Reliance at ₹100 premium with lot size 250 = only ₹25,000.
This leverage makes options attractive—but also riskier.

Divergence SecretsRisks & Rewards in Option Trading
Option trading can be thrilling, but it’s not without risks.
For Buyers:
Maximum loss = premium paid.
Maximum profit = potentially unlimited (for calls) or huge (for puts).
For Sellers:
Maximum gain = premium received.
Maximum loss = unlimited (for calls) or very large (for puts).
Risks also come from:
Time decay (options lose value daily).
Volatility crush (sudden drop in implied volatility can reduce premiums).
Liquidity issues (wide bid-ask spreads can hurt execution).
That’s why risk management (stop-losses, proper sizing, hedging) is crucial.
Option Trading vs Stock Trading
Stocks = Ownership, long-term growth, dividends.
Options = Contracts, leverage, flexible strategies.
Stocks = Simpler, but capital-intensive.
Options = Complex, but require less capital and offer hedging.
For example:
Buying 100 shares of Reliance at ₹2500 = ₹2,50,000.
Buying 1 call option of Reliance at ₹100 premium with lot size 250 = only ₹25,000.
This leverage makes options attractive—but also riskier.

Option Trading Option Pricing & The Greeks
Options are not priced randomly. Their value comes from several factors:
Intrinsic Value: The real, tangible value (difference between stock price and strike).
Time Value: Extra premium paid for the possibility of future movement.
Volatility: The higher the uncertainty, the higher the option premium.
Option Greeks – the essential toolkit:
Delta – Measures how much an option’s price changes with a change in stock price. (Think: sensitivity to price).
Gamma – Measures how much Delta itself changes.
Theta – Time decay. Shows how much an option loses value each day as expiration approaches.
Vega – Sensitivity to volatility. Higher volatility = higher option price.
Rho – Sensitivity to interest rates (less relevant for short-term traders).
Understanding Greeks is like knowing the gears of a car—they help control risk.
Option Trading Strategies
Here’s where things get exciting. Options are like Lego blocks—you can combine them in different ways to create powerful strategies.
A. Basic Strategies
Buying Calls – Bullish bet.
Buying Puts – Bearish bet.
Covered Call – Holding a stock and selling calls to earn income.
Protective Put – Owning stock and buying puts to insure against loss.
B. Intermediate Strategies
Straddle – Buy a call + put at same strike, betting on big movement (either direction).
Strangle – Similar to straddle but different strikes, cheaper.
Bull Call Spread – Buy one call, sell a higher strike call. Profits capped but cheaper.
Bear Put Spread – Buy a put, sell lower strike put.
C. Advanced Strategies
Iron Condor – Selling an OTM call spread + OTM put spread, betting on low volatility.
Butterfly Spread – Combining multiple options to profit if stock stays near a target price.
Calendar Spread – Exploiting time decay by selling short-term and buying long-term options.
Each strategy has a risk-reward profile and works best in specific market conditions.
