Part 1 Support and Resistance1. Introduction to Options
In the world of financial markets, traders and investors use various tools to manage risk, speculate on price movements, or generate additional income. One of the most powerful and flexible tools is options trading.
An option is a financial derivative, which means its value is derived from another underlying asset. This underlying asset could be a stock, an index, a commodity, or even a currency. Unlike stocks, where you own a piece of the company, an option is a contract that gives you certain rights related to buying or selling the underlying asset at a specific price and within a specified time.
Options are incredibly versatile. Traders use them for hedging (protection against loss), speculation (betting on future price moves), or income generation (selling options for premiums). But with great flexibility comes complexity, and that’s why understanding option trading deeply is essential before jumping in.
2. Basic Terminology in Option Trading
Before diving deep, let’s clear some essential terms:
Call Option: A contract giving the right (not obligation) to buy an asset at a predetermined price (strike price) before expiration.
Put Option: A contract giving the right (not obligation) to sell an asset at a predetermined price before expiration.
Strike Price: The fixed price at which the option holder can buy (for calls) or sell (for puts) the underlying.
Premium: The cost of purchasing an option contract. This is the price paid upfront by the buyer to the seller (writer).
Expiration Date: The date when the option contract expires. After this, the option becomes worthless if not exercised.
In the Money (ITM): An option that has intrinsic value. For calls, when the stock price > strike price. For puts, when stock price < strike price.
Out of the Money (OTM): An option with no intrinsic value (only time value). For calls, stock price < strike price. For puts, stock price > strike price.
At the Money (ATM): When the stock price and strike price are roughly equal.
Option Writer: The seller of the option contract. They receive the premium but take on obligation.
Lot Size: Options are traded in fixed quantities called lots (e.g., 50 or 100 shares per contract depending on the market).
Understanding these terms is like learning the alphabet before writing sentences—you need them to progress.
AXISBANK

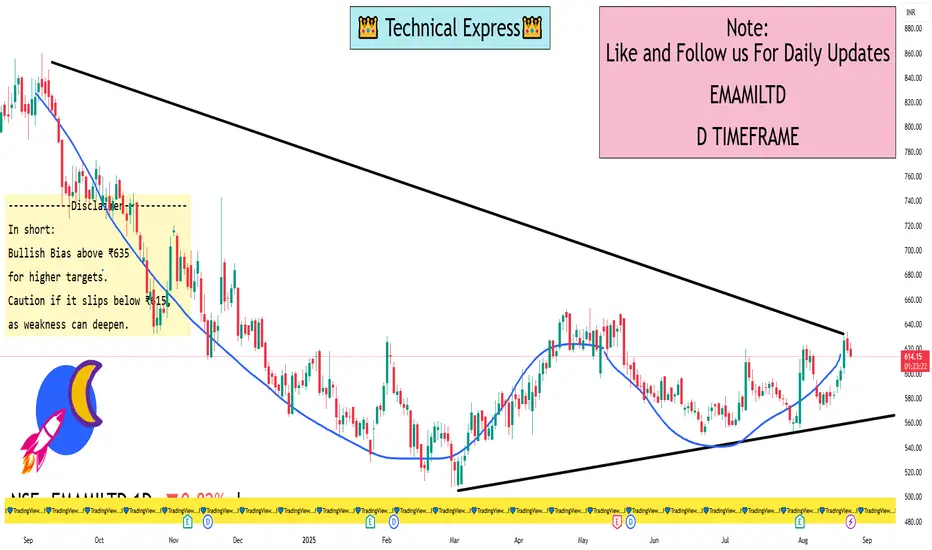
EMAMI 1 Day ViewEmami Ltd – Daily Levels
Current Market Structure: Stock is trading in a consolidation range after a recent upward move. Momentum is steady but showing mild profit-booking near resistance.
🔑 Key Levels
Support Zones
₹615 – Strong near-term support, recent demand zone.
₹600 – Major support, breakdown below may invite weakness.
₹585 – Next cushion if selling extends.
Resistance Zones
₹635 – Immediate resistance (recent supply zone).
₹648 – Breakout level; above this stock may gain momentum.
₹660+ – Next bullish target if breakout sustains.
Trend Outlook
Above ₹635 → Momentum buyers may push toward ₹648–660.
Below ₹615 → Weakness may drag it back toward ₹600–585.
📌 Indicators View
Volume: Decreasing, showing consolidation.
RSI (Daily): Near neutral zone (~50–55), showing balanced momentum.
200 DMA: Stock trading comfortably above it, indicating long-term bullishness intact.
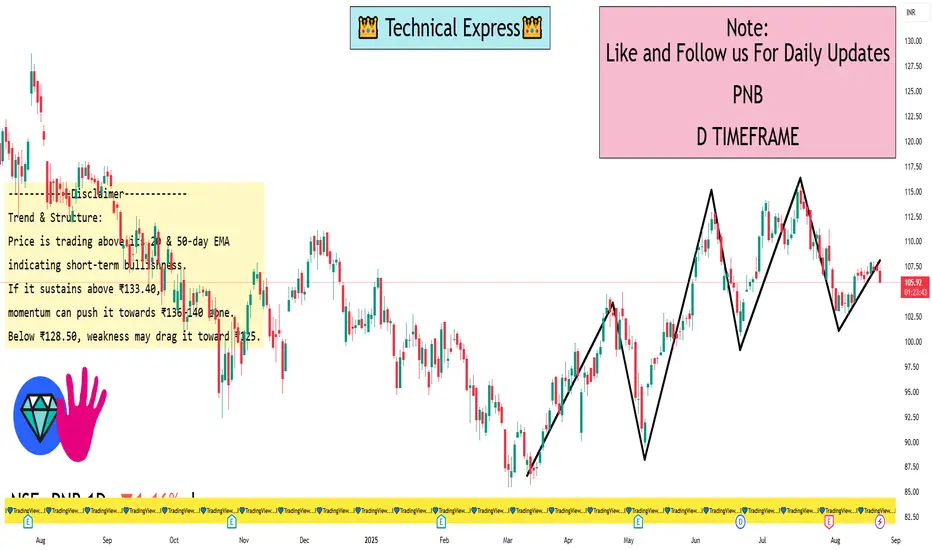
PNB 1 Day ViewSupport Levels:
₹128.50 – Immediate support (recent swing low)
₹125.20 – Strong demand zone
₹121.80 – Major support
Resistance Levels:
₹133.40 – Immediate hurdle
₹136.20 – Strong resistance (recent high area)
₹140.00 – Psychological & breakout level
📈 Trend & Structure:
Price is trading above its 20 & 50-day EMA, indicating short-term bullishness.
If it sustains above ₹133.40, momentum can push it towards ₹136–140 zone.
Below ₹128.50, weakness may drag it toward ₹125.
EIEL 1 Day ViewPrice Action Snapshot (22 Aug 2025)
According to Moneycontrol, the current day’s trading range for EIEL is ₹260.95 – ₹274.00.
Investing.com data confirms a real-time price of ₹268.30, with the same daily range and a 52-week range of ₹182.00–₹391.60.
Economic Times reports a 1-day return of +3.3%, with the current price around ₹268.05–₹268.30.
Technical Signals
TradingView labels the 1-day technical rating for EIEL as Neutral, based on a combination of oscillators and moving averages.
Investing.com India provides a more bullish interpretation:
RSI (14-day): ~69.38 — indicating a "Buy" zone.
MACD: 3.060 — a bullish signal.
All moving averages (5-, 50-, 200-day) are suggesting "Buy".
Overall, the daily technical outlook is “Strong Buy”.
What Does "L 1 Day Time Frame Level" Mean?
You might be exploring the technical level or sentiment over a 1-day timeframe for EIEL. From the data:
TradingView summarizes the technical indicators as Neutral.

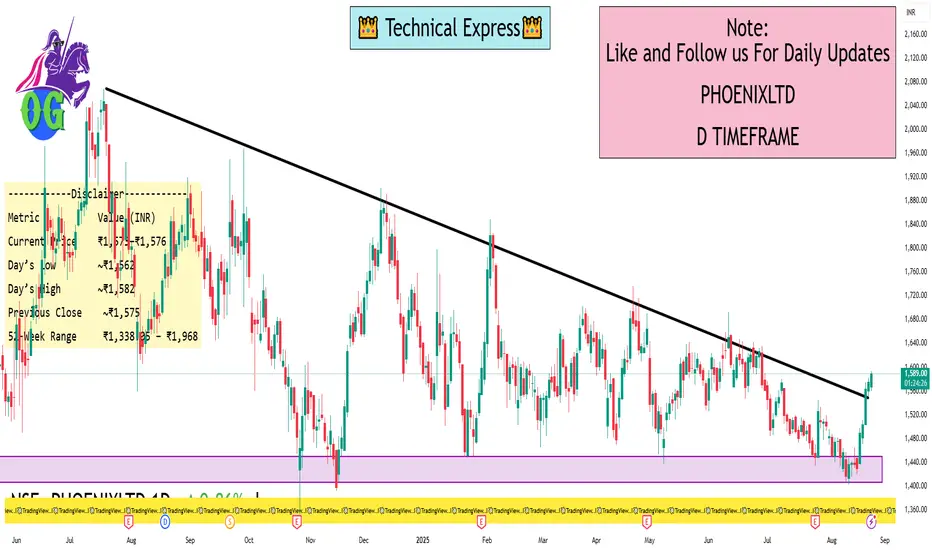
Phoenix 1 Day ViewHere’s a summary of the latest intraday data:
Current price: Approximately ₹1,573.00–₹1,576.00
Daily range: Between ₹1,562.00 (low) and ₹1,582.50 (high)
Previous closing price: Around ₹1,575.50
52-week range: ₹1,338.05 — ₹1,968.00
Specifically:
TradingView reports a current price of ₹1,575.50, showing a gain of ~0.76% in the last 24 hours. Day’s range is consistent with ₹1,562.00–₹1,582.50
Screener shows the price at ₹1,573 as of 10:44 a.m. IST today
Investing.com indicates the stock is trading at ₹1,575.50, with day’s range and 52-week range matching other sources
Financial Times Markets Data confirms intraday trading between ₹1,560.40 and ₹1,582.50, with previous close at₹1,575.00
Suggested Next Steps
Charting Platforms – Sites like TradingView, Investing.com, or Moneycontrol offer real-time intraday charts. These let you analyze key levels such as open, high, low, VWAP, and volume trends.
Technical Indicators – To identify support and resistance, you might want to apply indicators like moving averages (e.g., 20/50 EMA), RSI, or VWAP.
Alerts and Watchlists – Set price alerts around critical levels (e.g., ₹1,562 or ₹1,582) to stay informed of key moves.
Volume Analysis – Intraday volume can confirm the strength behind any move—higher volume on breakouts or dips is particularly telling.
Types of Financial MarketsIntroduction
Finance is the backbone of any economy, and at the center of this financial ecosystem lie the financial markets. These markets serve as platforms where buyers and sellers engage in the exchange of financial instruments such as stocks, bonds, currencies, derivatives, and commodities. They enable efficient capital allocation, liquidity creation, and wealth distribution in an economy.
Understanding financial markets is crucial for investors, traders, policy makers, and even the general public because these markets influence everything from government policies to personal investment decisions.
Broadly, financial markets can be categorized into several types based on the instruments traded, the maturity of securities, the nature of participants, and the purpose they serve.
In this article, we will explore:
The functions of financial markets
Major types of financial markets
Examples and their relevance in the real economy
Advantages and challenges of each type
How they interconnect to form the global financial system
Functions of Financial Markets
Before diving into the types, let’s understand why financial markets exist and what purpose they serve:
Capital Formation: They channel funds from savers (households, institutions) to borrowers (businesses, governments).
Liquidity: They provide an avenue to convert financial instruments into cash quickly.
Price Discovery: Markets determine the fair value of financial instruments through demand and supply forces.
Risk Management: Through derivatives and insurance-like instruments, investors can hedge against risks.
Efficient Allocation of Resources: Funds flow toward businesses and projects with the most promising prospects.
Economic Growth: They support industrial expansion, innovation, and employment by financing new ventures.
Broad Classification of Financial Markets
Financial markets can be broadly divided into two categories:
Money Market – Deals with short-term funds (less than one year).
Capital Market – Deals with long-term funds (more than one year).
From here, multiple subcategories exist, including stock markets, bond markets, forex markets, derivatives markets, and commodity markets.
1. Money Market
The money market is where short-term borrowing and lending take place, usually for periods of less than one year. It is essential for maintaining liquidity in the financial system.
Instruments in the Money Market
Treasury Bills (T-Bills): Issued by the government to raise short-term funds. They are risk-free and highly liquid.
Commercial Papers (CPs): Short-term unsecured promissory notes issued by corporations.
Certificates of Deposit (CDs): Issued by banks, offering fixed returns over short maturities.
Repurchase Agreements (Repos): Short-term loans where securities are sold with an agreement to repurchase later.
Call Money Market: Interbank lending for very short durations (even overnight).
Importance
Provides liquidity to banks and institutions.
Helps governments manage short-term funding needs.
Facilitates monetary policy operations by central banks.
2. Capital Market
The capital market deals with medium to long-term financing. It is divided into primary markets (new securities issued) and secondary markets (trading of existing securities).
A. Primary Market
Companies issue Initial Public Offerings (IPOs) to raise funds.
Governments issue bonds for infrastructure or development projects.
Investors provide funds directly to businesses.
B. Secondary Market
Existing securities (stocks, bonds) are traded among investors.
Provides liquidity and exit opportunities for investors.
Examples: NSE, BSE, NYSE, NASDAQ, LSE.
Functions
Mobilizes savings into investments.
Provides companies with access to long-term funding.
Encourages corporate growth and expansion.
3. Stock Market (Equity Market)
The stock market is perhaps the most well-known type of financial market. It deals with the buying and selling of company shares.
Types
Primary Stock Market: Where companies issue new shares (IPOs, FPOs).
Secondary Stock Market: Where existing shares are traded.
Key Global Stock Exchanges
New York Stock Exchange (NYSE) – USA
NASDAQ – USA
London Stock Exchange (LSE) – UK
Bombay Stock Exchange (BSE) – India
National Stock Exchange (NSE) – India
Tokyo Stock Exchange (TSE) – Japan
Importance
Helps companies raise equity capital.
Provides investors with wealth creation opportunities.
Reflects economic conditions of a country.
4. Bond Market (Debt Market)
The bond market (or debt market) is where governments, corporations, and institutions issue debt securities to raise capital.
Types of Bonds
Government Bonds (Sovereign Bonds): Risk-free, issued to fund government expenditure.
Corporate Bonds: Issued by companies for long-term financing.
Municipal Bonds: Issued by local governments for projects like schools or infrastructure.
Convertible Bonds: Can be converted into equity at a later date.
Role
Provides predictable returns to investors.
Allows governments to finance fiscal deficits.
Offers diversification to investors who seek lower risk than equities.
5. Derivatives Market
The derivatives market deals with financial contracts whose value is derived from underlying assets such as stocks, bonds, commodities, or currencies.
Types of Derivatives
Futures Contracts: Agreement to buy/sell at a future date at a predetermined price.
Options Contracts: Right, but not obligation, to buy/sell at a specific price.
Swaps: Exchange of cash flows (e.g., interest rate swaps, currency swaps).
Forwards: Customized contracts between two parties.
Importance
Helps manage risk (hedging).
Provides leverage opportunities for traders.
Facilitates price discovery.
6. Foreign Exchange (Forex) Market
The Forex market is the world’s largest financial market, where currencies are traded.
Key Features
Decentralized, operates 24/7 globally.
Daily turnover exceeds $7 trillion (2025 estimate).
Major currency pairs: EUR/USD, GBP/USD, USD/JPY, USD/INR.
Participants
Central banks
Commercial banks
Corporations
Hedge funds
Retail traders
Importance
Facilitates global trade and investment.
Provides a mechanism for hedging currency risks.
Enables speculation on exchange rate movements.
7. Commodity Market
The commodity market deals with raw materials and primary products such as gold, silver, oil, natural gas, agricultural products, and metals.
Types
Hard Commodities: Metals, oil, natural resources.
Soft Commodities: Agricultural products like coffee, wheat, sugar.
Examples of Commodity Exchanges
MCX (Multi Commodity Exchange) – India
NCDEX (National Commodity & Derivatives Exchange) – India
CME (Chicago Mercantile Exchange) – USA
LME (London Metal Exchange) – UK
Importance
Enables producers and consumers to hedge against price fluctuations.
Provides opportunities for traders and investors.
Plays a vital role in inflation and cost-of-living measures.
8. Insurance Market
The insurance market is a specialized financial market that provides risk protection.
Individuals and businesses pay premiums to insurance companies.
Insurers pool risks and pay claims in case of insured events.
Examples: Life insurance, health insurance, property insurance, reinsurance.
9. Mortgage Market
This market deals with loans secured by real estate (housing or commercial properties).
Primary Mortgage Market: Direct lending between banks and borrowers.
Secondary Mortgage Market: Mortgages are bundled and sold as securities (Mortgage-Backed Securities – MBS).
The 2008 Global Financial Crisis highlighted the risks in this market when mortgage-backed securities collapsed.
10. Cryptocurrency Market
A relatively new market, cryptocurrencies operate on blockchain technology.
Examples
Bitcoin (BTC)
Ethereum (ETH)
Ripple (XRP)
Solana (SOL)
Features
Decentralized and borderless.
Volatile but offers high returns.
Increasingly gaining mainstream adoption.
Conclusion
Financial markets are the lifeline of modern economies. They are diverse, ranging from traditional stock and bond markets to emerging cryptocurrency and derivative markets. Each type serves a unique function – from providing short-term liquidity to enabling long-term capital formation, risk management, and global trade facilitation.
For individuals, understanding these markets opens up opportunities for wealth creation, portfolio diversification, and financial security. For nations, well-functioning financial markets are critical to sustaining growth, innovation, and stability.
As economies evolve with digital technologies and globalization, financial markets will continue to expand and innovate, offering both opportunities and challenges.

Difference Between Investing and TradingIntroduction
In the world of finance, two of the most common approaches people take to grow their wealth are investing and trading. At first glance, these two activities may look similar—both involve putting money into financial instruments like stocks, bonds, mutual funds, or derivatives with the aim of making a profit. However, when we look deeper, the philosophies, time horizons, risk appetites, strategies, and outcomes of investing and trading are very different.
To put it simply:
Investing is about building wealth steadily over time, often with a long-term horizon.
Trading is about taking advantage of short-term opportunities in the market to generate quick returns.
Understanding the difference is essential because choosing the wrong path for your personality, goals, and risk tolerance can not only hurt your financial performance but also cause emotional stress.
This essay will take you through a detailed journey into what investing and trading mean, their similarities, differences, strategies, risks, psychology, and real-world examples, so you can decide which path (or combination) best suits you.
What is Investing?
Investing is the act of committing money for the long term with the expectation of receiving returns in the future. Investors typically focus on assets that are expected to grow steadily over years or decades, such as:
Stocks (Equities) – Shares in companies that appreciate over time and may pay dividends.
Bonds – Fixed-income securities that provide interest.
Mutual Funds/ETFs – Diversified portfolios managed by professionals.
Real Estate – Property investments that generate rental income and appreciate.
Commodities & Precious Metals – Gold, silver, etc., often used as hedges.
The core philosophy of investing is wealth accumulation through compounding. Albert Einstein famously called compounding the "eighth wonder of the world," and investors rely on this principle.
For example:
If you invest ₹1,00,000 at a 12% annual return (average Indian equity market return), in 20 years it grows to over ₹9,64,000. That’s the power of compounding without needing to buy and sell constantly.
Types of Investing
Value Investing – Buying undervalued stocks (e.g., Warren Buffett).
Growth Investing – Focusing on high-growth companies (e.g., tech firms).
Dividend Investing – Choosing companies with steady dividend payouts.
Index/Passive Investing – Investing in index funds for market-average returns.
Mindset of an Investor
Patient, long-term focused.
More concerned with company fundamentals than short-term price moves.
Sees market downturns as opportunities.
“Buy and hold” is the mantra.
What is Trading?
Trading is the act of buying and selling financial instruments within shorter timeframes to capture profits from market fluctuations. Unlike investing, traders don’t usually care about the long-term potential of an asset; they focus on short-term movements driven by demand-supply, news, or technical patterns.
Common Trading Styles
Scalping – Holding positions for seconds to minutes.
Day Trading – Buying and selling within a single trading day.
Swing Trading – Holding for days or weeks to capture medium-term trends.
Position Trading – Holding for weeks to months (a mix between trading and investing).
Tools Traders Use
Technical Analysis: Chart patterns, indicators (RSI, MACD, Bollinger Bands).
Volume Analysis: Understanding buying/selling pressure.
News & Events: Earnings announcements, Fed decisions, global crises.
Risk Management: Stop-loss, position sizing, leverage control.
Mindset of a Trader
Short-term profit focused.
Quick decision-making and adaptability.
High tolerance for risk and volatility.
Needs discipline and emotional control.
Strategies in Investing vs Trading
Investing Strategies
Buy and Hold – Holding quality stocks for decades.
SIP (Systematic Investment Plan) – Regular investments in mutual funds.
Portfolio Diversification – Reducing risk by spreading across assets.
Rebalancing – Adjusting portfolio periodically.
Trading Strategies
Momentum Trading – Riding strong trends.
Breakout Trading – Entering when price breaks support/resistance.
Mean Reversion – Betting price will revert to its average.
Options Strategies – Using derivatives like straddles, spreads, iron condors.
Risks in Investing vs Trading
Investing Risks
Market crashes (e.g., 2008, 2020).
Inflation risk eroding returns.
Poor stock selection (choosing weak companies).
Overconcentration in one asset.
Trading Risks
High volatility losses.
Leverage amplifying both gains and losses.
Overtrading and emotional decisions.
Sudden news shocks (war, government bans).
Key difference: Investors lose slowly, traders can lose instantly.
Psychology of Investing vs Trading
Investor Psychology: Requires patience, belief in long-term growth, ability to ignore short-term volatility. Successful investors avoid panic-selling.
Trader Psychology: Requires emotional discipline, quick thinking, sticking to risk limits, and accepting frequent small losses. Greed and fear are dangerous here.
Both require discipline, but in different ways.
Case Studies
Case Study 1: Investor Success
Warren Buffett invested in Coca-Cola in 1988.
Initial investment: $1.3 billion.
Today’s value: Over $25 billion plus billions in dividends.
Lesson: Patience and compounding create massive wealth.
Case Study 2: Trader Success
Paul Tudor Jones, a famous trader, predicted the 1987 crash.
He shorted the market and earned around $100 million in one day.
Lesson: Quick action, timing, and risk management can lead to big rewards.
Case Study 3: Investor Loss
Many who invested in companies like Enron or Yes Bank without research faced near-total losses.
Case Study 4: Trader Loss
Retail traders using high leverage during COVID crash wiped out accounts overnight.
Which is Better – Investing or Trading?
There’s no universal answer—it depends on your goals:
If you want steady long-term wealth → Choose Investing.
If you want active income and thrill → Choose Trading (but master risk control).
Many professionals do a mix: 80% long-term investing, 20% trading for extra income.
Conclusion
The difference between investing and trading lies in time horizon, mindset, risk tolerance, and strategy. Investing is like planting a tree and waiting for it to grow into a forest. Trading is like surfing waves—you ride them quickly, but must always be alert.
Both paths can be profitable, but both come with risks. The key is knowing yourself: Are you patient and disciplined for long-term gains, or energetic and risk-tolerant for short-term opportunities?
Ultimately, wealth creation often comes from investing, while trading can generate active cash flow if done with discipline. The wisest approach may be blending the two—secure your future with investments, and fuel your present with well-managed trading.
Day Trading vs Swing Trading: A Deep-Dive ComparisonIntroduction
When it comes to trading in the stock market, there are countless strategies, styles, and approaches that traders adopt. Two of the most popular methods among retail and professional traders are day trading and swing trading. Both strategies aim to generate profits from short-term price fluctuations in stocks, forex, commodities, or cryptocurrencies, but they differ significantly in execution, mindset, risk, and lifestyle requirements.
Choosing between day trading and swing trading is like choosing between sprinting and middle-distance running. Both involve running, but the pace, stamina, and strategies differ. Similarly, both day traders and swing traders thrive on short-term price moves, but the way they participate in the market is fundamentally different.
This article explores day trading vs swing trading in depth, covering definitions, key characteristics, advantages, risks, required skills, tools, psychology, and a balanced conclusion to help traders decide which style suits them best.
Chapter 1: Understanding Day Trading
What is Day Trading?
Day trading is the practice of buying and selling financial instruments within the same trading day, often closing all positions before the market closes. The objective is to capture small but frequent price movements. Day traders rarely hold trades overnight, minimizing exposure to overnight risks such as gaps, earnings announcements, or global events.
Characteristics of Day Trading
High Trade Frequency – Dozens or even hundreds of trades per day.
Small Profit Margins – Aim for a few points, ticks, or basis points per trade.
Intra-Day Charts – 1-minute, 5-minute, 15-minute, and sometimes hourly charts are heavily used.
Fast Execution – Requires speed, precision, and often advanced trading software.
Capital Requirement – Higher margins or regulatory requirements (e.g., pattern day trading rule in the U.S.).
Typical Day Trader Workflow
Pre-market preparation: Analyzing news, earnings reports, and economic data.
Identifying setups: Using technical indicators, price action, or order flow.
Executing trades: Entering and exiting within minutes or hours.
Risk control: Using tight stop-losses, rarely risking more than 1-2% per trade.
Closing all positions: No overnight holdings.
Example
A day trader sees a stock break above a pre-market resistance level. They buy 500 shares at ₹200, sell them within 15 minutes at ₹202, making ₹1,000 profit. They repeat this process multiple times daily.
Chapter 2: Understanding Swing Trading
What is Swing Trading?
Swing trading is the practice of holding trades for several days to weeks to capture medium-term market moves. Swing traders exploit market “swings” caused by supply-demand imbalances, news-driven momentum, or technical setups.
Characteristics of Swing Trading
Lower Trade Frequency – A few trades per week or month.
Larger Profit Targets – Aim for 5–20% moves, sometimes more.
Daily & Weekly Charts – Focus on higher timeframes like 1D, 4H, or weekly charts.
Overnight Exposure – Positions are held through overnight gaps, earnings, or news.
Capital Efficiency – Can trade with smaller accounts due to lower frequency and lower transaction costs.
Typical Swing Trader Workflow
Scanning markets: Identifying trends, consolidations, or breakouts.
Entry timing: Using technical levels (support/resistance, moving averages).
Position holding: Holding trades for days/weeks until targets are hit.
Risk management: Stop-losses wider than day trading, but risk per trade is carefully calculated.
Review & rebalance: Adjusting positions based on new data or chart setups.
Example
A swing trader notices a stock forming a bullish cup-and-handle pattern. They buy at ₹200 with a stop-loss at ₹190 and a target of ₹230. The trade takes 10 days to hit the target, yielding a 15% profit.
Chapter 3: Advantages & Disadvantages
Advantages of Day Trading
No Overnight Risk – No exposure to after-hours events.
Daily Income Potential – Consistent profits if disciplined.
Leverage Opportunities – Brokers often provide higher intraday leverage.
Skill Development – Sharpens quick decision-making and execution.
Disadvantages of Day Trading
High Stress & Intensity – Demanding lifestyle, mentally exhausting.
High Transaction Costs – Frequent trades increase brokerage and taxes.
Steep Learning Curve – Requires years of practice.
Capital Restrictions – Some markets impose minimum balances (e.g., $25,000 in U.S. for PDT rule).
Advantages of Swing Trading
Flexibility – Suitable for part-time traders with jobs.
Bigger Profit Margins – Larger gains per trade.
Less Stress – No need to watch every tick.
Lower Costs – Fewer transactions, lower fees.
Disadvantages of Swing Trading
Overnight & Weekend Risk – Gap risk due to news or global events.
Slower Results – Waiting days/weeks for trade resolution.
Discipline Required – Avoiding emotional exits during volatility.
Dependence on Trends – Works best in trending markets, struggles in choppy sideways markets.
Chapter 4: Required Skills
Skills for Day Traders
Technical Mastery: Reading candlestick patterns, order flow, momentum indicators.
Execution Speed: Entering/exiting trades instantly.
Emotional Control: Avoiding overtrading, revenge trading.
Adaptability: Quickly adjusting strategies based on market conditions.
Skills for Swing Traders
Patience: Waiting for setups and letting trades play out.
Chart Reading: Spotting longer-term patterns, support/resistance.
Risk Management: Wider stops and position sizing.
Fundamental Awareness: Earnings reports, economic cycles, sectoral strength.
Chapter 5: Lifestyle Differences
Day Trader’s Lifestyle
Rigid schedule, glued to screens.
Highly stressful, like a high-pressure job.
Potentially lucrative but exhausting.
Swing Trader’s Lifestyle
Flexible, allows another job or business.
More relaxed, less screen time.
Profit cycles are slower, requiring patience.
Chapter 6: Risk & Money Management
Both day trading and swing trading require strict risk management.
Day Traders: Use very tight stop-losses (0.5–1%). Since trades are frequent, even small losses can add up quickly. They usually risk 1% or less of capital per trade.
Swing Traders: Use wider stop-losses (2–5%), but since trade frequency is lower, they can size positions accordingly.
Golden Rule: In both styles, protecting capital is more important than chasing profits.
Chapter 7: Tools & Technology
Day Trading Tools:
Advanced brokers with fast execution.
Real-time scanners and news feeds.
Level 2 market data and order book.
1-min to 15-min charts with volume analysis.
Swing Trading Tools:
Stock screeners and scanners (fundamental + technical).
End-of-day charting platforms.
Alerts for breakouts or moving averages.
Daily/weekly trend analysis.
Chapter 8: Psychology of Day vs Swing Traders
Day Trader Mindset:
Thrives under pressure.
Short attention span but sharp reflexes.
Accepts small wins and small losses.
Needs strong discipline against greed/fear.
Swing Trader Mindset:
Patient and long-term thinker.
Comfortable with delayed gratification.
Can handle volatility and avoid panic exits.
Strong analytical temperament.
Chapter 19: Which One is Better?
There’s no “better” strategy universally—it depends on the trader’s goals, personality, and lifestyle.
Choose Day Trading if:
You can dedicate full-time hours.
You enjoy fast action and adrenaline.
You have sufficient capital to meet margin requirements.
You’re disciplined and thrive in high-stress environments.
Choose Swing Trading if:
You have a job/business and can’t sit in front of screens all day.
You prefer patience over speed.
You’re looking for bigger gains per trade.
You can handle overnight risk.
Conclusion
Day trading and swing trading are like two sides of the same coin. Both aim to capture short-term profits but differ in approach, holding period, required skills, and lifestyle impact. Day trading is fast, stressful, and capital-intensive but offers quick returns. Swing trading is slower, less stressful, and more flexible but comes with overnight risk.
Ultimately, the best trading style is the one aligned with your personality and goals. Many traders experiment with both before settling into the strategy that suits them. Whether you choose the sprint of day trading or the steady stride of swing trading, success depends less on the strategy itself and more on discipline, risk management, and consistency.

Risk Smart, Grow Fast: Survival Guide for Small Account TradersIntroduction
Trading is an arena that excites many with the promise of financial freedom, rapid wealth creation, and independence from traditional jobs. But the harsh truth is that most new traders lose money, especially those starting with small accounts. A small account brings its own set of challenges: limited capital, strict margin restrictions, emotional pressure, and the risk of blowing up quickly. Yet, history and countless success stories prove that small accounts can grow into big ones—if approached with discipline, risk management, and strategy.
This survival guide is written with one mission: to help small account traders trade smart, protect their capital, and accelerate growth without succumbing to the pitfalls that destroy most beginners.
Chapter 1: The Reality of Trading Small Accounts
Trading with a small account is different from trading with a large one. With limited funds, every decision matters. A small loss feels heavy, a bad trade can wipe out days or weeks of progress, and transaction costs hurt more.
Key challenges small account traders face:
Capital Constraint – With only ₹10,000–₹50,000 (or a few hundred dollars), position sizing becomes tricky. You cannot afford large drawdowns.
Emotional Pressure – Fear of losing and greed for doubling the account often drive impulsive trades.
Leverage Temptation – Brokers offer leverage, but small traders misuse it, leading to margin calls.
Risk of Ruin – One or two bad trades with no stop-loss can blow up the account completely.
Survival begins with accepting this reality: your first goal isn’t to make money fast—it’s to not lose money unnecessarily.
Chapter 2: The Mindset of a Survivor
Most traders fail not because of poor strategies, but because of poor psychology. Small account traders must adopt a “capital preservation” mindset before thinking about profits.
Think Like a Risk Manager – Ask: How much can I lose? before asking How much can I make?
Detach from Ego – Your account size doesn’t define your skill. Stay humble, focus on learning.
Play the Long Game – Compounding works wonders, but only if you survive long enough.
Embrace Boring Consistency – Avoid chasing thrill trades. Professional traders trade boring setups repeatedly.
Chapter 3: Risk Management is Your Lifeline
With a small account, risk management is the difference between survival and destruction.
1. The 1% Rule
Risk no more than 1–2% of your capital on a single trade.
Account: ₹25,000
1% Risk: ₹250
If your stop-loss is 5 points away, you can only take 50 shares.
This way, even after 10 losing trades, you lose only 10% of capital, not the whole account.
2. Stop-Loss is Non-Negotiable
Never enter a trade without a predefined stop-loss. Markets are unpredictable. Stop-loss is your insurance.
3. Position Sizing Formula
Position Size = (Account Risk × % Risk per Trade) ÷ Stop-Loss Distance
This ensures you don’t oversize.
4. Risk/Reward Ratio
Take trades only when reward is at least 2x the risk. Example: risking ₹500 to make ₹1,000.
5. Avoid Overtrading
Chapter 4: Strategies That Work for Small Accounts
Not all strategies are suitable for small traders. Complex multi-leg option spreads, long-term positional trades, or capital-heavy setups may be unfit. Instead, focus on high-probability, low-risk strategies.
1. Scalping with Discipline
Small, quick trades capturing 0.3–1% moves.
Works best in liquid instruments like Nifty, BankNifty, Reliance, HDFC Bank.
Needs strict stop-loss, otherwise one bad trade kills multiple small wins.
2. Breakout Trading
Enter when price breaks strong support/resistance.
High risk/reward if you wait for confirmed breakout with volume.
3. Intraday Option Buying
Cheap premiums, limited risk (premium paid), unlimited potential.
Works best with momentum days after news, events, or opening range breakouts.
4. Swing Trading
Holding positions for 2–10 days with stop-loss.
Helps small traders avoid intraday noise and transaction costs.
5. Volume Profile + Price Action
Identify where institutions are active.
Trade only when market structure supports your bias.
Avoid random entries.
Chapter 5: The Power of Compounding – From Small to Big
Growing a small account requires patience. Let’s see how small consistent returns compound:
₹25,000 with 5% monthly growth → ₹52,700 in 1 year → ₹1.11 lakh in 2 years → ₹2.36 lakh in 3 years.
Compounding turns modest returns into life-changing results.
The key: Protect the downside. Without survival, compounding is impossible.
Chapter 6: Tools & Tactics for Small Account Traders
Broker Selection – Choose brokers with low commissions, no hidden charges, and seamless platforms.
Charting Platforms – Use TradingView or equivalent for better analysis.
Journaling – Record every trade: entry, exit, stop-loss, reasoning. This builds discipline.
Avoid F&O Overexposure – Don’t jump into naked futures without experience.
Cash is Also a Position – Sometimes the best trade is no trade.
Chapter 7: Common Mistakes Small Traders Make
Over-leverage – Blowing up accounts by using margin excessively.
Revenge Trading – Doubling down after a loss to “recover fast.”
No Risk Plan – Trading without stop-loss or risk limits.
Following Tips Blindly – Copying Telegram/WhatsApp calls without analysis.
Impatience – Expecting to turn ₹10,000 into ₹1 lakh in 1 month.
Chapter 8: Building Discipline & Routine
Trading success isn’t about finding a “holy grail strategy.” It’s about developing habits.
Morning Preparation – Identify levels, mark support/resistance.
Defined Trading Hours – Trade only when market is active.
Post-Market Review – Log trades, analyze mistakes.
Mental Fitness – Meditation, walks, or journaling to control emotions.
Consistency in routine = Consistency in profits.
Chapter 9: Scaling Up – When to Increase Lot Size
Don’t rush. Scale gradually.
Rule: Increase position size only when account grows by 25–30%.
Example: If you start with ₹25,000, increase lot size only after reaching ₹32,500+.
Never double size overnight—it kills accounts.
Chapter 10: The Trader’s Code of Survival
To grow fast while being risk smart, every small account trader should follow this code:
Protect capital first, profits second.
Trade only setups with favorable risk/reward.
Never risk more than 1–2% per trade.
Keep emotions in check—stick to plan.
Journal trades, learn continuously.
Compound with patience, scale gradually.
Conclusion
Trading a small account is like sailing a fragile boat in stormy waters—you must be extra cautious, disciplined, and skillful to survive. Many traders fail because they chase fast riches, ignore risk management, and trade emotionally. But those who respect risk, stay patient, and stick to disciplined strategies can not only survive but thrive.
Remember: Your small account isn’t a limitation—it’s your training ground. Survive long enough, grow consistently, and one day, the small account you’re protecting today will be the large account that gives you freedom tomorrow.
Part 6 Institutional Trading When to Use Each Strategy
Bullish Market → Long Call, Bull Call Spread, Covered Call.
Bearish Market → Long Put, Bear Put Spread.
Sideways Market → Iron Condor, Butterfly, Covered Call.
High Volatility → Straddle, Strangle.
Low Volatility → Credit Spreads, Iron Condor.
Risk Management in Options
Options can be dangerous if used blindly. Key risk management rules:
Never sell naked options without hedge (unlimited risk).
Use position sizing – don’t risk more than 2–5% of capital in one trade.
Always track Greeks:
Delta (directional risk),
Theta (time decay),
Vega (volatility risk),
Gamma (rate of change).
Use stop-loss even in options.

Part 4 Institutional Trading Types of Option Strategies
Here’s the heart of the discussion: strategies.
Single-Leg Strategies (Simple & Beginner-Friendly)
a) Long Call (Buying a Call)
View: Bullish
Risk: Limited to premium paid
Reward: Unlimited (theoretically)
Example: Buy Reliance 2800 CE @ ₹50 → If Reliance goes to 2900, profit = ₹50.
b) Long Put (Buying a Put)
View: Bearish
Risk: Limited to premium paid
Reward: Large downside profit potential
Example: Buy Nifty 22,000 PE → If Nifty falls, profit rises.
c) Covered Call
View: Neutral to mildly bullish
How it works: Hold stock + Sell a Call option
Goal: Earn income from option premium
Risk: Stock falls significantly.
d) Cash-Secured Put
View: Neutral to bullish
How it works: Sell a Put with enough cash to buy stock if assigned.
Goal: Collect premium or buy stock cheaper.

Part 3 Institutional Trading Why Traders Use Options
Options are powerful because they can serve three main purposes:
Hedging – Protecting an existing portfolio from adverse price moves.
Example: A long-term investor holding Infosys shares may buy a Put option to protect against a fall.
Speculation – Betting on market direction with limited capital.
Example: Buying a Call if you expect bullish momentum.
Income Generation – Selling options to collect premium regularly.
Example: Writing Covered Calls on stocks you own.
The same instrument (options) can be used very differently by traders with different goals. That’s why strategies matter.
Types of Option Strategies
Here’s the heart of the discussion: strategies.
Single-Leg Strategies (Simple & Beginner-Friendly)
a) Long Call (Buying a Call)
View: Bullish
Risk: Limited to premium paid
Reward: Unlimited (theoretically)
Example: Buy Reliance 2800 CE @ ₹50 → If Reliance goes to 2900, profit = ₹50.
b) Long Put (Buying a Put)
View: Bearish
Risk: Limited to premium paid
Reward: Large downside profit potential
Example: Buy Nifty 22,000 PE → If Nifty falls, profit rises.
c) Covered Call
View: Neutral to mildly bullish
How it works: Hold stock + Sell a Call option
Goal: Earn income from option premium
Risk: Stock falls significantly.
d) Cash-Secured Put
View: Neutral to bullish
How it works: Sell a Put with enough cash to buy stock if assigned.
Goal: Collect premium or buy stock cheaper.

Part 2 Ride The Big MovesBasics of Options
Before jumping into strategies, let’s revisit some fundamentals:
Call Option: Gives the buyer the right to buy the asset at a specific strike price.
Put Option: Gives the buyer the right to sell the asset at a specific strike price.
Option Premium: The price paid to buy an option.
Strike Price: The price at which the underlying can be bought/sold.
Expiry Date: The last date the option can be exercised.
ITM (In-the-Money): Option has intrinsic value (profitable if exercised).
OTM (Out-of-the-Money): Option has no intrinsic value (not profitable if exercised).
ATM (At-the-Money): Strike price is very close to current market price.
💡 Quick Example:
Nifty is at 22,000. You buy a 22,000 Call Option for ₹200 premium. If Nifty rises to 22,500, your option has value (ITM). If Nifty stays flat or goes down, you may lose the premium.
Now, depending on whether you buy or sell Calls/Puts, you can build hundreds of strategies.
Why Traders Use Options
Options are powerful because they can serve three main purposes:
Hedging – Protecting an existing portfolio from adverse price moves.
Example: A long-term investor holding Infosys shares may buy a Put option to protect against a fall.
Speculation – Betting on market direction with limited capital.
Example: Buying a Call if you expect bullish momentum.
Income Generation – Selling options to collect premium regularly.
Example: Writing Covered Calls on stocks you own.
The same instrument (options) can be used very differently by traders with different goals. That’s why strategies matter.

Part 2 Candle Stick Pattern Introduction to Options Trading
In the world of financial markets, traders are always looking for ways to manage risk, generate income, or profit from price movements. Stocks, bonds, and futures are common instruments, but options trading adds a completely new layer of flexibility.
An option is a financial contract that gives the buyer the right, but not the obligation, to buy or sell an underlying asset at a specific price (called the strike price) on or before a certain date (called the expiry date).
Unlike stocks, which represent ownership in a company, options are derivative contracts—their value is derived from the movement of an underlying asset such as Nifty, Bank Nifty, Reliance Industries, Tesla, Gold, Crude Oil, etc.
The beauty of options is that they allow traders to benefit in bullish, bearish, or even sideways markets, depending on the strategy used. That’s why understanding option trading strategies is like learning the different moves in a chess game—you pick the right one for the right situation.
Basics of Options
Before jumping into strategies, let’s revisit some fundamentals:
Call Option: Gives the buyer the right to buy the asset at a specific strike price.
Put Option: Gives the buyer the right to sell the asset at a specific strike price.
Option Premium: The price paid to buy an option.
Strike Price: The price at which the underlying can be bought/sold.
Expiry Date: The last date the option can be exercised.
ITM (In-the-Money): Option has intrinsic value (profitable if exercised).
OTM (Out-of-the-Money): Option has no intrinsic value (not profitable if exercised).
ATM (At-the-Money): Strike price is very close to current market price.
💡 Quick Example:
Nifty is at 22,000. You buy a 22,000 Call Option for ₹200 premium. If Nifty rises to 22,500, your option has value (ITM). If Nifty stays flat or goes down, you may lose the premium.
Now, depending on whether you buy or sell Calls/Puts, you can build hundreds of strategies.

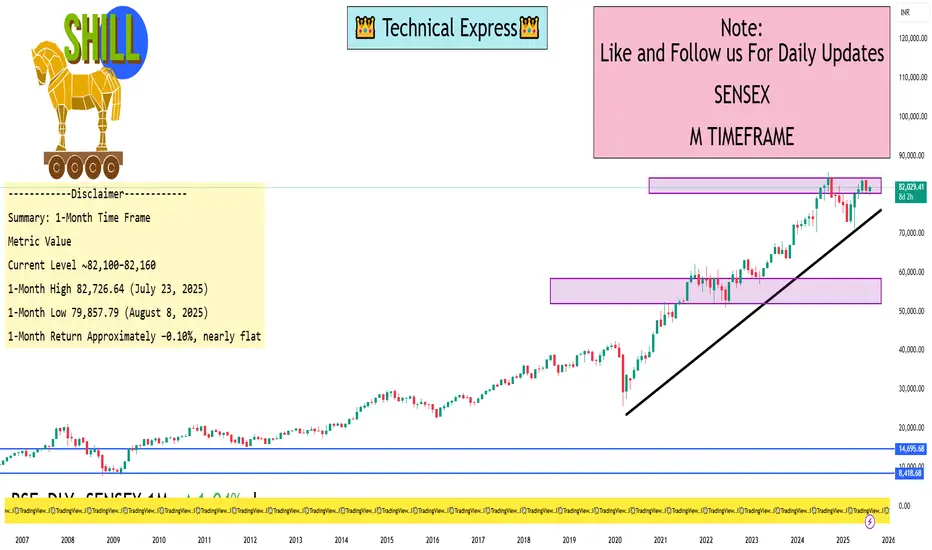
Sensex 1 Month ViewCurrent level: Approximately 82,120–82,160, based on multiple real-time data sources:
82,098.70 (Investing.com)
82,120.55 (Moneycontrol)
One-Month Range & Performance (July 21 – August 21, 2025)
From Investing.com’s detailed historical series:
High (July 23): 82,726.64
Low (August 8): 79,857.79
As for return over the 1-month period:
TradingEconomics reports a –0.10% change
Moneycontrol reports returns of –0.10% for 1 month as well
Summary: 1-Month Time Frame
Metric Value
Current Level ~82,100–82,160
1-Month High 82,726.64 (July 23, 2025)
1-Month Low 79,857.79 (August 8, 2025)
1-Month Return Approximately –0.10%, nearly flat
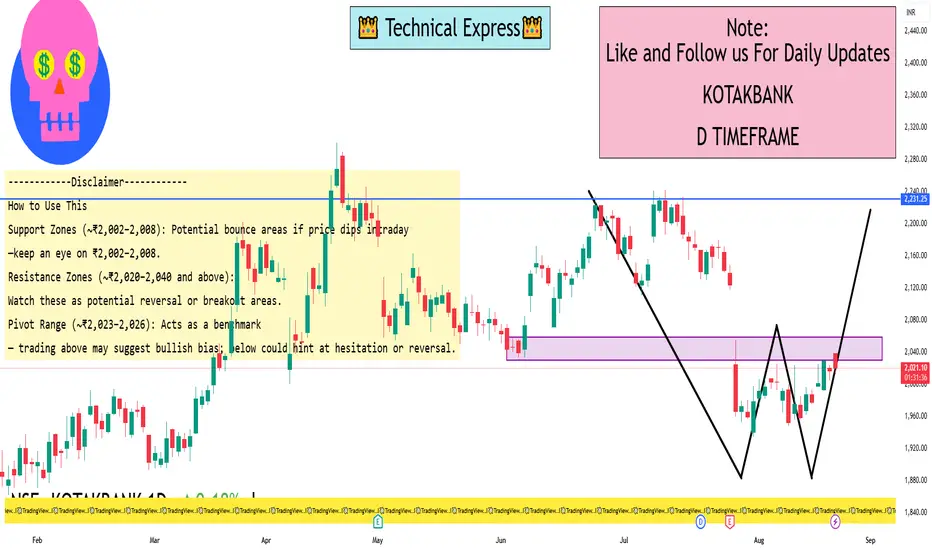
Kotak Bank 1 Day ViewImmediate Support 1: ₹1,815 – ₹1,820 (near short-term demand zone)
Support 2: ₹1,795 (important swing low base)
Support 3: ₹1,770 (major downside protection, if broken momentum can accelerate)
Immediate Resistance 1: ₹1,845 – ₹1,850 (near-term supply zone, multiple rejections)
Resistance 2: ₹1,870 (strong hurdle, breakout level)
Resistance 3: ₹1,895 – ₹1,900 (psychological round number + previous high)
Market Structure Insight
Price is consolidating in a tight range between ₹1,815 – ₹1,850 on the 1-hour chart.
A decisive breakout above ₹1,850 could trigger momentum toward ₹1,870–₹1,900.
A breakdown below ₹1,815 may open room toward ₹1,795–₹1,770.
Volume profile shows higher participation near ₹1,820–₹1,830, meaning it’s the key control zone to watch.
Part 3 Trading Master Class Option Trading in India (2025 Context)
India has seen an explosive rise in options trading. NSE reports show daily options turnover crossing ₹300 trillion in notional value.
Popular contracts:
Nifty 50 Weekly Options
Bank Nifty Weekly Options
FinNifty, Sensex, and Stock Options
Retail traders prefer weekly expiries because they are cheaper and offer fast opportunities. Institutions use monthly contracts for hedging and spreads.
10. Option Trading Psychology
Success in options is not just about strategies; it’s about mindset.
Discipline: Stick to stop-loss and position sizing.
Avoid Greed: Do not sell naked options without risk management.
Patience: Not every day is a trading day.
Continuous Learning: Market conditions and volatility regimes keep changing.

Option Trading Option Greeks – The Core of Option Pricing
Options are complex instruments whose prices change with many factors. To understand price behavior, traders rely on Option Greeks.
Delta (Δ)
Measures sensitivity of option price to underlying asset movement.
Call delta ranges 0 to +1; Put delta ranges 0 to -1.
Example: If Delta = 0.5, a ₹10 stock move increases option price by ₹5.
Theta (Θ)
Time decay. Options lose value as expiry approaches.
Bad for buyers, good for sellers.
Vega (ν)
Sensitivity to volatility. Higher volatility increases option premium.
Gamma (Γ)
Measures change in Delta when the stock price moves.
Rho (ρ)
Sensitivity to interest rate changes (less relevant in short-term trading).
👉 Mastering Greeks is key for professional option traders because they help predict how option premiums will behave under changing conditions.

Part 1 Support And ResistanceIntroduction to Option Trading
The stock market offers multiple instruments to trade and invest—stocks, futures, commodities, currencies, and derivatives. Among these, Options have gained tremendous popularity worldwide because they give traders flexibility, leverage, and strategies to profit in all types of market conditions—bullish, bearish, or even sideways.
At its core, an Option is a contract that gives a buyer the right but not the obligation to buy or sell an asset at a predetermined price (called the strike price) before or on a specific date (called the expiry date).
This right comes at a cost, known as the premium, which is paid by the option buyer to the option seller (also called the writer).
Options are widely traded on stocks, indices, commodities, and currencies. In India, for example, options on Nifty 50, Bank Nifty, Sensex, and individual stocks are among the most liquid contracts.
Why Options Exist?
Options exist to manage risk and to create trading opportunities. Think of them as financial insurance. Just like you pay a premium for car insurance to protect against damage, in options trading, investors pay a premium to protect themselves against adverse price moves.
For Hedgers: Options act as insurance. A stock investor can buy a put option to protect his portfolio if the market falls.
For Speculators: Options provide leverage. With small capital, traders can take large directional bets.
For Arbitrageurs: Options open opportunities to exploit price inefficiencies between the spot, futures, and options markets.

Risk Management in TradingIntroduction
Trading is often seen as the art of predicting market moves, buying low, and selling high. Yet, the most successful traders will tell you that trading is not about prediction, it’s about protection. The markets are uncertain, and no strategy, indicator, or system can guarantee 100% accuracy. What separates consistently profitable traders from losing ones is not just their ability to analyze charts but their skill in managing risk.
Risk management is the backbone of long-term survival in trading. Without it, even the best strategies eventually fail. With it, even an average strategy can deliver consistent returns over time. In this guide, we’ll dive deep into what risk management is, why it matters, and the tools and techniques every trader must master.
Chapter 1: What is Risk in Trading?
Risk in trading refers to the possibility of losing money due to adverse market movements. Every trade carries uncertainty, and risk management is about controlling the size and impact of that uncertainty.
There are different types of risk in trading:
Market Risk (Price Risk):
The chance of prices moving against your trade. For example, buying a stock at ₹100 and it falls to ₹90.
Leverage Risk:
Using borrowed money or margin amplifies both gains and losses. A small price move can wipe out capital if leverage is excessive.
Liquidity Risk:
The inability to exit a position at the desired price due to low trading volume. This happens often in small-cap stocks or thinly traded futures.
Volatility Risk:
Sudden price swings can trigger stop losses or create unexpected losses, especially around news events.
Psychological Risk:
Emotional decisions – fear, greed, revenge trading – often increase losses.
Systemic Risk:
External shocks like economic crises, geopolitical tensions, or pandemics can affect all markets simultaneously.
In simple terms: Risk = Probability of Loss × Magnitude of Loss.
Chapter 2: Why Risk Management is the Core of Trading
Most beginners focus on finding the “perfect strategy.” They try indicators, signals, or tips. But even the most accurate strategies have losing trades.
Consider two traders:
Trader A: Has a 70% winning strategy but risks 20% of capital per trade.
Trader B: Has a 50% winning strategy but risks only 1% of capital per trade.
Who survives longer? Trader B. Why? Because Trader A only needs a short losing streak to blow up his account, while Trader B can survive hundreds of trades.
Risk management ensures three things:
Survival: You live to trade another day.
Consistency: Your equity curve grows steadily without wild drawdowns.
Confidence: Knowing losses are controlled reduces stress and emotions.
In short: Trading without risk management is gambling.
Chapter 3: The Mathematics of Risk
3.1 The Risk of Ruin
Risk of ruin means the probability of losing all your trading capital. If you risk too much per trade, your account may not survive inevitable losing streaks.
Example:
If you risk 20% per trade, a losing streak of just 5 trades wipes out 67% of your account. To recover, you would need a 200% gain!
But if you risk 1% per trade, even 20 consecutive losses only reduce your account by ~18%. That’s survivable.
3.2 Risk-Reward Ratio
The Risk-Reward Ratio (RRR) measures potential reward compared to risk.
If you risk ₹100 to make ₹200, your RRR is 1:2.
A higher RRR allows profitability even with a low win rate.
For example:
At 1:2 RRR, you need only 34% win rate to break even.
At 1:3 RRR, just 25% win rate keeps you profitable.
3.3 Position Sizing Formula
A popular formula is:
Position Size = (Account Size × Risk per Trade) ÷ Stop Loss (in points/value)
Example:
Account Size = ₹1,00,000
Risk per Trade = 1% = ₹1,000
Stop Loss = ₹10 per share
Position Size = 1000 ÷ 10 = 100 shares
This ensures you never lose more than ₹1,000 in that trade.
Chapter 4: Tools of Risk Management
4.1 Stop Loss
A stop-loss order closes your trade automatically at a pre-defined price to limit losses. Types:
Hard Stop: Fixed exit point.
Trailing Stop: Moves with price to lock profits.
4.2 Take Profit
Opposite of stop-loss – locks in gains at a target level.
4.3 Diversification
Never put all capital into one trade or one asset. Spread risk across instruments, sectors, or strategies.
4.4 Hedging
Using options, futures, or correlated assets to reduce risk. Example: Buying Nifty futures and buying a protective put option.
4.5 Risk per Trade Rule
Most professional traders risk 0.5% to 2% of capital per trade. This balance allows growth while protecting against drawdowns.
4.6 Daily Loss Limit
Set a maximum daily loss (e.g., 3% of account). If hit, stop trading for the day. This prevents emotional revenge trades.
Chapter 5: Psychological Aspects of Risk
Risk management is not just technical; it’s psychological. Many traders fail because of:
Overconfidence: After wins, increasing position size too aggressively.
Fear: Cutting winners too early or avoiding valid trades.
Greed: Holding losers, hoping they’ll turn profitable.
Revenge Trading: Trying to recover losses quickly, leading to bigger losses.
Good risk management enforces discipline. You follow rules, not emotions.
Chapter 6: Advanced Risk Management Strategies
6.1 Kelly Criterion
A mathematical formula to optimize bet size based on edge and win probability.
Formula: f = (bp – q) / b*
Where:
f = fraction of capital to risk
b = odds (reward/risk)
p = probability of win
q = probability of loss
Although powerful, many traders use a fraction of Kelly (half-Kelly) to reduce volatility.
6.2 Value at Risk (VaR)
Common in institutional trading. It estimates the maximum expected loss over a given period at a certain confidence level (e.g., 95%).
6.3 Volatility-Based Position Sizing
Adjust position size according to market volatility. If volatility is high, trade smaller; if low, trade larger.
6.4 Portfolio Risk Management
Beyond individual trades, manage total portfolio risk. For example:
Limit exposure to correlated trades (e.g., don’t go long on multiple IT stocks at once).
Set maximum portfolio drawdown (e.g., 10%).
Chapter 7: Real-Life Examples
Example 1: The Trader Without Risk Management
Rahul has ₹1,00,000. He risks ₹20,000 per trade. After just 5 consecutive losses, his account drops to ₹33,000. To recover, he now needs +200% returns. Emotionally shattered, Rahul quits trading.
Example 2: The Disciplined Trader
Priya also starts with ₹1,00,000. She risks 1% per trade = ₹1,000. After 5 losses, she still has ₹95,000. She survives, learns, improves her strategy, and grows steadily.
Moral: Survival > Prediction.
Chapter 8: Building a Personal Risk Management Plan
Every trader must design a plan tailored to their style. Key components:
Capital Allocation: How much capital to trade vs. keep in reserve.
Risk per Trade: Set a percentage (1–2%).
Stop Loss Rules: Fixed or ATR (Average True Range) based.
Position Sizing Method: Use formula or volatility-based sizing.
Diversification Rules: Limit exposure per sector/asset.
Daily & Weekly Loss Limits: Stop trading after exceeding them.
Review & Adaptation: Analyze performance monthly and adjust.
Chapter 9: Common Mistakes Traders Make
Trading without stop losses.
Risking too much on one trade.
Averaging down losing trades.
Ignoring correlation between trades.
Trading during high-impact news without preparation.
Not tracking risk metrics (drawdown, expectancy, RRR).
Chapter 10: Risk Management for Different Trading Styles
Day Traders: Must be strict with intraday stop losses and daily limits.
Swing Traders: Should focus on overnight gap risk and diversify across positions.
Long-Term Investors: Must manage concentration risk and rebalance portfolios.
Options Traders: Need to monitor Greeks (Delta, Gamma, Vega) for exposure.
Conclusion
Risk management is the invisible hand that shapes trading success. While strategies may change, markets may evolve, and tools may improve, the principle remains timeless: Control risk, and profits will take care of themselves.
Every trader faces uncertainty, but those who respect risk survive and thrive. Without risk management, trading becomes a casino. With it, trading becomes a business.
Day Trading Techniques1. Introduction to Day Trading
Day trading is one of the most exciting and challenging forms of trading in the financial markets. Unlike long-term investors who hold stocks for months or years, day traders aim to open and close trades within the same trading session. The idea is to capitalize on intraday price movements, whether they are tiny scalps of a few seconds or larger moves over a few hours.
Day trading requires speed, precision, and discipline. It’s not just about clicking buy and sell—it’s about having a structured approach, using the right techniques, and applying strict risk management rules.
Some of the biggest advantages of day trading include:
No overnight risk (you close positions the same day).
Frequent opportunities due to constant price fluctuations.
Ability to compound profits quickly.
But there are also challenges:
High stress and fast decision-making.
Need for strong technical knowledge.
Risk of large losses if discipline is weak.
Now, let’s dive into the core principles that govern successful day trading.
2. Core Principles of Day Trading
Before learning the techniques, every day trader must master these principles:
a) Liquidity
Choose highly liquid stocks or instruments (e.g., Nifty, Bank Nifty, top NSE stocks, S&P500, EUR/USD forex pair) so that you can enter and exit quickly without much slippage.
b) Volatility
Day traders thrive on price volatility. Without movement, there’s no profit. Stocks with daily volatility above 2-3% are ideal.
c) Timeframes
Most day traders use 1-minute, 5-minute, and 15-minute charts for entries, while higher timeframes (30-min, hourly) help in understanding the bigger trend.
d) Risk-Reward Ratio
A golden rule is never to risk more than 1-2% of capital on a single trade. Good setups should ideally have a risk-reward ratio of 1:2 or higher.
e) Discipline
Consistency matters more than one big win. Even professional traders lose trades daily, but their discipline helps them win over the long run.
3. Popular Day Trading Techniques
Now let’s discuss the main strategies and techniques used by day traders:
3.1 Scalping
Scalping is the fastest form of day trading, where traders take multiple trades within seconds or minutes. The goal is to profit from tiny price movements.
Example: Buying Nifty Futures at 24,500.50 and selling at 24,502.00 for a small 1.5-point gain, repeated multiple times.
Tools: 1-min chart, VWAP, Level 2 order book.
Best Suited For: Highly liquid markets (Bank Nifty, Nasdaq, EUR/USD).
Pros: High frequency, quick profits.
Cons: Stressful, requires excellent execution speed.
3.2 Momentum Trading
Momentum traders look for strong moves backed by high volume and ride the trend until momentum weakens.
Example: A stock breaking 5% up with strong volume after positive earnings, and you ride it for another 3-4%.
Tools: RSI, MACD, VWAP, Volume Profile.
Best Suited For: Trending markets.
Pros: Large profits in trending conditions.
Cons: Risk of sudden reversals.
3.3 Breakout Trading
Breakout traders wait for a key support/resistance level to break with volume. They enter in the direction of the breakout.
Example: Reliance stuck between ₹2,900–₹3,000 for hours, then breaking ₹3,000 with high volume → buy for upside momentum.
Tools: Bollinger Bands, Volume analysis, Price Action.
Best Suited For: Stocks consolidating before big moves.
Pros: High reward trades if trend follows through.
Cons: Fake breakouts (false signals).
3.4 Reversal Trading
Reversal trading involves spotting exhaustion in a trend and betting against it.
Example: Bank Nifty rallies from 50,000 → 50,800, forms a double top, RSI diverges → short for pullback to 50,500.
Tools: RSI divergence, Candlestick patterns (hammer, shooting star).
Best Suited For: Overextended moves.
Pros: Excellent risk-reward (small risk, large reward).
Cons: Dangerous if trend continues.
3.5 Range-Bound Trading
Some stocks don’t trend—they move sideways. Traders exploit this by buying at support and selling at resistance.
Example: HDFC Bank bouncing between ₹1,600–₹1,620. Buy near ₹1,600, sell at ₹1,620.
Tools: RSI, Bollinger Bands, Pivot Points.
Best Suited For: Low-volatility phases.
Pros: Works well in sideways markets.
Cons: Breakouts can cause losses.
3.6 News-Based Trading
Markets react violently to news—earnings, economic data, government policies, mergers. News traders take positions immediately after such events.
Example: RBI cuts repo rate unexpectedly → banking stocks rally → enter quickly for intraday gains.
Tools: Live news feeds, Economic calendar.
Best Suited For: High-impact events.
Pros: Big profits in minutes.
Cons: Extremely risky if market overreacts.
3.7 Tape Reading & Order Flow
This old-school technique uses the order book and time & sales data to judge buying/selling pressure.
Example: Sudden increase in bid size at support level → sign of accumulation → go long.
Tools: DOM (Depth of Market), Footprint charts.
Best Suited For: Professional scalpers.
3.8 Algorithmic & Quantitative Day Trading
Algo traders use automated systems and mathematical models to scalp or trade intraday moves.
Example: A mean-reversion algo that buys when RSI < 20 and sells when RSI > 80.
Tools: Python, TradingView Pine Script, MT5 bots.
Best Suited For: Traders with coding/quant skills.
4. Technical Tools for Day Trading
Some essential indicators and tools:
VWAP (Volume Weighted Average Price): Institutional benchmark, used for intraday trend bias.
Moving Averages (EMA 9/20/50): Short-term trend signals.
RSI & MACD: Momentum indicators.
Volume Profile: Shows price levels where heavy trading occurred.
Candlestick Patterns: Pin bars, engulfing candles for entries/exits.
Pivot Points & Fibonacci: Intraday support/resistance.
5. Risk Management & Position Sizing
Without risk control, even the best technique fails. Key rules:
Never risk more than 1-2% of total capital per trade.
Use stop-loss orders strictly.
Apply position sizing formulas based on account size.
Keep risk-reward ratio > 1:2.
6. Trading Psychology
Day trading success is 80% psychology, 20% strategy.
Control emotions—fear and greed kill traders.
Don’t overtrade after losses (revenge trading).
Accept that losses are part of the game.
Stay patient and wait for A+ setups.
7. Practical Example Walkthrough
Imagine you’re day trading Infosys on results day:
Stock opens at ₹1,500, rallies to ₹1,540 with strong volume.
You spot momentum buildup and enter long at ₹1,542.
Place stop-loss at ₹1,530 (12 points risk).
Target ₹1,566 (24 points reward).
Stock hits ₹1,566 → you book profits → 1:2 risk-reward achieved.
This is how disciplined execution works.
8. Common Mistakes in Day Trading
Over-leveraging with margins.
Ignoring stop-loss.
Trading low-volume illiquid stocks.
Following tips blindly.
Emotional decision-making.
9. Advanced Tips & Best Practices
Trade only 2–3 best setups per day.
Maintain a trading journal to track progress.
Specialize in a few instruments instead of chasing everything.
Use hotkeys and advanced charting software for speed.
Always review trades post-market.
10. Conclusion
Day trading is a thrilling but demanding profession. The right combination of techniques, discipline, risk management, and psychology is what separates winners from losers.
Whether you prefer scalping, momentum trading, or breakouts—the key lies in sticking to a plan, managing risk, and learning continuously. Success in day trading doesn’t come overnight—it’s a journey of skill, patience, and persistence.

Option Chain Analysis1. Introduction
In modern trading, derivatives like options have become one of the most powerful instruments. Among the many tools available to option traders, Option Chain Analysis stands out as the backbone of decision-making. If stock market trading is like a battlefield, then an option chain is the detailed map of that battlefield – showing where buyers and sellers are positioned, where the pressure lies, and where opportunities may emerge.
An option chain (also called an options matrix) is simply a table that displays all available option contracts for a particular underlying asset (stock, index, commodity, etc.) along with their respective prices, volumes, and open interest. But, when we say option chain analysis, we mean much more than just reading a table – it’s about interpreting the data to understand market sentiment, possible support & resistance levels, and probable future price movements.
This guide will walk you through everything: from the basics of an option chain, the meaning of each data point, to advanced strategies for trading with option chain insights.
2. What is an Option Chain?
An Option Chain is a list of all the option contracts (both calls and puts) for a specific security across different strike prices and expiration dates.
For example, if you look at the Nifty 50 Option Chain for the current expiry, you’ll find:
All Call Options (CE) on one side.
All Put Options (PE) on the other side.
Strike prices in the middle column.
Alongside each strike, you’ll see key data like Last Traded Price (LTP), Volume, Open Interest (OI), Change in OI, Implied Volatility (IV), etc.
An option chain is essentially a snapshot of trader positioning. By reading it carefully, one can figure out where big institutions, retailers, and market makers are betting.
3. Structure of an Option Chain
A typical option chain table contains:
Strike Price: The agreed price at which the option holder can buy (Call) or sell (Put) the underlying.
Call Options (CE):
OI (Open Interest)
Change in OI
Volume
LTP (Last Traded Price)
Bid/Ask prices
Implied Volatility (IV)
Put Options (PE):
Same set of data points but for Puts.
Let’s break each down:
3.1 Strike Price
The reference price levels at which options can be exercised. Traders often focus on strike prices close to the current underlying price (ATM – At The Money).
3.2 Open Interest (OI)
Definition: Number of outstanding contracts not yet squared off.
Importance: High OI indicates strong trader participation.
Example: If the Nifty 20000CE has very high OI, it means many traders expect resistance around 20,000.
3.3 Change in OI
Tells you whether positions are being built (fresh contracts added) or unwound (closed).
Rising OI with rising price → Long build-up.
Rising OI with falling price → Short build-up.
3.4 Volume
Shows trading activity in a contract for the day. High volume indicates short-term interest.
3.5 Implied Volatility (IV)
Market’s expectation of future volatility.
High IV = Expensive options (market expects big moves).
Low IV = Cheaper options (market expects stability).
3.6 Bid/Ask Prices
The demand and supply levels at which traders are willing to buy/sell options.
4. Key Concepts in Option Chain Analysis
Before diving into strategies, you must understand how traders interpret option chain data.
4.1 Support and Resistance via OI
Support: Identified at Put strikes with highest OI (traders selling puts expect the market to stay above).
Resistance: Found at Call strikes with highest OI (call sellers expect the market to stay below).
Example:
If Nifty is at 19,800:
Highest PE OI at 19,500 → Support at 19,500.
Highest CE OI at 20,000 → Resistance at 20,000.
4.2 Put-Call Ratio (PCR)
Formula: PCR = Total Put OI ÷ Total Call OI
Interpretation:
PCR > 1 → Bullish (more puts sold, traders expect market to rise).
PCR < 1 → Bearish (more calls sold, traders expect market to fall).
4.3 Long/Short Build-ups
Long Build-up = Price ↑ + OI ↑
Short Build-up = Price ↓ + OI ↑
Long Unwinding = Price ↓ + OI ↓
Short Covering = Price ↑ + OI ↓
These patterns show real-time trader behavior.
4.4 Max Pain Theory
The strike price where option sellers (who are usually big players) would face the least loss at expiry.
This level often acts like a magnet as expiry approaches.
5. Step-by-Step Approach to Option Chain Analysis
Let’s build a systematic approach:
Step 1: Check Underlying Price
Find the current price of the stock/index.
Step 2: Identify ATM Strike
Pick the strike closest to the current price. That’s the most active zone.
Step 3: Check OI Levels
Look at which strikes have highest Call OI (resistance) and Put OI (support).
Step 4: Study OI Change
Fresh build-up of OI tells you the immediate sentiment.
Step 5: Watch PCR
Get a sense of whether market is leaning bullish or bearish.
Step 6: Note Implied Volatility
Rising IV before events (like results, Fed meeting, Budget) means traders expect big moves.
Step 7: Confirm with Price Action
Always validate OI data with charts. If price is near resistance and call OI is rising, chances of breakout are less.
6. Practical Example (Nifty Option Chain)
Imagine Nifty is trading at 19,800.
Option Chain shows:
CE 20,000 OI = 3 lakh contracts (highest) → Major Resistance at 20,000.
PE 19,500 OI = 2.8 lakh contracts (highest) → Major Support at 19,500.
PCR = 1.2 → Market slightly bullish.
IV rising → Expect big move soon.
Interpretation:
Market likely to trade between 19,500 – 20,000 until a breakout occurs.
7. Advanced Insights from Option Chain
7.1 Shift in OI
If highest Put OI shifts upward (e.g., from 19,500 to 19,700), it means support is moving higher – bullish sign.
7.2 Unwinding
If traders start exiting positions (OI ↓), it signals they no longer trust that level.
7.3 Short Squeeze
If market breaks resistance, call writers may panic and cover, leading to a sharp rally.
7.4 Volatility Skew
Sometimes, IV is higher for certain strikes – indicates market expects asymmetric movement.
8. Option Chain Analysis for Traders
8.1 For Intraday Traders
Use OI changes on a 5-15 min basis.
Spot short-term resistance & support zones.
Quick scalping opportunities.
8.2 For Swing Traders
Focus on weekly/monthly option chains.
Watch how supports/resistances are shifting.
Combine with price action to ride bigger moves.
8.3 For Investors
Use chain data to hedge portfolios.
Writing options around high OI levels generates premium income.
9. Common Mistakes in Option Chain Analysis
Relying only on OI without price confirmation.
Ignoring global events (Fed policy, crude oil prices, earnings, etc.).
Misinterpreting PCR extremes (too high PCR can signal overbought).
Forgetting expiry dynamics – option data changes rapidly.
10. Real-Life Scenarios
Scenario 1: Budget Day
IV shoots up before budget.
Once budget is announced, IV crashes (IV Crush).
Traders who only looked at option prices without IV understanding lose heavily.
Scenario 2: Expiry Day
Market tends to move toward Max Pain strike.
Options near ATM decay the fastest.
Sellers dominate expiry trades.
Conclusion
Option Chain Analysis is like reading the pulse of the market. It tells you what the majority of traders believe, where the market might face obstacles, and where it could find strength. For intraday traders, swing traders, or even long-term investors, option chain is an essential skill to master.
By carefully analyzing OI, IV, PCR, and Max Pain, and aligning them with price action, traders can significantly improve accuracy. But remember – option chain doesn’t predict the future with certainty; it only provides probabilities and market sentiment. The real edge comes when you combine it with risk management and discipline.
Identifying Swing Trading Opportunities in the Market1. Introduction to Swing Trading
Swing trading is a powerful trading style that sits between day trading and long-term investing. Unlike day traders who open and close trades within the same day, swing traders hold positions for a few days to a few weeks. The main goal is to capture "swings" in price—upward or downward movements caused by market momentum, technical patterns, or news.
The beauty of swing trading lies in its balance:
Less stressful than day trading since you don’t need to watch charts all day.
More active and potentially higher returns than passive investing.
Works well for people with jobs or businesses who can’t spend 8 hours glued to a screen.
But to succeed, you need to identify the right opportunities. Not every chart or stock is suitable for swing trading. Spotting opportunities requires understanding market structure, technical analysis, fundamentals, and timing.
2. Core Principles of Swing Trading Opportunities
Before diving into strategies, let’s build the foundation. Swing traders look for:
Trend Direction – Is the stock in an uptrend, downtrend, or sideways range?
Momentum – Is there enough force behind the move to sustain swings?
Risk-to-Reward – Can you set a stop-loss at a reasonable level and aim for a bigger target?
Liquidity – Is the stock or index liquid enough to avoid slippage?
Catalysts – News, earnings, or events that can trigger short-term moves.
These principles act as a filter. Out of thousands of stocks, only a few will pass through this funnel as swing trading candidates.
3. Tools to Identify Swing Trading Opportunities
Swing traders rely on a mix of technical, fundamental, and sentiment analysis. Let’s break them down:
a) Technical Analysis
Price Action: Reading candlesticks, support/resistance, breakouts, and patterns.
Indicators:
Moving Averages (20, 50, 200 EMA) for trend direction.
RSI (Relative Strength Index) for overbought/oversold signals.
MACD for momentum shifts.
Volume Profile for demand-supply zones.
Chart Patterns:
Bullish: Cup and Handle, Ascending Triangle, Flag, Double Bottom.
Bearish: Head & Shoulders, Double Top, Descending Triangle.
b) Fundamental Analysis
While swing traders don’t dive deep like long-term investors, some fundamentals matter:
Earnings reports (positive surprises can fuel rallies).
Sector rotation (money flowing from one sector to another).
Macro data (inflation, interest rates affecting sentiment).
c) Sentiment Analysis
News Flow: Mergers, product launches, government policies.
Options Data: Unusual call/put activity showing institutional interest.
Market Mood: Fear vs greed index, retail participation.
4. Step-by-Step Approach to Spot Opportunities
Here’s a structured approach swing traders can follow daily or weekly:
Step 1: Market Scan
Use screeners (TradingView, Chartink, Finviz, Screener.in).
Filter by:
Strong relative strength vs index.
Stocks near 52-week highs/lows.
Breakout setups (above resistance or trendline).
High volume spikes.
Step 2: Trend Confirmation
Use 20/50 EMA to confirm if stock is trending.
Avoid stocks in choppy sideways ranges.
Step 3: Entry Triggers
Look for:
Breakout with volume.
Pullback to support after an uptrend.
Reversal signals at oversold levels.
Step 4: Risk Management
Place stop-loss below swing low (for long trades).
Aim for 1:2 or higher risk-to-reward.
Step 5: Monitor & Exit
Trail stop-loss as trade moves in your favor.
Exit at resistance, fib levels, or when momentum fades.
5. Swing Trading Opportunities Based on Market Structure
Market structure is the heartbeat of swing trading. Let’s break it:
a) Uptrend Opportunities
Look for higher highs & higher lows.
Entry: After a pullback to moving average/support.
Example: IT or Pharma stocks in a bullish cycle.
b) Downtrend Opportunities
Look for lower highs & lower lows.
Entry: After a bounce into resistance.
Example: Weak financial stocks in a rate-hike cycle.
c) Range-Bound Opportunities
Stocks consolidating in a range.
Entry: Buy at bottom support, sell at top resistance.
Example: Sideways PSU stocks before breakout.
d) Breakout & Breakdown Opportunities
Consolidation followed by strong volume breakout.
Entry: Just above breakout level.
Example: Midcap stocks after results.
6. Swing Trading Setups That Work
Different traders prefer different styles. Here are proven setups:
1. Pullback in Trend
Identify a strong uptrend.
Wait for stock to dip near 20/50 EMA.
Enter on bullish reversal candle.
Example: Nifty IT stocks after profit booking.
2. Breakout Trading
Stock consolidates under resistance.
Breaks with high volume.
Enter above breakout candle.
Example: Midcap infra stock crossing 200-day high.
3. Support & Resistance Bounce
Buy near strong support, sell near resistance.
Example: Bank Nifty bouncing at 45,000 level.
4. RSI Divergence
Price makes lower lows but RSI makes higher lows.
Signals reversal opportunity.
Example: Metal stocks reversing after deep selloff.
5. Gap Trading
Stock gaps up/down after news.
Trade in the direction of the gap with stop-loss.
Example: Earnings-driven gaps in large caps.
7. Sector & Thematic Opportunities
Swing traders benefit from sectoral rotation:
When IT outperforms, focus on Infosys, TCS, TechM.
When Banking leads, focus on HDFC Bank, ICICI, SBI.
When Energy/Metals rally, look at ONGC, Coal India, Hindalco.
Themes also create opportunities:
EV (Tata Motors, M&M).
Renewable energy (Adani Green, NTPC).
Defense (HAL, BEL).
8. Real-Life Examples
Let’s take two examples from Indian markets:
Example 1: Tata Motors (2024 EV Story)
Setup: Broke out of a long consolidation near ₹600 with heavy volume.
Entry: At ₹610 (after breakout).
Stop-Loss: ₹580 (below support).
Target: ₹700+ (based on swing projection).
Result: Delivered 15% in 2 weeks.
Example 2: Bank Nifty Swing
Setup: Pullback to 45,000 after sharp rally.
Entry: Reversal candle with volume at support.
Stop-Loss: 44,600.
Target: 46,500.
Result: Quick 3% move in 4 sessions.
9. Common Mistakes in Identifying Swing Trades
Trading illiquid stocks with low volume.
Chasing trades after a big rally (late entries).
Ignoring stop-loss, leading to capital erosion.
Overloading portfolio with too many trades.
Trading without checking broader market trend.
10. Advanced Filters for Identifying Opportunities
For serious traders:
Relative Strength Analysis: Compare stock vs index.
Volume Profile & Market Structure: Identify institutional footprints.
Fibonacci Retracement: Look for 38.2% or 61.8% pullback levels.
Options Data: OI build-up for short-term direction.
Conclusion
Identifying swing trading opportunities is both art and science. You need:
The science of technicals, fundamentals, and scanning.
The art of reading market psychology, momentum, and timing.
The key takeaway:
Not every stock is worth trading. The best swing traders wait for high-probability setups, manage risk strictly, and ride short-term momentum.
Swing trading is not about catching every move, but about catching the right moves. With practice, patience, and structured analysis, anyone can master the skill of spotting profitable opportunities in the market.