Fundamental Analysis vs Technical Analysis: Which Strategy Wins?Introduction
In the world of stock market investing and trading, two schools of thought dominate: Fundamental Analysis (FA) and Technical Analysis (TA). Both approaches aim to answer the same question — “Should I buy, hold, or sell this stock?” — but they take entirely different paths to reach their conclusion.
Fundamental analysis focuses on the business behind the stock: revenues, profits, assets, management quality, industry position, and future growth potential.
Technical analysis focuses on the stock’s price and volume behavior, studying patterns and trends to predict short-term and long-term movements.
This debate has existed for decades, with investors like Warren Buffett standing firmly on the side of fundamentals, and traders like Paul Tudor Jones thriving on technicals. But in reality, the answer to “which strategy wins” is more nuanced.
In this guide, we’ll break down both approaches in detail, compare their strengths and weaknesses, and analyze which one works better in different market contexts.
Part 1: Understanding Fundamental Analysis
What is Fundamental Analysis?
Fundamental Analysis (FA) is the study of a company’s intrinsic value. The idea is simple: every stock has a “true worth,” and if its current market price is lower than this intrinsic value, it’s undervalued (a buying opportunity). Conversely, if the market price is higher, it’s overvalued (a selling or shorting opportunity).
Key Components of FA
Financial Statements
Income Statement (profit & loss) → Are revenues and profits growing?
Balance Sheet → Does the company have too much debt?
Cash Flow Statement → Is the company generating real cash or just accounting profits?
Ratios & Metrics
P/E Ratio (Price-to-Earnings) – How much are investors willing to pay for each unit of earnings?
P/B Ratio (Price-to-Book) – Is the stock valued fairly compared to assets?
ROE (Return on Equity) – How efficiently is management using investor capital?
Debt-to-Equity – Is the company financially stable?
Qualitative Factors
Management quality
Competitive advantage (moat)
Industry trends
Government policies and regulations
Macroeconomic Factors
Inflation, interest rates, GDP growth
Global economic conditions
Sectoral growth trends
Example of Fundamental Analysis in Action
Imagine you’re analyzing Infosys.
Revenue and profits have been steadily growing.
P/E ratio is lower than peers like TCS and Wipro.
Strong cash flows, low debt, high ROE.
The IT industry is expected to grow as global businesses continue digital transformation.
Conclusion: Infosys is fundamentally strong, and if its stock is trading at a reasonable valuation, it may be a good long-term buy.
Part 2: Understanding Technical Analysis
What is Technical Analysis?
Technical Analysis (TA) studies price and volume patterns on stock charts to predict future movements. The underlying belief is that “Price reflects everything” — all news, fundamentals, and emotions are already priced into the stock. Thus, by studying charts, traders can anticipate where the price will move next.
Key Components of TA
Price Charts
Line charts, candlestick charts, bar charts
Trends
Uptrend (higher highs, higher lows)
Downtrend (lower highs, lower lows)
Sideways (range-bound)
Support & Resistance Levels
Support = a price level where demand is strong enough to stop decline
Resistance = a level where selling pressure stops price rise
Technical Indicators
Moving Averages (MA, EMA) – Identify trend direction
RSI (Relative Strength Index) – Measures overbought/oversold conditions
MACD (Moving Average Convergence Divergence) – Identifies momentum shifts
Bollinger Bands – Measures volatility and breakout possibilities
Chart Patterns
Head & Shoulders, Double Top, Cup & Handle, Triangles, Flags, etc.
Volume Analysis
Rising price + high volume = strong bullish confirmation
Falling price + high volume = strong bearish confirmation
Example of Technical Analysis in Action
Suppose Reliance Industries is trading at ₹2,500.
The stock has formed strong support at ₹2,450 and resistance at ₹2,600.
RSI shows it’s oversold near 30, suggesting a bounce.
Volume spikes confirm buying interest.
A candlestick reversal pattern (hammer) forms near support.
Conclusion: Reliance may bounce from ₹2,450 towards ₹2,600 in the short term, making it a good trading opportunity.
Part 3: Key Differences Between FA and TA
Aspect Fundamental Analysis Technical Analysis
Focus Business, financials, valuation Price, volume, market psychology
Timeframe Long-term investing (months to years) Short to medium-term trading (minutes to weeks)
Tools Balance sheet, ratios, economy, management analysis Charts, indicators, patterns, support/resistance
Philosophy “Buy good businesses at the right price” “Price discounts everything; trends repeat”
Users Investors, value investors, mutual funds Traders, swing traders, day traders, scalpers
Strengths Identifies undervalued stocks for wealth creation Captures quick moves for profit
Weaknesses Slow, doesn’t time entries well May give false signals, ignores fundamentals
Part 4: Strengths & Weaknesses of Each Approach
Strengths of FA
Helps identify multi-bagger stocks (e.g., Infosys, HDFC Bank, Asian Paints).
Provides long-term conviction, reducing panic selling.
Focuses on wealth creation rather than just trading gains.
Weaknesses of FA
Doesn’t provide precise entry/exit timing.
Market can stay irrational for long (undervalued stocks may stay undervalued).
Requires deep knowledge of finance and economics.
Strengths of TA
Provides timing precision (when to buy/sell).
Useful for short-term profits.
Works in any market — stocks, forex, commodities, crypto.
Weaknesses of TA
Can be subjective (two traders may interpret the same chart differently).
False signals are common.
Doesn’t consider company fundamentals — risky if used blindly.
Part 5: Which Strategy Wins?
The answer isn’t either/or. The real winners are those who know when to use which approach.
For Long-Term Investors
FA is the primary tool.
Example: Warren Buffett uses fundamentals to identify businesses that will compound wealth over decades.
For Short-Term Traders
TA is more effective.
Example: Day traders and swing traders rely on charts, not balance sheets.
For Hybrid Investors (Best of Both Worlds)
The most successful investors often combine both.
Example: Buy fundamentally strong companies (FA) and use TA for better entry/exit timing.
Part 6: Real-Life Examples
Amazon (FA Winner): In 2001, Amazon was loss-making, but fundamental believers in e-commerce saw potential. Long-term holders became millionaires.
Tesla (FA + TA): Initially, Tesla looked overvalued by fundamentals, but TA showed strong momentum and trend-following traders made massive gains.
Yes Bank (FA Ignored): Many traders made profits using TA in short-term swings, but long-term FA showed cracks in fundamentals, leading to eventual collapse.
Part 7: Market Conditions – Who Wins When?
Bull Market → Both FA and TA work. FA finds strong companies, TA helps ride the trend.
Bear Market → TA is more useful for risk management. FA may trap investors in “value traps.”
Sideways Market → TA is superior as it identifies range-bound trades.
Post-Crash Recovery → FA wins by identifying undervalued gems for long-term recovery.
Conclusion
The debate of Fundamental Analysis vs Technical Analysis isn’t about which is superior, but about which fits your goals, personality, and timeframe.
If you want to build long-term wealth → Go with Fundamental Analysis.
If you want to make short-term profits → Technical Analysis is your tool.
If you want the best of both worlds → Combine FA + TA.
Ultimately, markets reward not those who argue which strategy is better, but those who apply the right strategy at the right time.
AXISBANK
Part 2 Master Candle Sticks PatternIntroduction to Options Trading
In the world of financial markets, options trading is considered one of the most powerful and flexible forms of trading. Unlike simple stock buying and selling, options allow traders to control larger positions with less capital, hedge their risks, and design strategies that fit different market conditions — bullish, bearish, or even sideways.
An option is essentially a contract that gives the buyer the right, but not the obligation, to buy or sell an asset at a specific price (called the strike price) within a given period of time.
If you buy an option, you are purchasing a right.
If you sell (or write) an option, you are giving someone else that right and taking on an obligation.
Options are traded on stocks, indexes (like Nifty 50 or Bank Nifty in India), commodities, currencies, and even cryptocurrencies in some global markets.
They are widely used by:
Investors to hedge portfolios.
Speculators to make money from price moves.
Institutions to manage large exposures.

Part 2 Ride The Big MovesBasic Concepts & Terminology
Before going deeper, let’s simplify the core terms in options trading:
Strike Price: The fixed price at which the buyer can buy (call) or sell (put) the asset.
Expiry Date: The date on which the option contract expires (e.g., weekly or monthly).
Option Premium: The cost paid by the buyer to the seller for getting this right.
Lot Size: Options are traded in lots, not single shares. Example: Nifty option lot = 50 units.
In-the-Money (ITM): When exercising the option is profitable.
Out-of-the-Money (OTM): When exercising the option is not profitable.
At-the-Money (ATM): When the strike price = current price of the underlying asset.
Example:
Suppose Reliance is trading at ₹2,500.
A Call option with strike 2,400 is ITM (because you can buy at 2,400, lower than 2,500).
A Put option with strike 2,600 is ITM (because you can sell at 2,600, higher than 2,500).

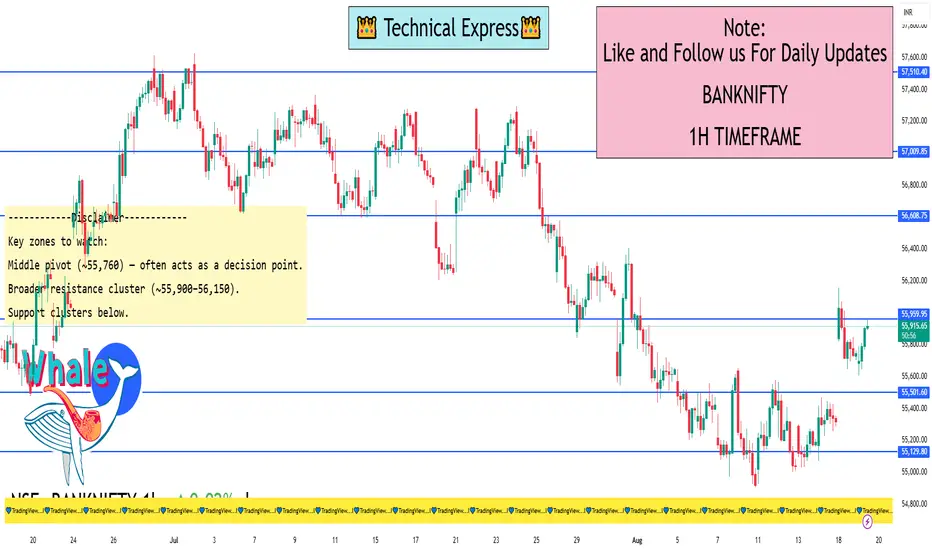
Banknifty 1 Hour Time Frame August MonthBank Nifty is moving within a descending channel on the 1-hour chart.
Immediate support: 55,000–55,200.
Intraday strength likely above 55,950, while weakness may emerge below 55,000.
Short-term Buy Setup: Buy above 55,820 → Targets: 55,910, 56,030, 56,150; Stop-loss: 55,650.
Short-term Sell Setup: Sell below 55,550 → Targets: 55,460, 54,305, 54,150; Stop-loss: 55,800
Positional Support / Resistance (Earnometer)
Support zones: 55,364, 54,865, 52,606.
Resistance zones: 55,899, 56,077, 56,261, 56,332, 56,500, 56,566
Pivot Levels (Investing.com India)
Classic pivots:
Support: S1 = 55,527.8; S2 = 55,586.85; S3 = 55,701.35
Pivot Point (PP): 55,760.4
Resistance: R1 = 55,874.9; R2 = 55,933.95; R3 = 56,048.45
Fibonacci pivots:
S1 = 55,586.85; S2 = 55,653.15; S3 = 55,694.1
PP = 55,760.4
R1 = 55,826.7; R2 = 55,867.65; R3 = 55,933.95
Options Trading & Popular Option Strategies1. Introduction to Options Trading
Options trading is one of the most powerful segments of financial markets. It combines flexibility, leverage, and risk management tools, allowing traders and investors to protect portfolios, generate income, or speculate on market movements.
Unlike stocks, which represent ownership in a company, options are derivative contracts. Their value is derived from an underlying asset such as stocks, indices, commodities, or currencies.
An option is a contract between two parties that gives the buyer the right (not obligation) to buy or sell an asset at a predetermined price (called strike price) before or on a specific date (called expiry date).
Options are widely used in India (on NIFTY, BANKNIFTY, stocks) and globally (on S&P500, commodities, forex). Their appeal comes from:
Small capital requirement compared to stocks.
Potential to profit in bullish, bearish, or sideways markets.
Ability to create tailored strategies using combinations.
2. Basics of Options
2.1 Types of Options
Call Option (CE) – gives the buyer the right to buy the underlying at the strike price.
Used when expecting prices to go up.
Put Option (PE) – gives the buyer the right to sell the underlying at the strike price.
Used when expecting prices to go down.
2.2 Option Buyers vs Sellers
Buyer: Pays premium, has limited risk (loss = premium paid), unlimited profit potential.
Seller (Writer): Receives premium, has limited profit (premium), but potentially large risk.
2.3 Key Terminologies
Strike Price – agreed price of the underlying.
Premium – cost of buying the option.
Expiry – last date on which option is valid.
Moneyness – relation of spot price to strike price.
ITM (In-the-money): Option already has intrinsic value.
ATM (At-the-money): Strike = spot.
OTM (Out-of-the-money): Option has no intrinsic value, only time value.
3. Why Trade Options?
Options serve three main purposes:
Speculation – Traders use options to bet on market direction with lower capital.
Example: Buying NIFTY 20000 Call if expecting NIFTY to rise.
Hedging – Investors protect their portfolios using options.
Example: Buying Put options to hedge stock portfolio during uncertain times.
Income Generation – Selling options to collect premium income.
Example: Covered Call writing by long-term investors.
4. Understanding Option Pricing (The Greeks)
Option prices are influenced by several factors. The "Greeks" help traders understand risks:
Delta – sensitivity to price movement of underlying.
Theta – time decay; options lose value as expiry approaches.
Vega – sensitivity to volatility; higher volatility increases option premium.
Gamma – rate of change of Delta; measures risk in sharp movements.
Understanding Greeks is crucial for advanced strategy building.
5. Popular Option Strategies
Now let’s move into the heart of options trading – strategies.
Each strategy is designed for a specific market view: bullish, bearish, or neutral.
5.1 Bullish Strategies
Long Call
Buy a call option to profit from price rise.
Example: NIFTY at 20,000. Buy 20,200 CE for ₹100 premium.
If NIFTY rises to 20,500 → Profit = 200 points – 100 = 100 points.
Bull Call Spread
Buy lower strike call + Sell higher strike call.
Lower cost, limited profit.
Example: Buy 20,000 CE (₹200), Sell 20,500 CE (₹100). Net cost ₹100. Max profit ₹400.
Bull Put Spread
Sell higher strike put + Buy lower strike put.
Used when moderately bullish.
5.2 Bearish Strategies
Long Put
Buy a put option to profit from price fall.
Example: Stock at ₹1000, buy 950 PE. If stock falls to ₹900 → gain.
Bear Put Spread
Buy higher strike put, sell lower strike put.
Limited profit, limited risk.
Bear Call Spread
Sell lower strike call, buy higher strike call.
Used when expecting mild downside.
5.3 Neutral/Sideways Strategies
Straddle (Long)
Buy Call + Buy Put at same strike.
Profits if market moves sharply either side.
Loss if market remains flat (due to time decay).
Strangle (Long)
Buy OTM Call + Buy OTM Put.
Cheaper than straddle, needs bigger move to profit.
Iron Condor
Sell OTM Call + Sell OTM Put, while buying further OTM Call & Put for protection.
Profits in range-bound markets.
Butterfly Spread
Combines multiple calls or puts to profit from low volatility.
Example: Buy 19,800 CE, Sell 20,000 CE x2, Buy 20,200 CE.
Maximum profit if market stays near 20,000.
5.4 Advanced Strategies
Covered Call
Own the stock + Sell a call option.
Generates premium income, but caps upside.
Protective Put
Own stock + Buy a put option.
Acts like insurance against downside.
Calendar Spread
Buy long-term option, sell short-term option.
Profits from time decay differences.
Ratio Spreads
Involves selling more options than bought.
Used for advanced traders with volatility view.
6. Risk Management in Options
Options trading involves leverage and hence, strict risk management is vital:
Position sizing – never risk more than 2-3% of capital per trade.
Stop-loss levels – exit when trade goes wrong.
Avoid naked option selling – unlimited loss potential.
Understand expiry risk – options decay faster near expiry.
7. Practical Application in Indian Markets
NIFTY & BANKNIFTY Options dominate volumes in India.
Retail traders often buy weekly options for intraday or swing trades.
Institutions use option selling strategies for income.
Example: Selling weekly straddles on BANKNIFTY around events like RBI policy.
8. Pros & Cons of Options Trading
Advantages
Low capital requirement.
Multiple strategies for any market condition.
Useful for hedging portfolios.
Disadvantages
Complex pricing models.
Time decay hurts buyers.
High risk for sellers.
9. Common Mistakes by Beginners
Buying deep OTM options hoping for jackpot.
Not considering time decay (Theta).
Selling naked options without risk control.
Ignoring implied volatility.
Trading too frequently without strategy.
10. Conclusion
Options trading is not gambling—it’s a structured approach to market speculation, hedging, and income generation. Mastering options requires understanding the basics, practicing with small capital, and gradually moving into advanced strategies.
The most successful traders combine technical analysis, volatility studies, and disciplined risk management.
With experience, you’ll realize that options are like financial Lego blocks—you can build strategies suited to any market scenario. Whether bullish, bearish, or neutral, there’s always an option strategy available.
Global Macro Factors in TradingIntroduction
Trading is not just about charts, patterns, or company earnings—it’s also about understanding the bigger picture. This bigger picture is shaped by global macroeconomic factors that influence the flow of money across countries, sectors, and asset classes.
A trader who ignores global macro factors risks missing the underlying forces driving market trends. On the other hand, traders who integrate macroeconomic analysis into their strategies can often anticipate market shifts before they appear on technical charts.
In this deep dive, we’ll explore what global macro factors are, why they matter, how they affect different asset classes, and how traders can practically use them in their decision-making.
What are Global Macro Factors?
Global macro factors are large-scale economic, political, and social conditions that impact the performance of financial markets worldwide. They include:
Economic growth cycles (GDP, industrial output, unemployment)
Inflation and deflation trends
Interest rates and monetary policy
Government fiscal policies
Global trade dynamics (exports, imports, tariffs, supply chains)
Geopolitical risks (wars, elections, sanctions, political instability)
Commodities and energy prices (oil, gas, metals, agriculture)
Currency exchange rates
Technological disruptions & structural shifts
Climate change and sustainability policies
These factors drive cross-border capital flows, influence investor sentiment, and dictate the performance of stocks, bonds, commodities, and currencies.
Why Global Macro Factors Matter for Traders
They Move Markets More Than Company News
For example, if the U.S. Federal Reserve raises interest rates sharply, the Indian stock market might fall—even if Indian companies are performing well—because global capital exits riskier emerging markets.
They Explain Market Trends
Sometimes markets rise or fall without obvious technical reasons. Looking at macro data (like inflation, global interest rates, or oil prices) often reveals the underlying cause.
They Help in Asset Allocation
A trader who knows that inflation is rising globally may prefer commodity trading (gold, silver, crude) over growth stocks.
They Reduce Trading Risk
Anticipating macro shocks—such as a recession, a currency crisis, or a geopolitical conflict—helps traders manage risk better.
Key Global Macro Factors in Detail
Let’s go through the most important ones, with trading implications.
1. Economic Growth Cycles (GDP Trends)
What it means:
Gross Domestic Product (GDP) is the main indicator of economic health. High GDP growth attracts foreign investments, boosts corporate profits, and supports strong stock market performance. Slow growth or contraction signals recession.
Impact on Trading:
When global growth is strong → equities, emerging markets, and cyclical sectors (automobiles, banking, infrastructure) perform well.
When growth slows → safe-haven assets like gold, U.S. Treasuries, and defensive sectors (pharma, FMCG) gain.
Example:
In 2020, when the world economy went into lockdown, GDP collapsed globally. Stock markets initially crashed, but later surged when governments and central banks provided massive stimulus, betting on a V-shaped recovery.
2. Inflation & Deflation
What it means:
Inflation is the rise in prices of goods and services. Controlled inflation is good—it indicates demand. But runaway inflation hurts purchasing power. Deflation, the opposite, signals weak demand and economic stagnation.
Impact on Trading:
High inflation → central banks raise interest rates, stock markets fall, bond yields rise. Commodities like gold and oil rally.
Low inflation/deflation → central banks cut rates, boosting equity markets.
Example:
In 2022, global inflation spiked due to supply chain disruptions and the Russia-Ukraine war. Central banks raised rates aggressively, causing sharp declines in tech and growth stocks while energy companies benefited.
3. Interest Rates & Monetary Policy
What it means:
Central banks like the U.S. Federal Reserve, ECB, or RBI control monetary policy—deciding interest rates and liquidity. Interest rates directly affect borrowing costs, investments, and asset valuations.
Impact on Trading:
Rising rates → bearish for stocks (especially tech), bullish for bonds and the U.S. dollar.
Falling rates → bullish for equities and commodities, bearish for the dollar.
Example:
In 2023–2024, markets closely tracked the Fed’s decisions. Whenever the Fed hinted at slowing down rate hikes, global stock markets rallied.
4. Fiscal Policy & Government Spending
What it means:
Governments influence markets through budgets, taxation, subsidies, and spending programs. Fiscal stimulus can boost markets, while austerity can slow them.
Impact on Trading:
Infrastructure spending → benefits construction, cement, steel stocks.
Tax cuts → boost corporate profits and consumer spending.
Subsidies/removals → affect agriculture, energy, and renewable stocks.
Example:
India’s Union Budget announcements often cause sectoral rallies—defense allocations push defense stocks up, while higher infrastructure spending boosts capital goods.
5. Global Trade & Supply Chains
What it means:
Globalization ties economies together. Exports, imports, tariffs, sanctions, and supply chain disruptions influence asset prices.
Impact on Trading:
Trade wars or tariffs → hurt global growth and export-driven stocks.
Strong global trade → boosts commodities and shipping sectors.
Supply chain disruptions → create inflation and shortages (e.g., semiconductors in 2021).
Example:
The U.S.-China trade war in 2018 caused volatility in technology and industrial stocks worldwide.
6. Geopolitical Risks
What it means:
Wars, sanctions, elections, and political instability affect global investor sentiment.
Impact on Trading:
Rising geopolitical tensions → bullish for gold, oil, U.S. dollar (safe havens).
Stable geopolitics → bullish for equities and emerging markets.
Example:
The Russia-Ukraine war in 2022 caused oil and gas prices to spike, benefiting energy companies but hurting global equity markets.
7. Commodities & Energy Prices
What it means:
Oil, natural gas, metals, and agricultural commodities drive costs across industries.
Impact on Trading:
Rising oil → hurts airline, transport, and manufacturing stocks. Benefits energy producers.
Rising gold/silver → signals investor risk aversion.
Agricultural prices → affect FMCG and food companies.
Example:
When crude oil rose above $100 per barrel in 2022, airline stocks crashed while oil & gas companies rallied.
8. Currency Exchange Rates
What it means:
Currencies reflect economic health, capital flows, and interest rate differentials.
Impact on Trading:
Strong USD → hurts emerging markets, commodity prices fall.
Weak USD → boosts gold, commodities, and EM equities.
Currency depreciation → benefits exporters but hurts importers.
Example:
In 2022, the U.S. dollar index hit a 20-year high. This pressured Indian equities as foreign investors pulled money out, and crude oil imports became costlier for India.
9. Technological Disruptions
What it means:
Innovation (AI, blockchain, EVs, renewable energy) shifts capital allocation.
Impact on Trading:
New tech adoption → boosts related sectors (AI → IT companies, EV → battery makers).
Old industries → may lose capital (oil majors losing to renewables).
Example:
AI-driven rallies in 2023–2024 saw tech giants like Nvidia and Microsoft outperform global markets.
10. Climate Change & ESG Policies
What it means:
Sustainability and environmental regulations now influence capital flows.
Impact on Trading:
ESG-focused funds avoid polluting industries.
Renewable energy, EV, and green tech companies benefit.
Carbon taxes and environmental restrictions increase costs for traditional industries.
Example:
Europe’s carbon neutrality push boosted renewable energy companies while hurting coal producers.
How Global Macro Factors Affect Different Asset Classes
Equities (Stocks)
Bull markets when growth, low inflation, and easy money align.
Bear markets during recessions, high inflation, or geopolitical shocks.
Bonds
Bond prices rise when interest rates fall.
Inflation erodes bond returns.
Commodities
Rise in inflation and geopolitical risks → commodity bull runs.
Strong dollar usually weakens commodities.
Currencies (Forex)
Driven by interest rates, trade balances, and capital flows.
Safe-haven currencies (USD, CHF, JPY) rise during crises.
Crypto Assets
Sensitive to liquidity conditions and global risk sentiment.
Perform better during easy monetary policy and risk-on environments.
Conclusion
Global macro factors are the invisible strings that pull the markets in different directions. They influence whether money flows into equities, commodities, bonds, or currencies.
For traders, the ability to combine macro awareness with technical analysis is a powerful edge. It helps anticipate large market moves, align trades with the broader economic cycle, and reduce risk exposure.
In today’s interconnected world, no market operates in isolation. Understanding GDP trends, inflation, interest rates, currency shifts, and geopolitical developments is essential to surviving and thriving as a trader.
Short-Term Trading vs. Long-Term TradingIntroduction
When people step into the stock market, they usually come across two main approaches: short-term trading and long-term investing (or trading). Both are methods of participating in the markets, but they differ significantly in terms of time horizon, mindset, strategies, risks, and rewards.
Short-term trading is like sprinting: fast-paced, energetic, and often risky. Long-term investing is like running a marathon: steady, patient, and endurance-driven. Both can lead to success, but they suit different kinds of personalities, financial goals, and market conditions.
In this detailed discussion, we’ll explore what each strategy means, how they work, their pros and cons, famous examples, psychology, and ultimately how traders and investors can decide which approach (or blend of both) works for them.
What is Short-Term Trading?
Short-term trading refers to buying and selling financial assets within a short period, ranging from a few minutes to a few weeks. The primary objective is to take advantage of price fluctuations and profit quickly.
Types of Short-Term Trading
Scalping – Trades last seconds or minutes, aiming for small profits multiple times a day.
Day Trading – Buying and selling within the same day, closing all positions before market close.
Swing Trading – Holding trades for a few days to weeks, capturing short price “swings.”
Momentum Trading – Jumping into stocks with strong upward or downward momentum, often influenced by news, results, or events.
Key Features of Short-Term Trading
Time horizon: seconds to weeks.
Tools used: technical analysis, chart patterns, volume profile, moving averages, RSI, etc.
Driven by: volatility, news, earnings reports, global events.
Requires active monitoring and fast decision-making.
What is Long-Term Trading (or Investing)?
Long-term investing involves holding an asset for years, often ignoring short-term fluctuations. The goal is to grow wealth gradually by benefiting from compounding, dividends, and the long-term growth of companies or markets.
Key Features of Long-Term Trading
Time horizon: several years to decades.
Tools used: fundamental analysis, company earnings, valuation ratios (P/E, P/B), macroeconomic trends.
Driven by: company growth, economic cycles, innovation, demographics.
Requires patience, consistency, and belief in the long-term growth of markets.
Famous Example:
Warren Buffett is the most celebrated long-term investor. He buys strong companies with durable advantages and holds them for decades.
Time Horizon: The Core Difference
Short-Term Trading: Profit targets can be hit in minutes or days. Focus is on timing entry/exit perfectly.
Long-Term Trading: Success depends less on timing and more on time in the market. Staying invested allows the power of compounding to work.
For example:
A day trader might buy Reliance stock at ₹2800 and sell at ₹2825 within a few hours.
A long-term investor might buy Reliance at ₹1000 in 2016 and hold until 2025 when it reaches above ₹2800, gaining multiple times the initial capital.
Risk and Reward
Short-Term Trading Risks & Rewards
Rewards: Quick profits, ability to capitalize on volatility, frequent opportunities.
Risks: High transaction costs, emotional stress, overtrading, large losses from sudden moves.
Long-Term Trading Risks & Rewards
Rewards: Power of compounding, lower taxes (on long-term capital gains), dividends, financial security.
Risks: Market crashes (like 2008 or 2020), company failures, inflation risk, long waiting period.
Tools & Techniques
Short-Term Traders Rely On:
Technical charts (candlesticks, moving averages, RSI, MACD).
Market structure and volume profile.
News-driven events (earnings, economic data).
Risk management via stop-loss orders.
Long-Term Traders Rely On:
Fundamental analysis (balance sheet, income statement, cash flow).
Valuation models (Discounted Cash Flow, P/E ratios).
Macroeconomic outlook (GDP growth, interest rates, inflation).
Patience and steady investment via SIPs (Systematic Investment Plans).
Psychology Behind Both Approaches
Psychology of Short-Term Traders
Need discipline and emotional control.
Greed and fear drive most mistakes.
High adrenaline, similar to professional gaming or sports.
Psychology of Long-Term Traders
Patience and conviction are crucial.
Must endure downturns without panic selling.
Delayed gratification mindset—willing to wait years for returns.
Costs and Taxes
Short-Term Trading: Frequent buying and selling means higher brokerage, slippage, and short-term capital gains tax (usually higher).
Long-Term Investing: Fewer transactions reduce costs. Long-term capital gains tax rates are often lower, helping wealth accumulation.
Who Should Choose What?
Short-Term Trading Suits:
Active individuals who can track markets daily.
Those comfortable with risk and volatility.
People looking for quick income rather than long-term wealth.
Long-Term Trading Suits:
Salaried professionals or business owners who can’t monitor markets daily.
People aiming for retirement planning, wealth creation, children’s education.
Investors who prefer stability over thrill.
Case Studies
Short-Term Example:
A trader in March 2020 (COVID crash) bought Nifty futures at 7,600 and sold at 8,000 within 2 days. Quick 400 points profit = massive gain.
Long-Term Example:
Someone who invested in Infosys IPO in 1993 (₹95 per share, adjusted for splits/bonuses) would now have wealth worth crores.
Blended Approach (Best of Both Worlds)
Many professionals suggest mixing both:
Keep 80% of funds in long-term investments (stable growth, retirement security).
Use 20% for short-term trading (to exploit opportunities, stay active, and generate extra income).
This way, you don’t miss out on compounding while also enjoying the benefits of active trading.
Advantages & Disadvantages Side by Side
Aspect Short-Term Trading Long-Term Trading
Time Horizon Minutes to weeks Years to decades
Risk Very high Moderate (if diversified)
Reward Potential High, quick Massive over time
Stress Level Very high Lower
Tools Used Technical charts Fundamental analysis
Costs High Low
Taxes Higher Lower
Skill Requirement Very high Moderate
Best For Active, aggressive traders Patient investors
Final Thoughts
Short-term trading and long-term investing are two sides of the same coin. One thrives on speed, volatility, and timing, while the other prospers through patience, consistency, and the power of compounding.
The truth is, there’s no universal “better” strategy. It depends on your personality, risk tolerance, financial goals, and lifestyle. Some people thrive in the fast action of short-term trades, while others find peace in buying good companies and letting time do the heavy lifting.
If you’re new to the market, starting with long-term investing is generally safer. Once you gain experience, you may gradually allocate some portion of your capital to short-term trading.
In the end, the best strategy isn’t about chasing the highest return, but about choosing the path you can follow consistently without losing peace of mind.
Inflation & Market Performance (2025 Context)1. Introduction
Inflation has always been one of the most critical variables in shaping market performance. It affects everything — from consumer spending and corporate profits to central bank policies and stock valuations. In 2025, inflation continues to remain a hot topic across global economies, especially after the turbulent years of post-pandemic recovery, geopolitical conflicts, energy shocks, and monetary tightening cycles.
Markets don’t react to inflation in isolation; they respond to expectations about inflation, interest rates, and growth. While mild inflation is seen as healthy, runaway inflation or deflation can shake investor confidence and distort asset pricing.
In this article, we will explore:
The nature of inflation in 2025 and its drivers.
How inflation influences stock markets, bond markets, commodities, and currencies.
Sector-wise winners and losers in high/low inflation scenarios.
The interplay of central bank policies and investor psychology.
India’s inflation-market dynamics in 2025 compared with global trends.
Long-term structural themes in inflation-linked market performance.
2. Inflation Basics: Why It Matters
Before we dive into the 2025 context, let’s refresh the basics.
Definition: Inflation is the sustained rise in the general price level of goods and services.
Measurement: Typically measured via CPI (Consumer Price Index), WPI (Wholesale Price Index), or PCE (Personal Consumption Expenditure index in the US).
Causes:
Demand-pull inflation (too much demand chasing limited supply).
Cost-push inflation (higher input costs like wages, oil, commodities).
Built-in inflation (expectations embedded into wage-price cycles).
Why markets care about inflation:
Corporate Earnings: Rising costs squeeze profit margins.
Interest Rates: Central banks raise rates to tame inflation, making borrowing costlier.
Bond Yields: Higher inflation reduces the real return on fixed-income instruments.
Valuations: Equity valuations (P/E ratios) decline as discount rates rise.
Sector Rotation: Some sectors thrive in inflation (commodities, energy), while others suffer (tech, consumer discretionary).
In short, inflation is a valuation driver, a sentiment shaper, and a policy trigger.
3. The Global Inflation Landscape in 2025
3.1 Post-Pandemic Normalization
The pandemic years (2020–2022) created supply chain disruptions, leading to soaring prices. By 2023–2024, central banks aggressively raised rates (US Fed, ECB, RBI) to cool inflation. By 2025, inflation rates in developed economies are lower than peak levels but remain sticky — slightly above central bank comfort zones.
US Inflation (2025): Moderated to ~3% but stubborn in services and housing.
Eurozone: Around 2.5%, with energy still a risk due to geopolitical tensions.
India: CPI hovering around 4.5–5.5%, close to RBI’s comfort band but sensitive to food and fuel shocks.
Emerging Markets: More volatile inflation, often linked to currency weakness and commodity imports.
3.2 Key Drivers in 2025
Energy Prices: Oil & natural gas remain unpredictable due to Middle East tensions and Russia-Ukraine war aftershocks.
Climate Events: Erratic monsoons, floods, and heatwaves impact agricultural output (food inflation).
Geopolitical Fragmentation: Supply chain re-shoring, trade restrictions, and technology export controls add structural cost pressures.
Wages: Labor markets are tight, especially in tech and healthcare, adding wage-push inflation.
In essence, inflation in 2025 is not runaway like 2022, but sticky, uneven, and multi-speed across regions.
4. Inflation and Stock Market Performance
4.1 General Market Trends
Mild Inflation (2–3%): Markets usually perform well, as it signals healthy growth.
Moderate Inflation (3–5%): Mixed market performance — cost pressures vs. growth optimism.
High Inflation (>6%): Equity markets usually decline, except for inflation-hedge sectors.
4.2 Sectoral Winners in 2025
Energy & Commodities:
Oil, gas, metals tend to rise with inflation.
Companies in these sectors enjoy pricing power.
Banks & Financials:
Benefit from higher interest margins when rates rise.
Loan growth might slow, but profitability improves.
FMCG & Consumer Staples:
Can pass on costs to consumers, maintaining margins.
Defensive demand makes them stable.
Real Estate & Infrastructure:
Tangible assets act as inflation hedges.
However, sensitive to interest rates.
4.3 Sectoral Losers in 2025
Technology & Growth Stocks:
High valuations get compressed under rising discount rates.
Investors shift to value/cyclical stocks.
Consumer Discretionary:
Higher inflation erodes consumer purchasing power.
Luxury goods and non-essentials see demand contraction.
Bond-Proxies (Utilities, REITs):
Lose appeal as bond yields rise.
Higher financing costs hurt profitability.
5. Inflation and Bond Markets
Bond markets are directly linked to inflation expectations.
Nominal Bonds: Inflation erodes real returns, leading to higher yields.
Inflation-Indexed Bonds (TIPS in the US, IIBs in India): Demand rises when inflation uncertainty increases.
Yield Curve:
Flattening or inversion signals that markets expect inflation to cool and growth to slow.
Steepening suggests prolonged inflation risks.
In 2025, bond yields are high compared to the pre-pandemic era, reflecting elevated risk premiums. Institutional investors are diversifying between nominal and inflation-linked bonds.
6. Inflation and Commodities
Commodities are direct beneficiaries of inflation.
Gold & Silver: Classic safe havens. In 2025, gold trades strong due to persistent inflation fears and central bank buying (especially by China & India).
Oil & Gas: Sensitive to geopolitical disruptions; higher prices fuel inflation.
Agricultural Commodities: Climate shocks and supply-chain fragmentation keep food prices elevated.
Thus, commodity cycles are tightly interwoven with inflation, making them critical for portfolio diversification.
7. Inflation and Currencies
Currencies react strongly to inflation differentials.
High inflation, weak currency: Investors dump the currency (e.g., Turkey, Argentina).
Controlled inflation, stable currency: Boosts investor confidence.
In 2025:
US Dollar (USD): Stronger compared to EM currencies due to sticky inflation and Fed’s restrictive stance.
Indian Rupee (INR): Relatively stable but under pressure when oil surges.
Euro (EUR): Mixed performance; energy dependency makes inflation management tricky.
Yen (JPY): Weak due to ultra-loose monetary policy, despite global inflation trends.
8. Central Banks and Inflation Control
8.1 Federal Reserve (US)
The Fed remains cautious in 2025. It cannot cut rates too aggressively as inflation is not fully tamed. Markets closely track every FOMC meeting, as Fed policy guides global liquidity.
8.2 Reserve Bank of India (RBI)
RBI balances inflation control with growth support. India’s food inflation remains a challenge, but structural reforms, better forex reserves, and stable inflows help anchor market confidence.
8.3 European Central Bank (ECB) & Others
ECB faces a tough balancing act — weak growth but still above-target inflation. Other central banks (BoE, BoJ) adopt diverse stances depending on domestic pressures.
9. Investor Psychology in Inflationary Times
Markets are not just numbers; they’re a reflection of human behavior. Inflation affects psychology in powerful ways:
Fear: Rising prices reduce real wealth, making investors risk-averse.
Speculation: Some chase commodities or real estate as hedges.
Rotation: Capital shifts from growth to value, from equity to bonds, from domestic to global.
Herding: Retail investors often chase inflation-hedge assets at late stages, creating bubbles.
In 2025, investor sentiment is cautious yet opportunistic — inflation is high enough to worry but not catastrophic.
10. India’s Inflation-Market Performance in 2025
India is a special case in inflation-market dynamics.
Inflation Drivers: Food (vegetables, pulses), fuel imports, and rural demand are key factors.
Equity Markets:
Nifty and Sensex show resilience, supported by domestic flows (SIPs, DIIs).
Sectors like banking, IT services exports, and infrastructure remain strong.
Midcaps and SMEs are volatile due to inflation-sensitive costs.
Bond Markets: Rising G-sec yields (6.5–7.5%) reflect inflation risks but attract foreign inflows.
Rupee: Stable around 83–85/USD but vulnerable to oil price spikes.
India’s structural growth story (demographics, digital adoption, reforms) keeps markets buoyant even under moderate inflation.
Conclusion
Inflation in 2025 is not a crisis but a constant companion for markets. It’s sticky, regionally diverse, and shaped by structural shifts in energy, demographics, and geopolitics.
For investors and traders, understanding inflation means understanding market performance. It dictates central bank actions, bond yields, sectoral rotations, and even investor psychology.
The key takeaway: Markets can thrive under mild-to-moderate inflation, but elevated inflation demands strategic repositioning. In 2025, successful investors are those who embrace flexibility, hedge intelligently, and adapt to inflation’s multi-dimensional impact.

Inflation & Interest Rates Shape Commodity PricesIntroduction
Commodities are the building blocks of the global economy. Crude oil fuels industries and transport, metals like copper and aluminum are vital for infrastructure and technology, while agricultural products like wheat, corn, and soybeans feed billions of people. But what truly drives their prices beyond just supply and demand?
Two of the most powerful forces are inflation and interest rates. These economic levers not only dictate consumer purchasing power and business costs, but also ripple through investment flows, currency valuations, and ultimately, the price of commodities across the globe.
In this discussion, we’ll dive deep into how inflation and interest rates shape commodity markets, exploring both theory and real-world cases, while keeping the explanation practical and easy to follow for traders, investors, and learners.
1. The Link Between Commodities and Inflation
1.1 Why Commodities Reflect Inflation
Commodities are often called the “canary in the coal mine” for inflation. That’s because:
When prices of raw materials like oil, metals, and food rise, the cost of finished goods increases.
Rising commodity prices feed into Consumer Price Index (CPI) and Wholesale Price Index (WPI).
This makes commodities not just a victim of inflation but also a driver of inflation.
For example:
If crude oil rises from $60 to $90 per barrel, fuel prices climb, logistics costs rise, and nearly every product (from groceries to electronics) becomes more expensive.
If wheat and corn prices jump, bread, meat, and packaged foods see higher retail prices.
Thus, inflation and commodities have a feedback loop.
1.2 Commodities as an Inflation Hedge
Investors often rush into commodities during inflationary times. Why?
Unlike paper currency, which loses value when inflation is high, commodities retain real value.
Gold, for instance, is historically seen as a store of value when fiat currencies weaken.
Energy and food are unavoidable necessities, so demand remains resilient even when money loses purchasing power.
This means in inflationary phases, commodity demand often rises not just for consumption, but for investment and speculation.
2. The Role of Interest Rates in Commodity Prices
Interest rates—set by central banks like the U.S. Federal Reserve, the RBI in India, or the ECB in Europe—act as the steering wheel of the economy. They determine the cost of borrowing, capital flows, and ultimately, investment appetite.
2.1 High Interest Rates and Commodities
When interest rates rise:
Borrowing becomes expensive, slowing down industrial production and construction.
This reduces demand for industrial commodities like steel, copper, and aluminum.
Investors shift money from risky assets (like commodities) into safe interest-bearing assets (like bonds).
Higher rates strengthen the local currency, which usually pushes commodity prices down (since most commodities are priced in USD).
Example: When the Fed raised interest rates aggressively in 2022, copper and aluminum prices dropped, reflecting weaker industrial demand.
2.2 Low Interest Rates and Commodities
When rates fall:
Borrowing is cheaper, stimulating economic activity.
Demand for commodities like oil, metals, and agricultural goods rises.
Investors seek returns in riskier assets, driving money into commodities and equities.
A weaker currency (due to low rates) often makes dollar-priced commodities cheaper for global buyers, increasing demand.
Example: After the 2008 global financial crisis, the Fed cut rates to near zero. Easy liquidity flooded into commodities, driving gold to record highs above $1,900 by 2011.
3. Inflation + Interest Rates: The Push-Pull Effect
Inflation and interest rates are not independent—they are two sides of the same coin. Central banks raise or lower interest rates mainly to control inflation.
High Inflation → Higher Interest Rates → Commodities pressured
Low Inflation → Lower Interest Rates → Commodities supported
But it’s not always linear. Some commodities, like gold, may rise both when inflation is high and when interest rates are high (if real interest rates are still negative).
4. Commodity-Specific Impacts
Let’s break down how inflation and interest rates affect major categories of commodities.
4.1 Energy (Oil, Natural Gas, Coal)
Inflationary effect: Energy is a primary driver of inflation since it impacts transport, electricity, and production costs. Rising oil prices often signal or cause inflation.
Interest rate effect: Higher rates can reduce oil demand as industries slow, but if inflation is too high, oil can still rise despite rate hikes (e.g., during 2022 Russia-Ukraine conflict).
4.2 Precious Metals (Gold, Silver, Platinum)
Inflationary effect: Gold and silver thrive when inflation is high, as investors use them as a hedge.
Interest rate effect: High interest rates typically hurt gold (since it doesn’t yield interest). However, if inflation exceeds rate levels (negative real interest rates), gold still shines.
4.3 Industrial Metals (Copper, Aluminum, Nickel)
Inflationary effect: Rising input and construction costs lift industrial metal prices.
Interest rate effect: Rate hikes slow housing, manufacturing, and infrastructure demand, weakening these metals.
4.4 Agricultural Commodities (Wheat, Corn, Soybeans, Sugar)
Inflationary effect: Food inflation hits hardest because it’s essential. Rising wages and population growth amplify the impact.
Interest rate effect: Higher rates increase farming credit costs and slow global trade, but food demand remains relatively inelastic.
5. Global Currency Connection
Most commodities are priced in U.S. dollars. That means:
When U.S. interest rates rise, the dollar strengthens, making commodities more expensive for buyers in other currencies → lower demand.
When rates fall, the dollar weakens, boosting demand globally → higher prices.
Thus, the USD Index and commodities often move inversely.
6. Historical Case Studies
6.1 1970s Stagflation
High oil prices + high inflation + weak growth.
Gold surged as an inflation hedge.
Central banks struggled to balance rates without worsening recession.
6.2 2008 Global Financial Crisis
Fed slashed rates → liquidity rush into commodities.
Gold, oil, and copper soared until demand collapsed during the recession.
6.3 2020 Pandemic & 2021–22 Inflation Surge
Initially, oil collapsed (negative prices in April 2020).
Massive stimulus + low rates → commodities roared back in 2021.
By 2022, inflation hit multi-decade highs → Fed hiked rates aggressively → commodity rally cooled except for energy (fueled by Ukraine war).
7. The Trader’s Perspective
For commodity traders and investors, understanding this cycle is critical:
Track inflation indicators (CPI, WPI, PPI).
Follow central bank policy (Fed, RBI, ECB).
Watch bond yields (real vs nominal).
Monitor USD Index (inverse relationship with commodities).
Example:
If inflation is rising but interest rates are low → bullish for commodities.
If inflation is peaking and central banks are hiking rates aggressively → bearish for commodities (except gold sometimes).
8. The Future: AI, Green Energy & Inflation Dynamics
Looking ahead:
Energy transition (from fossil fuels to renewables) will reshape how inflation flows into commodity markets. Lithium, cobalt, and rare earths may act like “new oil.”
AI-driven trading will make interest rate expectations even more quickly reflected in commodity prices.
Geopolitical conflicts will add to supply-driven inflation shocks, as seen in oil and wheat during Russia-Ukraine.
Conclusion
Inflation and interest rates are like the yin and yang of commodity pricing. Inflation fuels higher prices by raising demand for real assets, while interest rates act as the braking system, cooling overheated demand and strengthening currencies.
For traders, investors, and businesses, understanding this balance is essential. Commodities don’t just respond to supply and demand—they are deeply intertwined with monetary policy, global currency flows, and the psychology of inflation.
In simple terms:
Inflation pushes commodities up.
Interest rates can pull them down.
But the net effect depends on timing, central bank actions, and market sentiment.
Mastering this relationship is the key to anticipating commodity price trends in an ever-changing global economy.
Part 10 Trading Master Class 1. Introduction – What are Options?
Imagine you want to buy a house, but you are not fully sure. The seller says:
“You can pay me ₹1 lakh today as a token, and within the next 3 months you have the right (not obligation) to buy this house for ₹50 lakh. If you don’t buy, I will keep your ₹1 lakh.”
That token money is exactly like an option premium.
If house prices shoot up to ₹60 lakh, you can buy it at ₹50 lakh (huge profit).
If prices fall to ₹40 lakh, you don’t buy, and you only lose ₹1 lakh.
This is the essence of options trading:
Right but not obligation to buy/sell at a fixed price within a fixed time.
Limited loss (premium paid).
Unlimited potential profit.
In stock markets, instead of houses, you deal with shares, indexes, or commodities.
2. How Options Work
Options are part of the derivatives market (value is derived from something else).
Underlying asset: Could be NIFTY, Bank NIFTY, Reliance stock, Gold, etc.
Strike price: Pre-decided price at which you may buy/sell.
Expiry: Fixed date (weekly/monthly).
Premium: Price you pay to buy the option.
Options are of two main types:
Call Option (CE) → Right to buy at a fixed price.
Put Option (PE) → Right to sell at a fixed price.

Part 9 Trading Master Class Options in Indian Markets
Options are hugely popular in India, especially on NIFTY & Bank NIFTY.
Weekly expiries (every Thursday) attract massive trading.
Liquidity is high → easy to enter/exit.
Retail traders mostly buy options, institutions mostly sell options.
Example:
Bank NIFTY at 48,000.
Retail traders buy 48,500 CE or 47,500 PE hoping for movement.
Institutions sell far OTM options like 49,500 CE or 46,500 PE to collect premium.
Psychology & Discipline
Most beginners lose in options because:
They only buy OTM options (cheap but low probability).
They ignore time decay (premium melts fast).
They overtrade with leverage.
Success in options = discipline, risk control, strategy, patience.
Pro tips:
Never put all money in one trade.
Understand probability – 70% of options expire worthless.
Use stop-loss and position sizing.

Part 8 Trading Master Class Calls & Puts with Real-Life Examples
Call Option Example
Suppose Reliance stock is trading at ₹2,500.
You buy a Call Option with strike price ₹2,600, paying a premium of ₹50.
If Reliance goes to ₹2,800, your profit = (2800 - 2600 - 50) = ₹150 per share.
If Reliance stays below 2600, you lose only the premium = ₹50.
A call option = bullish bet (you expect prices to rise).
Put Option Example
NIFTY is at 22,000.
You buy a Put Option strike 21,800, premium ₹80.
If NIFTY falls to 21,200 → Profit = (21800 - 21200 - 80) = ₹520 per lot.
If NIFTY rises above 21,800, you lose only ₹80.
A put option = bearish bet (you expect prices to fall).
Why Traders Use Options
Options are powerful because they allow:
Leverage – Control large value with small money (premium).
Example: Buying Reliance stock directly at ₹2,500 may cost ₹2.5 lakh (100 shares). But buying a call option may cost just ₹5,000.
Hedging – Protect portfolio from losses.
Example: If you hold Infosys shares, you can buy a put option to protect against downside.
Speculation – Bet on market direction with limited risk.
Income generation – Selling options (covered calls, cash-secured puts) generates steady income.

Part 7 Trading Master Class Calls & Puts with Real-Life Examples
Call Option Example
Suppose Reliance stock is trading at ₹2,500.
You buy a Call Option with strike price ₹2,600, paying a premium of ₹50.
If Reliance goes to ₹2,800, your profit = (2800 - 2600 - 50) = ₹150 per share.
If Reliance stays below 2600, you lose only the premium = ₹50.
A call option = bullish bet (you expect prices to rise).
Put Option Example
NIFTY is at 22,000.
You buy a Put Option strike 21,800, premium ₹80.
If NIFTY falls to 21,200 → Profit = (21800 - 21200 - 80) = ₹520 per lot.
If NIFTY rises above 21,800, you lose only ₹80.
A put option = bearish bet (you expect prices to fall).
Why Traders Use Options
Options are powerful because they allow:
Leverage – Control large value with small money (premium).
Example: Buying Reliance stock directly at ₹2,500 may cost ₹2.5 lakh (100 shares). But buying a call option may cost just ₹5,000.
Hedging – Protect portfolio from losses.
Example: If you hold Infosys shares, you can buy a put option to protect against downside.
Speculation – Bet on market direction with limited risk.
Income generation – Selling options (covered calls, cash-secured puts) generates steady income.

Option Trading 1. Introduction – What are Options?
Imagine you want to buy a house, but you are not fully sure. The seller says:
“You can pay me ₹1 lakh today as a token, and within the next 3 months you have the right (not obligation) to buy this house for ₹50 lakh. If you don’t buy, I will keep your ₹1 lakh.”
👉 That token money is exactly like an option premium.
If house prices shoot up to ₹60 lakh, you can buy it at ₹50 lakh (huge profit).
If prices fall to ₹40 lakh, you don’t buy, and you only lose ₹1 lakh.
This is the essence of options trading:
Right but not obligation to buy/sell at a fixed price within a fixed time.
Limited loss (premium paid).
Unlimited potential profit.
In stock markets, instead of houses, you deal with shares, indexes, or commodities.
2. How Options Work
Options are part of the derivatives market (value is derived from something else).
Underlying asset: Could be NIFTY, Bank NIFTY, Reliance stock, Gold, etc.
Strike price: Pre-decided price at which you may buy/sell.
Expiry: Fixed date (weekly/monthly).
Premium: Price you pay to buy the option.
Options are of two main types:
Call Option (CE) → Right to buy at a fixed price.
Put Option (PE) → Right to sell at a fixed price.

Divergence SecretsWhat Are Options?
Options are derivative contracts that give the buyer the right (but not the obligation) to buy or sell an underlying asset (like stocks, index, currency, or commodity) at a predetermined price on or before a specific date.
Call Option (CE): Right to buy.
Put Option (PE): Right to sell.
Key Terms in Options
To understand options, you must know these basics:
Strike Price: The pre-decided price at which you can buy/sell the asset.
Premium: The cost you pay to buy the option contract.
Expiry Date: The date when the option contract ends.
Underlying Asset: The stock, index, or commodity linked to the option.
Lot Size: Minimum quantity you can trade in options (e.g., Nifty lot = 50 units).
Call vs Put Options
Call Option Buyer: Expects price to rise (bullish).
Put Option Buyer: Expects price to fall (bearish).
Call Option Seller: Expects price to stay below strike.
Put Option Seller: Expects price to stay above strike.

Part 2 Support And ResistanceWhy Trade Options?
Leverage – You control large positions with small capital (premium).
Hedging – Protect portfolio from losses. (Insurance-like function).
Speculation – Bet on price movement (up, down, or sideways).
Income Generation – By selling options (collecting premiums).
Example in Real Life
Suppose you think Nifty (index) will go up:
Instead of buying Nifty futures (which needs big margin),
You buy a Nifty Call Option by paying just a small premium.
If Nifty rises, your profit multiplies due to leverage.
If Nifty falls, your maximum loss is only the premium paid.
In simple words: Options = flexibility + leverage + risk control.
They are widely used by retail traders, institutions, and hedgers across the world.

Part 1 Support And ResistanceWhat are Options?
Options are a type of derivative instrument in financial markets.
This means their value is derived from an underlying asset, such as stocks, indices, commodities, or currencies.
An option gives you the right, but not the obligation, to buy or sell the underlying asset at a predefined price (strike price) before or on a specific date (expiry date).
Types of Options
Call Option – Right to buy an asset at a fixed price before expiry.
Example: If you buy a call option of Reliance at ₹2,500, and the stock goes up to ₹2,700, you can still buy at ₹2,500 and profit.
Put Option – Right to sell an asset at a fixed price before expiry.
Example: If you buy a put option of Infosys at ₹1,500, and the stock falls to ₹1,300, you can still sell at ₹1,500 and profit.
Key Terms in Options
Premium – Price you pay to buy the option.
Strike Price – Pre-decided price at which you can buy/sell.
Expiry – The last date till which the option is valid.
ITM (In the Money) – Option has intrinsic value.
OTM (Out of the Money) – Option has no intrinsic value (only time value).

Sectoral Rotation & Thematic TradingIntroduction
The stock market is like a living organism – it breathes, evolves, and reacts differently under various economic and business conditions. If you observe closely, not all stocks move the same way at the same time. Some industries boom while others struggle, depending on interest rates, inflation, consumer demand, government policies, or even global events.
This constant shift of money from one sector to another is called sectoral rotation. Investors and traders who understand this flow can position themselves ahead of the curve, capturing strong returns from sectors that are about to outperform.
Alongside sector rotation, another powerful concept has gained popularity – thematic trading. Instead of focusing on short-term cycles, thematic investing captures long-term structural trends such as digitization, renewable energy, electric vehicles (EVs), artificial intelligence (AI), or climate change. These themes can cut across multiple sectors and create massive wealth opportunities.
Together, sectoral rotation and thematic trading provide a dual framework – one that captures short- to medium-term economic cycles, and another that taps into long-term megatrends. Let’s dive deep into both strategies.
Part 1: Understanding Sectoral Rotation
What is Sectoral Rotation?
Sectoral rotation is the strategy of moving investments across different sectors of the economy based on where money is likely to flow next.
Think of it like this:
During an economic boom, consumer spending rises → retail, automobiles, travel, and entertainment perform well.
When inflation rises, defensive sectors like FMCG, pharma, and utilities outperform because demand for essentials is steady.
In recovery phases, banking, infrastructure, and capital goods tend to benefit as credit and investments flow.
Smart traders ride this rotation of capital to maximize returns.
Why Does Sectoral Rotation Happen?
The economy moves in cycles, and different sectors react differently:
Interest Rate Sensitivity – When rates rise, sectors like banks may benefit (higher margins), while real estate may suffer (loans get costly).
Commodity Prices – High crude oil benefits oil & gas companies but hurts airlines.
Government Policies – A focus on renewable energy, infrastructure spending, or PLI schemes (Production Linked Incentives) boosts specific industries.
Global Trends – A technology boom in the US may spill over to Indian IT companies.
Earnings Cycle – Quarterly results highlight which industries are growing faster.
So, sector rotation is essentially the movement of money chasing relative strength across industries.
Sectoral Rotation and the Economic Cycle
Here’s how different sectors usually perform in economic cycles:
Early Recovery (Post-recession)
Beneficiaries: Banks, capital goods, infrastructure, real estate, auto.
Reason: Cheap money, rising demand, and credit expansion.
Mid-cycle Growth (Boom period)
Beneficiaries: Technology, manufacturing, consumer discretionary, travel, luxury goods.
Reason: Rising consumption and business expansion.
Late-cycle (Inflation & High Growth)
Beneficiaries: Energy, metals, commodities, FMCG, pharma.
Reason: Rising input prices, defensive consumption plays.
Downturn / Recession
Beneficiaries: FMCG, healthcare, utilities.
Reason: Essentials remain stable even in slowdown.
By understanding this cycle, traders can pre-position in sectors before they peak.
Tools & Indicators for Sectoral Rotation
Relative Strength (RS) Analysis – Compare one sector index vs. Nifty 50 to see outperformance.
Sectoral Indices – Nifty Bank, Nifty IT, Nifty FMCG, Nifty Pharma, etc. show trends clearly.
Volume & Price Breakouts – Surging volumes in sector leaders signal capital inflows.
Global Correlations – For IT, look at Nasdaq; for metals, track global commodity prices.
Macro Data – Interest rates, inflation numbers, IIP (Index of Industrial Production).
Sectoral Rotation in Indian Context
In India, sectoral plays are extremely visible:
2017–2019: IT and FMCG were strong as global tech demand rose and consumption stayed stable.
2020 (Covid crash): Pharma and IT outperformed while travel, banking, and autos collapsed.
2021: Banks, metals, real estate, and infra rallied as reopening boosted demand.
2022: Commodities surged due to the Russia-Ukraine war, while IT corrected after huge 2020–21 gains.
2023–2025: Energy transition (renewables, EVs), digital India, and PSU stocks have seen huge money rotation.
This proves sector rotation is not just theory – it’s visible in price action year after year.
Sectoral Rotation Trading Strategies
Rotational Allocation – Regularly move capital into outperforming indices (Bank Nifty, IT, Pharma).
Pair Trading – Go long a strong sector and short a weak one (e.g., Long IT / Short FMCG).
Top-Down Approach – First identify strong sector → then pick leading stocks in that sector.
ETF or Sectoral Funds – For investors who don’t want to pick individual stocks.
Event-Driven Rotation – Budget focus on infra? Buy infra stocks. RBI rate hike? Play banking.
Part 2: Thematic Trading
What is Thematic Trading?
While sectoral rotation looks at cyclical shifts, thematic trading focuses on long-term structural changes in the economy.
A theme is a broad investment idea that goes beyond individual sectors. For example:
Green Energy Theme: Includes solar, wind, EVs, batteries, and related supply chains.
Digital India Theme: Covers IT services, fintech, e-commerce, data centers, semiconductors.
Healthcare Theme: Pharma, diagnostics, insurance, medical devices.
Unlike sector rotation (which is cyclical), thematic investing is secular – it rides megatrends that play out over years or decades.
Why Thematic Trading Works
Government Push – Policies like “Make in India”, “PLI Schemes”, “Atmanirbhar Bharat” create multi-year opportunities.
Global Structural Shifts – AI, automation, and clean energy are not fads – they’re irreversible trends.
Changing Consumer Behavior – Millennials prefer digital payments, EVs, and sustainable products.
Innovation & Technology – Disruptive technologies create new industries from scratch.
Thematic trading aligns your portfolio with where the world is headed.
Popular Themes in India
Renewable Energy & EVs – Adani Green, Tata Power, NTPC Renewables, EV battery makers.
Digital & IT Transformation – Infosys, TCS, Tech Mahindra, SaaS companies, data centers.
Banking & Financial Inclusion – Fintech startups, PSU banks revival, UPI-based payments.
Healthcare & Pharma 2.0 – Biotech, vaccines, hospital chains, digital health platforms.
Infrastructure Boom – Railways, defense, roads, ports, smart cities.
Consumer Growth Story – Premium FMCG, e-commerce, retail, luxury consumption.
AI & Automation – Robotics, semiconductor, chip manufacturing, AI-driven SaaS.
Thematic Trading Strategies
Theme-first, stock-next – Identify a powerful trend → select companies best positioned to benefit.
ETF / Mutual Fund Route – Many thematic mutual funds (IT, infra, pharma) are available.
Long-Term Holding – Unlike rotation, themes require patience (5–10 years horizon).
Event-Based Entry – E.g., Global push for EV → enter when government announces subsidies.
Diversification within Theme – If betting on EV, don’t only buy car makers – also look at battery suppliers, charging infra, mining companies.
Risks in Thematic Trading
Overhype & Bubbles – Not every theme sustains (e.g., dot-com bubble).
Policy Dependency – If subsidies or government support fades, themes collapse.
Concentration Risk – Over-investing in one theme can hurt if it fails.
Execution Risk – Companies may not adapt fast enough to benefit from themes.
Hence, while themes are powerful, one must balance enthusiasm with realism.
Part 3: Combining Sectoral Rotation & Thematic Trading
A smart trader doesn’t choose one over the other – both strategies complement each other.
Sectoral Rotation → Captures short-term cyclical opportunities (3–12 months).
Thematic Trading → Rides long-term structural megatrends (5–10 years).
For example:
Theme: Renewable Energy (10+ years)
Sector Rotation: Within this theme, solar may outperform first, then EV batteries, then power utilities.
By combining both, you get the best of both worlds – short-term timing + long-term conviction.
Practical Framework for Traders & Investors
Macro Analysis First – Track GDP growth, inflation, interest rates, budget, and global trends.
Identify Sector Winners – Use sectoral indices & relative strength to see where money is flowing.
Overlay Themes – Check if the sector fits into a bigger theme (e.g., railways in infra theme).
Stock Selection – Pick leaders (highest market share, strong balance sheet, institutional backing).
Risk Management – Use stop-losses in trading; diversify across themes for investing.
Review & Rotate – Monitor quarterly results, news, and policy changes.
Case Studies
Case 1: Indian IT Boom (2000s–2020s)
Theme: Global digitization and outsourcing.
Sectoral Rotation: IT outperformed whenever global tech demand surged, then corrected during recessions.
Result: Infosys, TCS, Wipro created massive wealth.
Case 2: Renewable Energy (2020s)
Theme: Green energy transition.
Sectoral Rotation: Solar companies first, then EV batteries, then hydrogen economy.
Result: Adani Green, Tata Power, NTPC Renewables saw huge investor inflows.
Case 3: Banking Recovery Post-2019
Theme: Financial inclusion and digital banking.
Sectoral Rotation: PSU banks outperformed after years of underperformance due to NPA cleanup.
Result: Bank Nifty became one of the best-performing indices by 2023.
Advantages of Sectoral Rotation & Thematic Trading
Be Ahead of the Curve – Spot where money is moving before the crowd.
Diversification with Focus – Instead of random stock-picking, you align with strong groups.
Capture Both Cycles & Megatrends – Short-term opportunities + long-term wealth creation.
Higher Conviction – Investing with logic and evidence reduces emotional decisions.
Challenges
Timing is Hard – Entering too early or too late in rotation reduces returns.
False Themes – Not every hyped theme sustains (3D printing, VR, etc.).
Global Dependence – Many Indian sectors are linked to global trends (IT, metals).
Information Overload – Too many narratives make it hard to pick the right one.
Conclusion
Sectoral rotation and thematic trading are not just buzzwords – they are powerful frameworks to navigate markets intelligently. Sectoral rotation teaches us that markets are cyclical, and different industries lead at different times. Thematic trading shows us that beyond cycles, there are megatrends shaping the future.
The best traders and investors combine both – timing their entries with sectoral strength while riding multi-decade themes.
In simple terms:
Follow the money (sector rotation).
Follow the future (themes).
Do this consistently, and you’ll not only trade like a pro but also invest like a visionary.
Event-Driven & Earnings Trading1. Introduction to Event-Driven Trading
Event-driven trading is a strategy where traders take positions in securities based on the expectation of a specific event and its potential market impact. Unlike long-term investors who might ignore short-term fluctuations, event-driven traders thrive on these catalysts because they create rapid price movements.
Events can be company-specific (like an earnings release), sector-wide (like regulatory approval for a new drug), or macroeconomic (like a Federal Reserve interest rate decision).
Key Characteristics:
Focuses on short- to medium-term price movements.
Involves research, timing, and speed.
Relies heavily on information flow and news tracking.
Often used by hedge funds, proprietary traders, and active retail traders.
2. Types of Event-Driven Trading
There are many forms of event-driven trading. Here are the most important ones:
a) Earnings Announcements
Quarterly earnings reports are one of the most predictable events. They reveal a company’s profitability, revenue growth, and outlook. Traders position themselves before or after these announcements.
Pre-earnings trades: Betting on volatility leading up to the release.
Post-earnings trades: Reacting quickly to surprises (earnings beats or misses).
b) Mergers & Acquisitions (M&A)
When companies announce mergers, the stock prices of both target and acquiring firms react sharply. Event-driven traders try to profit from these discrepancies.
Merger arbitrage: Buying the target company’s stock at a discount to the announced acquisition price, while sometimes shorting the acquirer.
c) Regulatory & Legal Events
Approval or rejection of drugs, antitrust rulings, or new government policies can send sectors soaring or crashing. For instance, a favorable ruling for a tech company can boost its stock, while a ban can sink it.
d) Macroeconomic Events
These include interest rate decisions, inflation reports, GDP data, central bank speeches, and geopolitical tensions. Traders anticipate how these events affect equities, currencies, and commodities.
e) Corporate Announcements Beyond Earnings
Stock splits
Dividend declarations
Buybacks
Management changes
3. Earnings Trading: A Specialized Event-Driven Strategy
Earnings trading is perhaps the most popular form of event-driven trading because:
Earnings dates are known well in advance.
The results often cause large price gaps.
Institutional investors and analysts closely track them.
Key Earnings Components:
Earnings Per Share (EPS): Profit divided by outstanding shares.
Revenue Growth: Top-line performance.
Guidance: Management’s future expectations.
Margins: Profitability ratios.
A company that beats analyst expectations often sees its stock jump, while a miss usually causes a drop. However, markets sometimes react differently than expected due to guidance, sentiment, or broader market conditions.
4. How Event-Driven & Earnings Trading Works in Practice
Let’s break down the trading process step by step.
Step 1: Research and Preparation
Track corporate calendars: Know when earnings, product launches, or policy announcements are scheduled.
Read analyst estimates: Consensus EPS/revenue forecasts.
Check historical reactions: How has the stock moved in past earnings?
Step 2: Pre-Event Positioning
Some traders enter before the event, speculating on outcomes. This is riskier but offers high reward if they are right.
Step 3: Trading During the Event
High-frequency traders (HFTs) and algorithmic traders react within milliseconds to earnings headlines or economic data. Retail traders typically react slightly slower, but can still profit from post-announcement moves.
Step 4: Post-Event Trading
Markets often overreact initially, creating opportunities for mean reversion or continuation plays. Skilled traders wait for confirmation before entering.
5. Tools for Event-Driven & Earnings Traders
To succeed, traders use a mix of technology, data, and analysis:
Economic & earnings calendars (e.g., Nasdaq, Investing.com, NSE/BSE announcements).
News terminals (Bloomberg, Reuters, Dow Jones Newswires).
Options market data: Implied volatility often spikes before earnings.
Charting tools & technical analysis for timing entries/exits.
Sentiment analysis tools: Tracking social media, analyst ratings, insider activity.
6. Trading Strategies
a) Pre-Earnings Volatility Trading
Buy options (straddles/strangles) expecting large price swings.
Short options if volatility is overpriced.
b) Post-Earnings Drift
Stocks often continue moving in the direction of the earnings surprise for several days or weeks. Traders ride this momentum.
c) Gap Trading
When a stock gaps up or down after earnings, traders wait for pullbacks or breakouts to position.
d) Merger Arbitrage
Buy the target, short the acquirer. Profit when the deal closes.
e) Event Hedging
Using options or futures to hedge positions ahead of risky events.
7. Risks in Event-Driven & Earnings Trading
While potentially rewarding, these strategies carry unique risks:
Event Uncertainty: Even if you predict earnings correctly, stock reaction may differ.
Volatility Risk: Sudden price gaps can wipe out traders using leverage.
Liquidity Risk: Smaller stocks may not have enough trading volume.
Information Asymmetry: Institutions with faster access to data may move ahead of retail traders.
Overconfidence: Traders often assume they can “predict” outcomes better than the market.
8. Psychology of Event-Driven Trading
Event-driven trading is highly psychological because it involves anticipation and reaction. Common biases include:
FOMO (Fear of Missing Out): Jumping into trades too late.
Confirmation Bias: Interpreting results in line with pre-existing beliefs.
Overtrading: Trying to catch every earnings play.
Emotional Volatility: Stress from sudden price moves.
Traders who remain calm, disciplined, and data-driven usually succeed more consistently.
9. Institutional vs. Retail Approaches
Institutions:
Have quants, algorithms, and real-time feeds.
Specialize in merger arbitrage, distressed debt, macro-event plays.
Can hedge using derivatives efficiently.
Retail Traders:
Limited by speed and access to insider info.
Best focus is earnings trading, technical post-event setups, or selective option strategies.
10. Case Studies
Case 1: Tesla Earnings
Tesla often beats or misses expectations dramatically, causing 8–15% post-earnings moves. Traders use options straddles to capture volatility.
Case 2: Pfizer & FDA Approval
When Pfizer announced vaccine approval, the stock spiked sharply. Event-driven traders who anticipated approval profited heavily.
Case 3: Reliance Jio Deals (India)
During 2020, Reliance Industries announced multiple foreign investments in Jio. Each event triggered price rallies, rewarding event-driven traders.
Conclusion
Event-driven and earnings trading is not for the faint-hearted—it demands preparation, quick thinking, and strong discipline. While the potential rewards are high, so are the risks. The best traders treat it as a probability game, not a prediction contest.
By mastering research, tools, psychology, and risk management, traders can consistently capture opportunities from corporate earnings, M&A deals, regulatory events, and macroeconomic announcements.
In short, event-driven trading is about being at the right place at the right time—but with the right plan.
Narrative-Based TradingIntroduction
Financial markets are often portrayed as mathematical and data-driven—filled with algorithms, technical charts, and economic models. But beneath that seemingly rational layer lies something deeply human: stories. Investors, traders, and even institutions make decisions not just on numbers but also on narratives—coherent stories that explain why markets move, why a company has potential, or why a sector is “the next big thing.”
This is the essence of Narrative-Based Trading (NBT). Instead of relying only on earnings, charts, or interest rates, traders also weigh the power of collective belief shaped through stories. Whether it’s the “AI boom,” “India growth supercycle,” “EV disruption,” or “crypto revolution,” narratives influence flows of capital.
Robert Shiller, the Nobel laureate economist, introduced the concept of Narrative Economics, where he argued that viral stories influence markets as much as fundamentals do. Traders who understand and anticipate these narratives can position themselves ahead of the crowd.
What Is Narrative-Based Trading?
Narrative-Based Trading is the strategy of identifying, interpreting, and trading financial assets based on dominant market stories that shape investor psychology.
In other words:
Markets move not only on facts but also on the stories built around those facts.
Traders who can read and ride these narratives can capture big moves.
For example:
The dot-com bubble (1999–2000) was not just about internet adoption—it was about the story that “the internet will change everything.”
The crypto boom (2017 & 2020–21) was not just about blockchain—it was about the story of “decentralized money replacing banks.”
The EV rally (2020–22) was not just about electric cars—it was about the story of “the end of fossil fuels.”
Narratives can push valuations beyond fundamentals because humans are wired to respond emotionally to stories more than to raw numbers.
The Psychology Behind Narrative-Based Trading
1. Humans Think in Stories
Cognitive science shows our brains are wired to understand information in the form of narratives. We remember stories far more easily than spreadsheets.
For instance:
Saying “AI will take over jobs and revolutionize industries” excites emotions more than “AI companies’ CAGR is 14%.”
That emotional excitement fuels buying pressure.
2. Fear of Missing Out (FOMO)
Narratives spread like memes. Once everyone believes “EV is the future,” investors don’t want to miss the ride. This collective enthusiasm drives prices higher—even when fundamentals lag.
3. Confirmation Bias
Investors seek stories that confirm their beliefs. If you believe India is the “next growth superpower,” you’ll look for and invest in stocks that support that story.
4. Social Proof
When big investors, influencers, or media outlets endorse a narrative, others follow—just like viral trends on social media.
Key Elements of a Market Narrative
Every powerful narrative usually contains:
A Vision of the Future – e.g., “AI will redefine industries.”
A Villain or Obstacle – e.g., “Traditional banks are outdated; DeFi will replace them.”
A Hero or Winner – e.g., “Tesla will dominate EV markets.”
An Emotional Hook – e.g., “Clean energy will save the planet.”
Simplicity – Narratives spread when they’re easy to explain.
When a story has all these elements, it spreads fast and influences prices.
Historical Examples of Narrative-Driven Markets
1. Dot-Com Bubble (1999–2000)
Narrative: “The internet will revolutionize business.”
Reality: True, but early. Many companies had no earnings, only websites.
Outcome: Nasdaq rose 400% in 5 years, then crashed 78%.
2. Bitcoin & Crypto (2017, 2020–21)
Narrative: “Decentralized money will free us from central banks.”
Reality: Blockchain has utility, but valuations were inflated by hype.
Outcome: Bitcoin rose from $1,000 → $20,000 (2017), then crashed, later reaching $69,000 in 2021.
3. Tesla & EV Mania (2019–2022)
Narrative: “The end of oil, EVs will dominate.”
Reality: EV adoption is growing, but valuations became extreme.
Outcome: Tesla’s stock went from ~$40 in 2019 → $1200 in 2021 before correcting.
4. India Growth Supercycle (2023–2025)
Narrative: “India is the next China.”
Reality: India has demographics, reforms, and digital adoption.
Outcome: Indian indices outperformed, with foreign investors pouring in.
Identifying Narratives Early
The challenge for traders is spotting a narrative before it goes mainstream. Some tools and signals include:
Media Monitoring – Watch financial news, trending topics, and CEO statements.
Social Media Sentiment – Platforms like X (Twitter), Reddit, StockTwits, YouTube often amplify narratives before mainstream media catches on.
Google Trends – Rising searches for “AI stocks” or “EV companies” show growing interest.
Options & Volume Flow – Spikes in call buying often signal retail narrative adoption.
Venture Capital Activity – If VCs are pouring billions into a sector, the narrative is building.
How to Trade Narratives
1. Early Adoption Phase
Narrative is in niche circles (forums, VC blogs).
Stocks are undervalued, only a few believers.
Strategy: Enter early, accumulate, low risk high reward.
2. Mainstream Adoption Phase
Media picks it up, retail floods in.
Stocks rally sharply.
Strategy: Ride the trend, but manage risk.
3. Euphoria Phase
Everyone is talking about it.
Valuations detach from fundamentals.
Strategy: Take profits, prepare for exit.
4. Collapse / Reality Check
Narrative cracks when fundamentals can’t keep up.
Price correction or bubble burst.
Strategy: Avoid fresh buys, short opportunities possible.
Tools and Techniques for Narrative-Based Traders
Narrative Mapping
Write down the story driving the asset.
Identify the hero (leading company/stock), villains (competitors), and catalysts (events).
Volume Profile & Market Structure
Check if the narrative is supported by actual participation.
High volume spikes = narrative adoption.
Event Tracking
Government policies, product launches, speeches, or geopolitical events can fuel narratives.
Cross-Asset Analysis
Narratives often spill over.
Example: AI narrative lifted not just Nvidia, but also cloud, chipmakers, and robotics.
Exit Framework
Always define conditions when narrative breaks.
Example: If government policy reverses, or adoption slows, exit quickly.
Risks of Narrative-Based Trading
Hype vs Reality Gap
Narratives often run far ahead of fundamentals.
Risk: Holding too long into a bubble burst.
Confirmation Bias
Traders may ignore evidence against the story.
Overcrowding
Once everyone is in, upside is limited.
Policy & Regulation
Narratives like crypto or EV subsidies depend heavily on policy support.
Short Narrative Lifespan
Some stories burn out quickly (e.g., “Metaverse” hype in 2021).
Case Study: The AI Narrative (2023–2025)
Early Stage (2022): ChatGPT launch → small AI startups gained attention.
Adoption (2023): Nvidia earnings blowout, AI “arms race” headlines.
Mainstream (2024–2025): AI became part of every investor deck.
Euphoria Signs: Even non-AI firms rebranded themselves as “AI-driven.”
Trading Strategy:
Early buyers of Nvidia, AMD, Microsoft captured 200–400% gains.
By late 2024, caution needed as valuations stretched.
Narrative vs Fundamentals vs Technicals
Fundamentals – Show “what should happen” based on earnings, cash flows.
Technicals – Show “what is happening” in price & volume.
Narratives – Show “what people believe will happen.”
The best traders combine all three:
Use narratives for trend identification.
Use technicals for timing entries/exits.
Use fundamentals for long-term conviction.
Building a Narrative-Based Trading Strategy
Scan Narratives (media, VC, policy, social buzz).
Validate with Data (Google trends, volume, institutional flows).
Select Leaders (stocks most associated with narrative).
Define Entry Point (technical confirmation).
Scale with Trend (add as narrative strengthens).
Exit with Rules (valuation excess, fading news, policy reversal).
The Future of Narrative-Based Trading
AI Tools will help detect emerging narratives via sentiment analysis.
Retail Power (Reddit, Telegram, Twitter) will keep driving viral trades.
Geopolitical Narratives (e.g., “China vs US tech war”) will grow stronger.
Sustainability & ESG Narratives (“Green transition,” “India digitalization”) will dominate long-term.
Narrative-based trading will not replace fundamentals but will remain a critical layer of market psychology.
Conclusion
Narrative-Based Trading reminds us that markets are not just numbers—they are stories we tell ourselves about the future. The most powerful stories spread, shape collective belief, and move billions of dollars.
For traders, the key is not blindly following hype but understanding when a story is gaining traction, when it’s peaking, and when reality is about to check it.
If you can learn to read market narratives like a storyteller, you can trade not just with charts and balance sheets—but with the heartbeat of the market itself.
Algo AutomationIntroduction
Trading and investing have come a long way from the days of physical stock exchanges, where brokers shouted buy and sell orders on the trading floor. Today, almost 80–90% of global market volume is generated through algorithmic trading (algo trading). In simple words, algo automation refers to the process of using computer programs, rules, and mathematical models to execute trades automatically—without human emotions interfering.
But algo automation is not just about “pressing a button and letting the computer trade.” It is a complete ecosystem that involves strategy building, coding, backtesting, optimization, execution, and risk management. From hedge funds on Wall Street to retail traders in India using platforms like Zerodha Streak or TradingView, algo automation has become an integral part of modern trading.
This article will break down algo automation in detail—covering concepts, history, strategies, benefits, risks, real-world applications, and the future.
1. What is Algo Automation?
Algo automation means creating a set of rules or instructions for the computer to follow while trading. These rules are usually based on:
Price
Volume
Technical indicators (moving averages, RSI, MACD, etc.)
Fundamental triggers (earnings announcements, balance sheet ratios)
Market events (news, interest rate changes, etc.)
Once the rules are coded into a software program, the algorithm monitors the market continuously and executes trades automatically whenever conditions are met.
Example:
Suppose you design a simple rule—
Buy Nifty futures if the 50-day moving average crosses above the 200-day moving average (Golden Cross).
Sell when the 50-day crosses below the 200-day moving average (Death Cross).
Instead of you sitting in front of the screen all day, the algorithm keeps checking and executes the trade instantly when conditions trigger.
This is algo automation in action.
2. The Evolution of Algo Automation
1970s: Early forms of program trading began in the US. Computers helped execute large orders faster.
1980s: Index arbitrage became popular—traders used algos to exploit price differences between futures and cash markets.
1990s: With better computing power, hedge funds like Renaissance Technologies used quantitative models to trade.
2000s: High-Frequency Trading (HFT) boomed, where algos executed trades in microseconds.
2010s onwards: Algo automation became available to retail traders with platforms like MetaTrader, Amibroker, NinjaTrader, Zerodha Streak, and TradingView.
Today, even small traders can run automated systems with as little as ₹10,000 capital, thanks to broker APIs and cloud-based systems.
3. Key Components of Algo Automation
Algo automation is not just about writing code. It involves several steps and components:
3.1 Strategy Development
The first step is designing the trading strategy. This can be based on:
Technical analysis (chart patterns, indicators).
Statistical models (mean reversion, pairs trading).
Event-driven models (earnings announcements, macro news).
3.2 Coding/Implementation
Once the idea is ready, it is coded into a language like:
Python
R
C++
Broker-specific scripting (like Pine Script for TradingView, AFL for Amibroker).
3.3 Backtesting
Backtesting means testing the strategy on past data to check performance. Important metrics include:
Win rate
Profit factor
Maximum drawdown
Sharpe ratio
3.4 Paper Trading
Before deploying real money, the algo is tested in live conditions without risk—this is called paper trading.
3.5 Execution Engine
The execution engine connects the algo with the broker’s API to place trades automatically. Speed and reliability are crucial here.
3.6 Risk Management
Stop-loss, position sizing, diversification, and hedging are coded into the system to control risk.
4. Types of Algo Strategies
Algo automation can power a variety of strategies:
4.1 Trend Following
Based on moving averages, breakout systems, etc.
Example: Buy when price breaks above 52-week high.
4.2 Mean Reversion
Assumes prices revert to average after deviations.
Example: Bollinger Bands reversal trades.
4.3 Arbitrage
Exploiting price differences in two markets.
Example: Spot-futures arbitrage in Nifty.
4.4 High-Frequency Trading (HFT)
Ultra-fast systems executing thousands of trades per second.
Mostly for institutions.
4.5 Market Making
Providing liquidity by quoting buy and sell prices simultaneously.
Earns the bid-ask spread.
4.6 Event-Driven
Based on news, earnings, dividend announcements.
Example: Buy ITC after strong quarterly results.
4.7 Options Algo Strategies
Automated straddle, strangle, iron condor, or hedging strategies.
Example: Deploying short straddle at specific IV levels automatically.
5. Benefits of Algo Automation
5.1 No Emotions
Humans get greedy, fearful, or impatient. Algos trade with discipline.
5.2 Speed
Execution happens in milliseconds—much faster than manual clicking.
5.3 Accuracy
No human error in entering wrong lot size or price.
5.4 Backtesting
Strategies can be tested before risking money.
5.5 Diversification
One trader can run multiple strategies across markets simultaneously.
5.6 24/7 Monitoring
Especially useful in crypto markets which never sleep.
6. Risks & Challenges of Algo Automation
While algo automation sounds attractive, it comes with risks:
6.1 Overfitting
A strategy that performs very well on past data may fail in real trading.
6.2 Technical Failures
Internet failure, broker downtime, or server crash can disrupt execution.
6.3 Slippage & Latency
In fast-moving markets, orders may not get executed at expected prices.
6.4 Regulatory Risks
In India, SEBI has strict rules for algo trading—unregistered algos may be banned.
6.5 Market Risk
No matter how advanced, if the market moves violently, algos can generate large losses quickly.
7. Algo Automation in India
Algo automation has grown rapidly in India after 2010. Initially, only institutions used it. Now retail traders have access to:
Broker APIs – Zerodha Kite Connect, Angel One SmartAPI, Upstox API.
No-Code Platforms – Streak, AlgoTest, Tradetron.
Coding-Based Platforms – Amibroker, Python libraries, NinjaTrader.
SEBI regulations require brokers to approve algos, but semi-automated retail platforms allow conditional trading without direct coding knowledge.
8. Practical Example of Algo Automation
Imagine you are a Bank Nifty options trader. You design a strategy:
Every Thursday at 9:30 AM, sell a Bank Nifty at-the-money (ATM) straddle.
Place stop-loss at 25% of premium.
Square off at 3:15 PM if stop-loss is not hit.
Now, you don’t need to sit in front of the screen. The algo will:
Identify ATM strikes.
Place sell orders.
Apply stop-loss automatically.
Exit positions at a fixed time.
This is exactly how many professional option sellers operate today.
9. Future of Algo Automation
The next decade will see AI + Algo Trading take center stage. Future trends include:
Machine Learning Models that learn from data and self-improve.
Natural Language Processing (NLP) based algos that read news headlines and trade instantly.
Cloud-Based Algo Platforms for scalability.
Crypto Algo Trading expanding globally.
Fractional and Retail Adoption – everyday investors will use plug-and-play algos just like using mutual funds.
10. Conclusion
Algo automation is revolutionizing trading. It removes emotions, adds speed, improves efficiency, and allows retail traders to compete with institutions on a smaller scale. However, it also carries risks—overfitting, technical failures, and regulatory challenges.
The smart way forward is to:
Learn basics of coding (Python or TradingView Pine Script).
Start small with paper trading.
Focus on risk management, not just profits.
Use algo automation as a tool, not a shortcut to get-rich-quick.
The future belongs to traders who combine market knowledge + technology + discipline. Algo automation is not just the future—it’s already here.

Sustainability & ESG Investing TrendsIntroduction
Over the past two decades, the financial world has experienced a massive transformation in how investments are analyzed, structured, and valued. Traditional investment strategies focused almost exclusively on financial metrics such as revenue growth, earnings per share, P/E ratios, and cash flows. But today, a new dimension has been added: Sustainability and ESG (Environmental, Social, and Governance) investing.
Investors, institutions, governments, and even retail traders are no longer looking at financial returns in isolation. They are increasingly asking:
Is this company environmentally responsible?
How does it treat its employees and communities?
Are its governance practices transparent and ethical?
This movement is more than just a trend—it represents a structural shift in how capital is allocated globally. Sustainability and ESG investing is about aligning profits with purpose. It’s about creating wealth while ensuring that companies contribute positively to society and the planet.
In this article, we’ll explore the evolution, importance, drivers, challenges, and future of sustainability & ESG investing trends, breaking it down in an easy-to-understand and comprehensive way.
1. Understanding Sustainability & ESG
What is Sustainability Investing?
Sustainability investing refers to investment strategies that prioritize companies or assets contributing to long-term environmental and social well-being. Instead of short-term financial gains, the focus is on sustainable value creation.
What is ESG Investing?
ESG stands for:
Environmental – How a company manages its environmental impact (climate change, carbon footprint, renewable energy use, waste management).
Social – How a company treats people (employees, customers, communities, human rights).
Governance – How a company is managed (board structure, executive pay, transparency, shareholder rights).
An ESG-focused investor doesn’t just look at profit margins—they also ask: Is this company ethical? Is it sustainable in the long run?
Why ESG Matters
Climate change is now a financial risk.
Consumers prefer sustainable brands.
Regulators demand transparency.
Younger investors want purpose-driven investments.
2. Evolution of ESG & Sustainability Investing
Early Stage (1960s–1980s)
The origins can be traced back to socially responsible investing (SRI), where investors avoided “sin stocks” (alcohol, tobacco, gambling, weapons).
Religious and ethical considerations played a big role.
Growth Stage (1990s–2000s)
The 1990s saw globalization and rising awareness about corporate social responsibility.
Companies began publishing sustainability reports.
The UN launched initiatives like the Principles for Responsible Investment (PRI) in 2006.
Modern Stage (2010s–2020s)
Climate change, global warming, and social justice movements accelerated ESG awareness.
The Paris Climate Agreement (2015) reinforced global commitments to sustainability.
ESG assets under management (AUM) skyrocketed to $40+ trillion globally by 2025.
3. Key Drivers of ESG & Sustainability Investing
Climate Risks – Extreme weather, rising sea levels, and resource scarcity directly affect business operations and valuations.
Consumer Preferences – Millennials and Gen Z prefer eco-friendly and socially conscious brands.
Regulations & Policies – Governments mandate disclosures (EU’s SFDR, India’s BRSR, SEC proposals in the US).
Capital Flows – Global funds and pension plans increasingly allocate capital based on ESG scores.
Corporate Reputation – Companies with poor ESG practices face backlash, loss of trust, and higher costs.
4. Global ESG Investment Trends
Trend 1: Surge in ESG Assets
As of 2025, global ESG assets are projected to cross $50 trillion, representing nearly a third of total AUM worldwide.
Europe leads the charge, followed by North America and Asia.
Trend 2: Renewable Energy Boom
Solar, wind, and green hydrogen projects attract heavy investments.
Fossil fuel divestment is accelerating.
Trend 3: ESG ETFs & Index Funds
ESG-focused exchange-traded funds (ETFs) have exploded in popularity.
Major indices like the MSCI ESG Leaders Index guide institutional investors.
Trend 4: Technology & ESG Data
AI, blockchain, and big data help assess ESG scores more transparently.
ESG rating agencies (MSCI, Sustainalytics, Refinitiv) play a growing role.
Trend 5: Green Bonds & Sustainable Financing
Green bonds (funds raised for eco-projects) have surpassed $2 trillion issuance globally.
Social bonds and sustainability-linked loans are also gaining traction.
5. ESG in India: The Emerging Market Story
India, as one of the fastest-growing economies, is experiencing its own ESG wave.
Regulation: SEBI (Securities and Exchange Board of India) has mandated the Business Responsibility and Sustainability Report (BRSR) for top listed companies.
Investor Demand: Indian mutual funds are launching ESG-focused schemes.
Corporate Adoption: Firms like Infosys, Tata, and Wipro are global ESG leaders.
Green Finance: India issued its first sovereign green bonds in 2023.
Challenges in India:
Lack of standardized ESG reporting.
Limited awareness among retail investors.
Trade-off between growth and sustainability in a developing economy.
6. Sectoral ESG Trends
1. Energy
Fossil fuels are being replaced with renewables.
Oil & gas companies are investing in carbon capture.
2. Technology
Big tech faces scrutiny on data privacy and energy usage in data centers.
Tech firms lead in transparency reporting.
3. Banking & Finance
Banks integrate ESG into lending decisions.
Green finance and ESG loans are rising.
4. Healthcare & Pharma
Focus on ethical drug pricing, access to healthcare, and sustainable production.
5. Manufacturing
Supply chain sustainability is a big issue.
ESG compliance is crucial for exports.
7. Benefits of ESG Investing
Risk Management – ESG factors identify hidden risks (climate lawsuits, governance failures).
Long-Term Returns – ESG-compliant firms often outperform peers over the long run.
Investor Confidence – Transparency builds trust with stakeholders.
Competitive Advantage – Sustainable firms attract better talent and customers.
Global Alignment – Aligns with SDGs (UN Sustainable Development Goals).
8. Challenges in ESG Investing
Greenwashing – Companies exaggerate or falsely claim ESG compliance.
Data Inconsistency – ESG ratings differ widely across agencies.
Short-Term Costs – ESG transition requires heavy investments.
Lack of Awareness – Many retail investors still prioritize quick profits.
Policy Differences – No uniform global ESG standard.
9. Future of ESG & Sustainability Investing
Prediction 1: Stricter Regulations
Governments worldwide will enforce mandatory ESG disclosures.
Prediction 2: ESG in Emerging Markets
India, China, Brazil, and Africa will see exponential ESG adoption.
Prediction 3: Integration with Technology
AI-driven ESG scoring, blockchain-based supply chain tracking, and carbon credit markets will become mainstream.
Prediction 4: Mainstream Adoption
In the near future, ESG will not be a separate category—it will be the default way of investing.
Prediction 5: Retail ESG Investing
Just like mutual funds became mainstream, ESG-focused products will attract retail participation in India and abroad.
10. Practical Guide: How to Invest in ESG
Mutual Funds & ETFs – Invest in ESG-themed funds.
Direct Stocks – Pick companies with strong ESG ratings.
Green Bonds – Support eco-projects while earning fixed returns.
Thematic Portfolios – Build portfolios around sustainability themes (renewables, EVs, water management).
Due Diligence – Verify ESG claims; avoid greenwashing traps.
Conclusion
Sustainability & ESG investing is not a passing fad—it’s a megatrend shaping the future of finance. The world is moving towards a system where profit and purpose must co-exist.
For investors, this means:
ESG is becoming a risk management tool.
ESG compliance improves long-term performance.
Early adopters stand to benefit from the global shift in capital flows.
India, being at the cusp of massive economic growth, is perfectly positioned to ride the ESG wave. The government’s push for clean energy, digital governance, and responsible corporate practices will only accelerate this trend.
In short, the future of investing is sustainable investing. Capital is no longer blind; it is conscious, responsible, and forward-looking.

Long-Term Position TradingIntroduction
In the world of financial markets, traders and investors often debate between short-term opportunities and long-term wealth-building strategies. One of the most reliable and time-tested methods for wealth creation is long-term position trading. Unlike day trading or swing trading that rely on short-term price movements, long-term position trading is about identifying strong trends, quality assets, and holding positions for months or even years.
This strategy is closer to investing but still falls within the discipline of trading because it involves market timing, entry/exit strategies, risk management, and portfolio adjustments. Long-term position traders often aim to ride big moves, benefit from compounding, and avoid the stress of daily market noise.
In this guide, we’ll break down long-term position trading in detail—covering its philosophy, strategies, tools, pros & cons, and practical approaches to mastering it in the Indian and global markets.
Chapter 1: What is Long-Term Position Trading?
Long-term position trading is a trading approach where positions are held for extended periods—usually six months to several years—to benefit from large market trends.
Key features:
Time Horizon: Longer than swing trading (days/weeks), shorter than buy-and-hold investing (decades).
Objective: Capture major price trends (secular uptrends, super cycles, sectoral booms).
Approach: Fundamental and technical analysis combined to filter strong assets.
Risk Appetite: Medium to high, since market volatility must be tolerated.
In simple terms: A position trader says, “Instead of fighting intraday noise, I’ll enter into a fundamentally strong stock or asset during accumulation phases, and hold it through the bigger move until the trend matures.”
Chapter 2: Why Long-Term Position Trading Works
Trend Follower Advantage
Markets move in cycles: accumulation → uptrend → distribution → downtrend.
Long-term position traders focus on catching the uptrend phase that can deliver 100%–500% returns.
Less Noise, More Clarity
Daily fluctuations, news-driven volatility, and short squeezes matter less.
Weekly/monthly charts filter out the noise and highlight the real trend.
Compounding Effect
Holding quality stocks allows dividends + capital appreciation to compound over time.
Psychological Relief
No constant monitoring like intraday traders.
Stress-free decision-making with focus on big picture.
Alignment with India’s Growth Story
For Indian traders, position trading aligns with the India Growth Supercycle—rising middle class, infrastructure push, financialization, and technology adoption.
Chapter 3: Difference Between Position Trading and Other Strategies
Feature Intraday Trading Swing Trading Long-Term Position Trading Investing
Time Horizon Minutes/Hours Days/Weeks Months/Years 5–20+ Years
Focus Volatility Short Swings Major Trends Business Growth
Analysis Used Technical Technical Both (Fundamental + Technical) Fundamental
Stress Level Very High Moderate Low-Moderate Very Low
Return Style Small but frequent Medium Large but fewer Large, steady
Capital Requirement High Margin Medium Medium-High Any
Chapter 4: Foundations of Long-Term Position Trading
1. Fundamental Analysis
Position traders give importance to fundamentals because weak companies rarely sustain long-term rallies. Some factors:
Revenue Growth (10–20% CAGR stocks outperform).
Profit Margins (expanding margins are bullish).
Debt Levels (low-debt, high cash-flow firms are stable).
Moats (brand, patents, market leadership).
Macro Tailwinds (sectors aligned with government policies, global demand).
Example: In India, IT services (Infosys, TCS), FMCG (HUL), banking (HDFC Bank), and pharma (Sun Pharma) have rewarded long-term position traders massively.
2. Technical Analysis
Even long-term players need technicals to time entries. Tools include:
Moving Averages (50, 200 DMA crossovers for long-term trend).
Volume Profile (identifies accumulation/distribution zones).
Support & Resistance (monthly/weekly zones matter most).
Breakouts (multi-year consolidation breakouts often lead to huge rallies).
3. Macro & Sectoral Analysis
Long-term traders follow sectoral rotation. Capital flows from one sector to another, and identifying the next booming sector is critical. Example:
2003–2008: Infra & Real Estate Boom.
2010–2014: Pharma Rally.
2014–2019: NBFC & Banking Growth.
2020–2023: IT, Specialty Chemicals, PSU Banks.
Chapter 5: Tools & Indicators for Position Traders
Weekly & Monthly Charts – To identify primary trends.
Fibonacci Retracements – Entry zones after corrections in long-term uptrend.
Relative Strength Index (RSI) – To avoid overbought long entries.
MACD on Weekly – Trend confirmation.
Volume Profile – Shows institutional accumulation zones.
Fundamental Screeners – Tools like Screener.in, Tickertape, Trendlyne for Indian stocks.
Chapter 6: Step-by-Step Process of Long-Term Position Trading
Step 1: Market Outlook
Study global and Indian macro trends.
Identify strong themes: EV, renewable energy, banking digitization, infrastructure, AI.
Step 2: Stock Selection
Filter fundamentally strong companies.
Look for leaders in high-growth sectors.
Step 3: Technical Entry
Wait for breakout above multi-year resistance.
Confirm with volume surge.
Step 4: Position Sizing
Invest gradually (SIP mode into position trades).
Allocate 10–20% per stock in portfolio.
Step 5: Holding Discipline
Avoid reacting to minor news.
Focus on quarterly results and sectoral momentum.
Step 6: Exit Strategy
Sell when trend weakens (break below 200 DMA, falling growth).
Book profits in stages during euphoric rallies.
Chapter 7: Psychology of Long-Term Position Trading
Patience is Everything: Multi-year rallies test your patience.
Control Over News-Driven Fear: Ignore daily market noise.
Conviction in Research: Confidence comes from solid analysis.
Avoid Overtrading: Stick to your selected few winners.
Chapter 8: Risk Management
Even long-term traders need strict risk management:
Stop-Loss (Mental/Trailing): Place it below major support.
Diversification: Don’t put all in one sector.
Portfolio Review: Quarterly recheck.
Avoid Leverage: Margin positions don’t suit long-term holding.
Exit During Structural Shifts: If sector fundamentals collapse (e.g., telecom price wars killed many stocks).
Chapter 9: Real Examples of Position Trading
Indian Market
Infosys (1995–2020): ₹100 → ₹15,000+ (split-adjusted).
HDFC Bank: A long-term compounding machine with consistent growth.
PSU Banks: From 2020 lows to 2023, gave 300–400% returns as a sectoral play.
Global Market
Apple: From $1 in early 2000s to $200+.
Tesla: From $17 IPO to $1200 peak before split.
Amazon: One of the greatest position trades in history.
Chapter 10: Pros & Cons of Long-Term Position Trading
Pros
Stress-free compared to intraday.
Big reward potential.
Aligned with economic cycles.
Better for working professionals.
Cons
Requires patience.
Drawdowns can be painful (20–40%).
Needs deep research (time-consuming).
Black Swan events (COVID, global crisis) can hit hard.
Conclusion
Long-term position trading is not just about buying and holding. It’s about selecting the right stocks, entering at the right time, and having the patience to sit through volatility until the big trend matures. It’s a strategy that bridges the gap between short-term trading and investing, offering both the thrill of trading and the wealth-building potential of investing.
For Indian markets, with the growth supercycle unfolding, long-term position trading can be one of the most rewarding approaches for the next decade. The key lies in discipline, patience, and the courage to ride trends while ignoring short-term noise.