Consumption Trends Unveiled1. Digital-First Consumer Behavior
One of the most significant modern trends is the shift toward digital-first consumption. With widespread internet accessibility and smartphone use, consumers increasingly prefer online channels for shopping, content consumption, financial transactions, and communication.
E-commerce has become a dominant retail model. Consumers now expect convenience, instant access to products, and seamless delivery systems. Online marketplaces are expanding rapidly due to personalized recommendations, competitive pricing, and wider product varieties. Additionally, social commerce—shopping directly through social media platforms—is gaining momentum, especially among younger generations who trust peer reviews and influencer endorsements.
Beyond retail, digital consumption includes streaming platforms for entertainment, digital banking, telemedicine, and online education. Every sector is witnessing a digital transformation as consumers adopt technology for efficiency, comfort, and lower costs.
2. Personalization and Customization
Modern consumers crave personalization. They want experiences, products, and services tailored specifically to their preferences. This trend is driven by AI-powered recommendation engines, data-driven marketing, and a deeper understanding of customer behavior.
Companies are using analytics to segment consumers based on browsing patterns, purchase history, lifestyle choices, and social media behavior. Personalized subscription boxes, curated shopping experiences, customized nutrition plans, and smart home devices that learn user habits are prime examples.
Moreover, consumers are increasingly involved in the creation process. Brands that offer customizable options—such as personalized shoes, tailored skincare, or adjustable meal plans—gain a competitive edge. Personalization not only enhances customer satisfaction but also builds strong brand loyalty.
3. Sustainability and Conscious Consumption
Environmental awareness is reshaping global consumption patterns. Today’s consumers, particularly Millennials and Gen Z, are more conscious of climate change, resource scarcity, and environmental impact. This has led to the rise of eco-friendly products, sustainable packaging, and ethical manufacturing.
Consumers prefer brands that adopt green practices, source responsibly, and maintain transparency in their supply chains. The shift toward plant-based foods, renewable energy products, slow fashion, and biodegradable items reflects this growing eco-conscious mindset.
Secondhand marketplaces, recycling initiatives, and circular economy models (where products are reused, refurbished, or recycled) are also becoming mainstream. As sustainability influences purchasing decisions, companies must adapt to remain relevant and trustworthy.
4. Health, Wellness, and Holistic Living
Health and wellness have evolved from niche trends to global consumption drivers. Consumers increasingly prioritize physical fitness, mental well-being, and preventive healthcare. This shift accelerated due to the pandemic, which heightened awareness of health risks.
Demand for nutrition-rich foods, organic products, immunity-boosting supplements, and wellness services has surged. Fitness apps, wearable devices, and virtual workout platforms have gained popularity due to convenience and personalization.
Mental health has also emerged as a key focus, with consumers seeking mindfulness apps, relaxation products, therapy services, and work-life balance solutions. The wellness economy has expanded to include sleep technology, ergonomic home products, and wellness tourism.
5. Experience-Driven Consumption
Another major trend is the shift from product ownership to experience-driven consumption. Consumers now value memorable experiences—travel, entertainment, dining, adventure, and cultural activities—over material possessions.
The “experience economy” is thriving:
Travel and tourism industries focus on curated, immersive experiences.
Restaurants emphasize unique concepts and ambiance.
Events, festivals, and pop-up activities attract large audiences.
Virtual reality and augmented reality are creating new entertainment formats.
Younger consumers especially prioritize experiences that reflect self-expression and social identity. Sharing experiences online amplifies this trend, as people seek activities that are “social media worthy.”
6. Rise of Subscription-Based Models
Subscription services have grown exponentially across various industries. Consumers prefer ongoing access over one-time purchases because subscriptions offer convenience, value, and regular upgrades.
Popular examples include:
Streaming platforms like Netflix and Spotify
Subscription boxes for beauty, fashion, and fitness
Cloud storage and software services
Meal kits and grocery subscriptions
Auto-subscription for household essentials
Businesses benefit from predictable revenue streams, while consumers enjoy flexibility, personalization, and frequent content or product updates.
7. Other Emerging Trends
The Sharing Economy
Consumers increasingly participate in shared consumption models, such as ride-sharing, coworking spaces, community rentals, and shared mobility solutions. This trend reduces ownership costs and supports sustainability.
Localism and Hyper-Localization
Many consumers prefer locally produced goods due to their freshness, authenticity, and community support. Pandemic-driven supply chain disruptions accelerated this trend.
Financial Consciousness
Economic uncertainty has made consumers more value-driven. They seek discounts, compare prices across platforms, and prioritize financial planning tools. Buy Now Pay Later (BNPL) services, digital wallets, and micro-investing platforms are growing.
8. Drivers Behind Changing Consumption Patterns
Several key forces are influencing modern consumption trends:
Technological Advancements
AI, machine learning, IoT, and big data have transformed how businesses understand and target consumers.
Demographic Shifts
A younger, tech-savvy generation is reshaping consumption priorities, while aging populations create demand for healthcare services and age-friendly products.
Globalization
Consumers have access to global brands, ideas, and experiences, leading to diverse preferences.
Socioeconomic Changes
Rising incomes in developing nations and middle-class expansion influence spending power and lifestyle aspirations.
Cultural Evolution
Social media, global trends, and peer influence redefine consumption norms and expectations.
9. Implications for Businesses and Markets
Understanding consumption trends is critical for companies to stay competitive. Businesses must:
Adopt digital-first strategies
Enhance personalization efforts
Focus on sustainability
Innovate new customer experiences
Strengthen e-commerce capabilities
Build trust through transparency
Offer flexible subscription or hybrid models
Companies that fail to recognize these changes risk losing relevance in an economy driven by dynamic consumer expectations.
Conclusion
Consumption trends today are shaped by a combination of technology, demographics, values, and global economic shifts. As consumers evolve, businesses must rethink their strategies, products, and services to meet emerging demands. The future will belong to organizations that understand their customers deeply, innovate continuously, and prioritize sustainability, personalization, and digital transformation.
Axisbanklong
Understanding the Inverse Head & Shoulder Breakout in Axis BankEducational Article: Understanding the Inverse Head & Shoulder Breakout in Axis Bank.
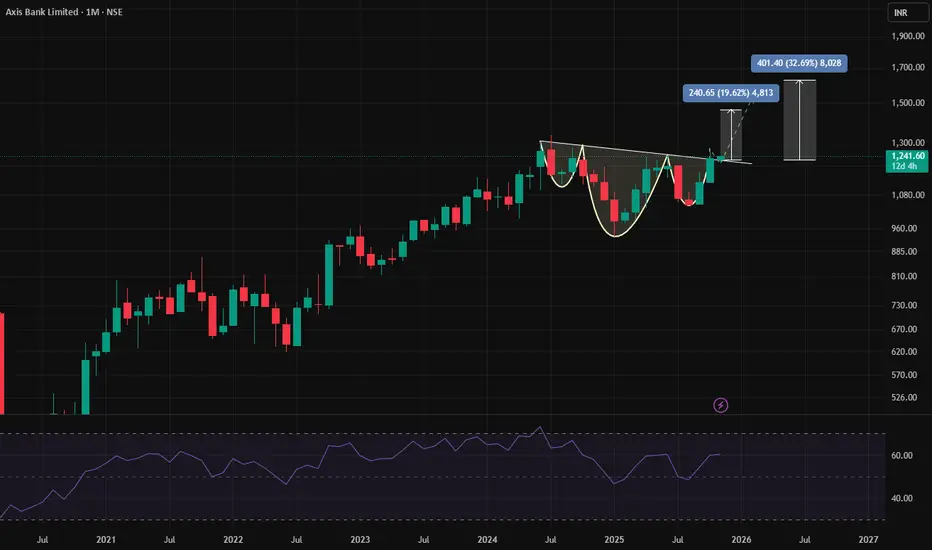
Axis Bank, currently trading around ₹1241 on the monthly charts, is showing a classic inverse head & shoulder breakout at the top of a consolidation zone. This setup, combined with the Relative Strength Index (RSI) trending above 50 and preparing to cross 60, provides a strong technical case for potential upside momentum.
🔍What is an Inverse Head & Shoulder Pattern?
Structure:
Left Shoulder: Initial decline followed by a rebound.
Head: A deeper decline forming the lowest point.
Right Shoulder: A smaller decline, mirroring the left shoulder.
Neckline: The resistance line connecting the peaks of the shoulders.
Breakout Signal: When price breaks above the neckline, it indicates a reversal from bearish to bullish sentiment.
In Axis Bank’s Case:
The pattern has formed after a consolidation phase.
Price is now breaking out of the neckline, suggesting strength and potential continuation upward.
📊 Role of RSI in Confirming Breakouts
The Relative Strength Index (RSI) is a momentum oscillator that measures the speed and change of price movements.
Key Levels:
Above 50 → Indicates bullish momentum.
Crossing 60 → Adds further strength to the uptrend.
Axis Bank’s RSI:
Currently trending above 50.
Preparing to move above 60, which aligns with the breakout, reinforcing the bullish case.
🎯 Learning Points for Traders
Pattern Recognition:
Spotting inverse head & shoulder patterns helps identify potential reversals.
Always confirm with a breakout above the neckline.
Momentum Confirmation:
RSI above 50 signals strength.
A move above 60 during breakout adds conviction to the trade.
Consolidation Context:
Breakouts from consolidation zones often lead to strong directional moves.
Axis Bank’s breakout is happening after a prolonged consolidation, increasing reliability.
Risk Management:
Place stop-loss below the right shoulder or neckline to manage risk.
Avoid chasing the move without confirmation.
📝 Conclusion
The inverse head & shoulder breakout in Axis Bank, supported by RSI strength, presents a textbook example of how price action and momentum indicators work together. For learners, this is a valuable case study in combining chart patterns with RSI confirmation to identify high-probability trading opportunities.
Axis Bank Bullish Long Term ActivationKey Points
Trend Type- Long Term
Rally is already started, but still a long way to go up.So buy on retracements.
If you have the stock than hold it for few months and more.
Like and share is appreciated.
Thank You
To understand how our coding works read the below post-
NSE:AXISBANK

Volume Profile & Market Structure AnalysisPart 1: Understanding Market Structure
1.1 What is Market Structure?
Market structure is the framework of price movement. It’s the natural rhythm of the market, made up of highs, lows, trends, ranges, breakouts, and consolidations. Think of it as the skeleton of price action, which reveals how institutions and retail traders interact.
In simple terms, market structure helps us answer:
Is the market trending up, trending down, or consolidating?
Where are liquidity pools likely located?
Which price levels matter most to big players (banks, hedge funds, market makers)?
1.2 The Building Blocks of Market Structure
Swing Highs and Swing Lows
Swing High: A peak where price fails to continue higher.
Swing Low: A valley where price fails to continue lower.
These levels often act as liquidity pools where stop losses gather.
Trends
Uptrend: Higher highs (HH) and higher lows (HL).
Downtrend: Lower lows (LL) and lower highs (LH).
Sideways/Range: Price oscillates between support and resistance with no clear direction.
Break of Structure (BoS)
When price violates the previous high or low, signaling a shift in trend. Example: if price makes a new higher high after a downtrend, that could signal a bullish shift.
Change of Character (ChoCh)
A sudden break in the short-term market rhythm, often the first clue of a potential trend reversal.
Liquidity
Stop orders, pending orders, and clusters of positions sitting around obvious levels (support, resistance, round numbers).
Market makers often push price toward these liquidity zones to fill large institutional orders.
1.3 Institutional vs. Retail Market Structure
Retail traders often focus on patterns (double tops, triangles, flags).
Institutions care about liquidity and order flow. They engineer moves to trap retail positions and accumulate their own.
This is why understanding structure at an institutional level (smart money concepts) is crucial. It explains phenomena like false breakouts, liquidity sweeps, and stop hunts.
Part 2: Understanding Volume Profile
2.1 What is Volume Profile?
Volume Profile is a charting tool that shows how much trading volume occurred at each price level during a given period. Instead of just telling you “when” trades occurred (time-based volume), it tells you “where” trades occurred in price.
The Volume Profile is plotted as a horizontal histogram along the price axis. This makes it easier to see which price zones attracted the most participation from traders and institutions.
2.2 Key Components of Volume Profile
Point of Control (POC)
The price level with the highest traded volume.
Acts as a magnet for price because it represents “fair value.”
Value Area (VA)
The range where about 70% of trading volume occurred.
Split into:
Value Area High (VAH)
Value Area Low (VAL)
High-Volume Nodes (HVN)
Areas of heavy participation (accumulation zones).
Price often consolidates here.
Low-Volume Nodes (LVN)
Areas where price quickly passed through with little trading.
Often act as support/resistance.
2.3 Why Volume Profile Matters
Shows institutional footprints: Institutions need liquidity to fill big orders, so they often transact heavily around POC and HVNs.
Highlights imbalances: When price rejects LVNs, it suggests aggressive buying/selling dominance.
Helps with trade entries & exits: Knowing where fair value is (POC) vs. imbalance zones helps traders time reversals or continuations.
Part 3: Combining Market Structure & Volume Profile
Market Structure tells you the direction of the market, while Volume Profile shows you where the heavy battles occur. Used together, they create a powerful framework.
3.1 Example: Trend Continuation Setup
Step 1: Identify the trend using Market Structure (higher highs, higher lows).
Step 2: Look at Volume Profile to find the POC or Value Area Low (support).
Step 3: If price retraces to VAL while maintaining bullish structure, it’s often a high-probability continuation zone.
3.2 Example: Reversal Setup
Step 1: Notice a Change of Character (ChoCh) in structure.
Step 2: Check if price swept liquidity near an HVN or POC.
Step 3: If Volume Profile shows rejection of that value area, it signals strong reversal potential.
3.3 Liquidity & Volume Synergy
Liquidity pools (stop-loss clusters) often sit near low-volume nodes because price moves fast through those zones.
Institutions push price into these LVNs to trigger stops and then absorb liquidity.
Once filled, price usually returns to HVNs (fair value).
Part 4: Practical Strategies with Volume Profile & Market Structure
4.1 The Volume Profile Rejection Strategy
Identify LVNs.
Wait for price to test and sharply reject.
Enter with trend confirmation from market structure.
4.2 Breakout + Volume Profile Confirmation
If price breaks a structural level (BoS), check if it’s supported by high volume near POC.
Strong volume = genuine breakout.
Weak volume = likely false breakout.
4.3 Value Area Rotations
Price often oscillates between VAH and VAL.
Strategy: Buy near VAL, sell near VAH, exit at POC.
Works best in ranging conditions.
Part 5: Psychological & Institutional Insights
Retail Traps: Market structure fakeouts occur around LVNs, engineered by institutions.
Smart Money Accumulation: Seen in HVNs—where large players accumulate before big moves.
Auction Theory: Markets function as auctions—Volume Profile is essentially a visualization of that auction process.
Conclusion
Volume Profile and Market Structure Analysis are not “magic bullets,” but together they form one of the most institutionally aligned trading frameworks available to retail traders.
Market Structure explains where price wants to go.
Volume Profile explains where participants are most active.
By combining them, traders can anticipate moves with higher probability, avoid traps, and align themselves closer to the behavior of professional market participants.
Ultimately, the goal is to stop thinking like a retail trader chasing indicators and start thinking like a liquidity hunter—someone who understands where the market is auctioning, who’s trapped, and where the next wave of orders is likely to hit.
Part 4 Learn Institutional Trading Introduction to Options
Financial markets provide several instruments to trade and invest. Among equities, futures, commodities, and currencies, options trading has gained significant popularity worldwide, including India. Options are not just speculative tools; they are also powerful instruments for hedging, income generation, and risk management.
An option is essentially a derivative contract—its value is derived from an underlying asset like a stock, index, commodity, or currency. Unlike direct stock ownership, an option gives the buyer rights but not obligations. This unique feature makes them versatile but also complex for beginners.
To truly master options, one must understand not only the basic definitions but also pricing, market psychology, and strategies.
Basic Terminology
Before diving deeper, let’s go through the essential terms:
Option Contract: Agreement between buyer and seller based on an underlying asset.
Underlying Asset: Stock, index, commodity, or currency.
Strike Price: Pre-decided price at which the option can be exercised.
Expiry Date: The last date on which the option can be exercised.
Premium: Price paid by the buyer to acquire the option.
Lot Size: Minimum quantity for which an option can be traded.
European vs. American Options: European can be exercised only on expiry; American anytime before expiry.
How Options Work in Practice
Option buyers have limited risk (premium paid) but unlimited profit potential (in calls if stock rises, in puts if stock falls).
Option sellers have limited profit (premium received) but potentially unlimited risk.
This asymmetric payoff structure creates a market where traders, hedgers, and institutions interact.

Part 2 Ride The Big MovesBasic Terminology
Before we dive deeper, let’s clear the basic terms in option trading:
Underlying Asset – The stock, index, commodity, or currency on which the option is based. Example: Nifty, Reliance, crude oil.
Option Contract – The agreement between buyer and seller of the option.
Call Option – Gives the holder the right (but not obligation) to buy the underlying asset at a fixed price before expiry.
Put Option – Gives the holder the right (but not obligation) to sell the underlying asset at a fixed price before expiry.
Strike Price – The price at which the option holder can buy (call) or sell (put) the underlying.
Expiry Date – The last date when the option can be exercised. In India, stock options usually expire monthly or weekly (for indices).
Premium – The price you pay to buy an option contract. It’s like a ticket fee for having the right to buy or sell in the future.
Lot Size – Each option contract is traded in fixed quantities called lots. Example: Nifty option lot = 50 units.
How Options Work
Imagine you want to buy a house worth ₹50 lakhs, but you’re unsure whether the price will rise or fall in the next 6 months. Instead of paying ₹50 lakhs now, you strike a deal with the owner:
You pay ₹2 lakhs today as a non-refundable fee (premium).
You get the right to buy the house anytime in the next 6 months at ₹50 lakhs (strike price).
Now:
If the house price rises to ₹60 lakhs, you can still buy it at ₹50 lakhs and make a profit.
If the house price falls to ₹45 lakhs, you can walk away. You lose only the ₹2 lakhs premium.
This is exactly how a call option works.
A put option is the reverse: you get the right to sell something at a fixed price, useful if you think prices will fall.
So options are all about rights, not obligations. The buyer has rights, the seller has obligations.

Options vs Buying & Selling in TradingPart 1: Basics of Buying & Selling in Trading
1.1 How It Works
Buying (going long): The trader purchases an asset, expecting its price to rise. Profit comes from selling it later at a higher price.
Selling (going short): The trader sells an asset they don’t own (borrowing it from a broker), expecting its price to fall. Profit comes from buying it back later at a lower price.
Example:
If you buy 100 shares of Tata Steel at ₹120 and sell at ₹150, your profit = ₹30 × 100 = ₹3,000.
If you short 100 shares of Infosys at ₹1,500 and later buy them back at ₹1,400, your profit = ₹100 × 100 = ₹10,000.
1.2 Characteristics of Traditional Trading
Ownership: When you buy, you actually own the asset.
Unlimited upside, unlimited downside (in shorting): Long trades can theoretically go up infinitely, but short trades carry unlimited loss potential.
Capital intensive: You must pay the full value of the asset (unless using margin).
Time horizon: No expiry date; you can hold as long as you want.
1.3 Advantages
Simple and easy to understand.
Ownership benefits like dividends, voting rights in stocks.
No expiry pressure.
1.4 Risks
Large capital required.
Losses can be significant if the market goes against you.
Limited flexibility in terms of strategy.
Part 2: Basics of Options Trading
2.1 What Are Options?
Options are derivative contracts that derive value from an underlying asset (like stocks, indices, commodities, or currencies).
Call Option: Right to buy the asset at a fixed price (strike price).
Put Option: Right to sell the asset at a fixed price.
Options are rights, not obligations. The buyer of an option can choose whether to exercise it, while the seller (writer) is obligated to honor it.
2.2 Example of Options
Suppose Nifty is at 20,000.
You buy a Nifty 20,000 Call Option for a premium of ₹200.
If Nifty rises to 20,500 at expiry, the option’s value = 500. Profit = (500 – 200) = ₹300 per unit.
If Nifty falls to 19,500, you lose only the premium = ₹200.
2.3 Key Features
Leverage: Small premium controls a large value of the asset.
Limited risk for buyers: Maximum loss = premium paid.
Variety of strategies: Options allow profit from up, down, or sideways markets.
Time-bound: Every option has an expiry date.
2.4 Advantages
Cost-efficient way to take positions.
Hedging tool for managing risk.
Flexibility in designing strategies.
Defined risk when buying options.
2.5 Risks
For buyers: Premium decay (time value erosion).
For sellers: Potential unlimited losses.
Complexity compared to direct buying and selling.
Part 3: Options vs Buying/Selling – A Direct Comparison
Feature Traditional Buying/Selling Options Trading
Ownership Yes (when buying) No, it’s a contract
Capital Requirement High Low (premium only)
Leverage Limited (margin needed) Built-in leverage
Risk Unlimited (in shorting) Limited for buyers, unlimited for sellers
Profit Potential Unlimited upside (long) Defined, depending on strategy
Expiry None Always has expiry
Complexity Simple Complex
Uses Investing, long-term holding Hedging, speculation, income strategies
Part 4: Practical Use Cases
4.1 When to Use Traditional Buying & Selling
Long-term investing in stocks.
When you want ownership (e.g., dividends).
When you want simple exposure to price movements.
4.2 When to Use Options
Hedging: An investor holding a stock portfolio buys put options to protect against a fall.
Speculation: A trader buys calls when expecting a sharp rally.
Income generation: Selling options (like covered calls) to earn premiums.
Event trading: Using straddles/strangles during earnings announcements.
Part 5: Risk Management
5.1 In Buying/Selling
Use stop-loss orders.
Diversify portfolio.
Avoid over-leverage.
5.2 In Options
Stick to defined-risk strategies (like spreads).
Understand implied volatility.
Avoid naked option selling without capital cushion.
Part 6: Psychological Differences
Buying & Selling: Feels straightforward, intuitive. Less cognitive load.
Options: Requires strong understanding of Greeks (Delta, Gamma, Theta, Vega). Traders must accept probability-based outcomes.
Part 7: Real-Life Example Comparison
Imagine you expect Reliance to rise from ₹2,500 to ₹2,700.
Method 1 – Buying Shares:
Buy 100 shares @ ₹2,500 = ₹2,50,000 invested.
If price hits ₹2,700 → Profit = ₹20,000.
Risk: If it falls to ₹2,300 → Loss = ₹20,000.
Method 2 – Buying Call Option:
Buy Reliance 2,500 Call @ ₹50 premium = ₹5,000 invested.
If Reliance rises to ₹2,700, intrinsic value = ₹200. Profit = (200 – 50) × 100 = ₹15,000.
If Reliance falls to ₹2,300, loss = only premium ₹5,000.
Here, options gave higher percentage return with limited risk.
Part 8: Long-Term Perspective
Investors prefer buying & holding stocks, as they represent ownership in a growing business.
Traders often use options for short-term moves, hedging, and leverage.
Smart portfolios often combine both: owning core assets while using options for risk management.
Conclusion
Traditional buying and selling is like owning the road—it’s direct, long-term, and stable. Options are like renting a sports car for a specific race—cheaper, faster, but requiring skill and timing.
Neither is inherently better. It depends on:
Risk appetite
Capital available
Market view
Time horizon
Experience level
For beginners, direct buying and selling is a solid foundation. For advanced traders, options open new horizons of creativity and control.
Yatharth Hospital & Trauma Care Services Ltd. 4 Hour View4-Hour Time-Frame View – Technical Snapshot
While many platforms don’t provide a dedicated 4-hour technical summary, we can still glean insights from related intraday data—particularly from platforms like Investing.com (5-hour view) and TopStockResearch’s 4-hour-specific metrics.
Investing.com (5-Hour, closest available proxy)
Technical Summary (5-Hour): Strong Buy
Overall Summary (5 Hrs → Strong Buy) indicates strong upward momentum even over shorter intraday frames
TopStockResearch (4-Hour TSR Strength Index)
This platform provides a more granular “4-Hour” breakdown:
TSR Strength Index: Strong Bullish — YATHARTH is more bullish than 97–98% of stocks
Indicators:
RSI: ~69–70 → Buy
MACD: ~20 → Buy
ADX: ~36 → Buy
Stochastic: ~42 → (Neutral or Buy range)
ROC: ~4–5 → Buy
Supertrend: ~647 → indicating upward trend
Williams %R: Slightly negative (near overbought region)
CMF (Chaikin Money Flow): Positive (~0.13) → Buying pressure
PSAR: ~674
These inputs together reinforce a strong bullish bias over the 4-hour window
Pivot Levels (Intraday / 4-Hour Range)
TopStockResearch provides intraday pivot level analysis:
Current Price (~₹749) is trading above all primary resistance levels—including R3 (Classic), Camarilla R4, Fibonacci R3, Woodie’s R2, and DeMark R1, signaling a robust intraday breakout

Financial Markets1. Introduction
Financial markets are the backbone of modern economies, serving as platforms where individuals, companies, and governments can raise capital, trade financial instruments, and manage risks. They facilitate the flow of funds from surplus units (those with excess capital) to deficit units (those in need of funds), enabling economic growth and development.
At their core, financial markets serve three primary functions:
Price Discovery – determining the price of financial assets through supply and demand.
Liquidity Provision – enabling participants to buy and sell assets easily.
Risk Management – allowing participants to hedge against uncertainties like interest rate changes, inflation, or currency fluctuations.
2. Types of Financial Markets
Financial markets are broadly classified into several categories based on the nature of the assets traded and the maturity of the instruments.
2.1 Capital Markets
Capital markets are where long-term securities, such as stocks and bonds, are bought and sold. They are crucial for channeling savings into productive investments. Capital markets are further divided into:
2.1.1 Stock Markets
The stock market is where equity shares of companies are issued and traded. Equity represents ownership in a company, and investors earn returns through dividends and capital appreciation. Stock markets can be divided into:
Primary Market: Where companies issue new shares through Initial Public Offerings (IPOs) or Follow-on Public Offers (FPOs). It allows companies to raise long-term capital directly from investors.
Secondary Market: Where existing shares are traded among investors. This includes major exchanges like the New York Stock Exchange (NYSE), NASDAQ, and Bombay Stock Exchange (BSE).
Key functions of stock markets:
Facilitating capital formation.
Providing liquidity for investors.
Helping in price discovery and valuation of companies.
2.1.2 Bond Markets
Bond markets, or debt markets, involve the issuance and trading of debt securities such as government bonds, corporate bonds, and municipal bonds. Bonds allow governments and corporations to borrow funds from the public with a promise to repay principal and interest. Types of bonds include:
Government Bonds – low-risk, used to fund national projects.
Corporate Bonds – medium to high-risk, issued by companies for expansion.
Municipal Bonds – issued by local governments to fund infrastructure projects.
2.2 Money Markets
Money markets deal with short-term borrowing and lending, typically with maturities of less than one year. They are essential for managing liquidity and short-term funding needs. Common instruments in money markets include:
Treasury Bills (T-Bills) – short-term government securities.
Commercial Paper (CP) – unsecured, short-term debt issued by corporations.
Certificates of Deposit (CDs) – issued by banks for fixed short-term deposits.
Repurchase Agreements (Repos) – short-term borrowing secured against securities.
Money markets are highly liquid and considered low-risk. They play a crucial role in interest rate determination and monetary policy implementation.
2.3 Derivatives Markets
Derivatives are financial instruments whose value depends on an underlying asset, such as stocks, bonds, currencies, commodities, or indices. They are primarily used for hedging risk, speculation, and arbitrage. Common derivatives include:
Futures Contracts – agreements to buy or sell an asset at a predetermined price on a future date.
Options Contracts – giving the right, but not the obligation, to buy or sell an asset.
Swaps – contracts to exchange cash flows, such as interest rate or currency swaps.
Forwards – customized contracts to buy or sell an asset at a future date.
Derivatives markets help stabilize prices, manage risk, and improve market efficiency.
2.4 Foreign Exchange (Forex) Markets
The forex market is the global marketplace for trading currencies. It determines exchange rates and facilitates international trade and investment. Key participants include central banks, commercial banks, hedge funds, multinational corporations, and retail traders. The forex market is the largest financial market in the world, with daily trading exceeding $6 trillion.
Functions:
Facilitates international trade and investment.
Helps hedge against currency risks.
Influences inflation and interest rates globally.
2.5 Commodity Markets
Commodity markets trade physical goods like gold, silver, oil, agricultural products, and industrial metals. They can be classified into:
Spot Markets – trading commodities for immediate delivery.
Futures Markets – trading contracts for future delivery, helping producers and consumers hedge against price fluctuations.
Commodity markets are essential for price discovery, risk management, and economic planning.
3. Functions of Financial Markets
Financial markets perform several key functions that sustain economic growth:
Mobilization of Savings – They convert individual savings into productive investments.
Resource Allocation – Financial markets ensure efficient allocation of funds to projects with the highest potential returns.
Price Discovery – Markets determine prices based on supply and demand.
Liquidity Provision – Investors can convert securities into cash quickly.
Risk Management – Derivatives and insurance instruments help mitigate financial risks.
Reduction in Transaction Costs – Centralized markets reduce costs of buying and selling securities.
Economic Indicator – Financial market trends often signal economic conditions, growth, or recessions.
4. Participants in Financial Markets
Various participants operate in financial markets, each with distinct roles and objectives.
4.1 Individual Investors
Individuals invest in stocks, bonds, mutual funds, and ETFs for wealth creation, retirement planning, and income generation.
4.2 Institutional Investors
Large organizations, such as mutual funds, pension funds, insurance companies, and hedge funds, participate with significant capital, influencing market movements.
4.3 Corporations
Corporations raise capital by issuing equity or debt and may also hedge risks using derivatives.
4.4 Governments
Governments issue bonds to finance deficits, regulate financial markets, and implement monetary policies.
4.5 Intermediaries
Banks, brokers, and investment advisors facilitate transactions, provide liquidity, and offer investment guidance.
5. Instruments Traded in Financial Markets
Financial markets involve a wide variety of instruments:
Equities (Stocks) – ownership in companies.
Debt Instruments (Bonds, Debentures, CPs) – borrowing contracts.
Derivatives (Futures, Options, Swaps) – risk management instruments.
Foreign Exchange (Currency pairs) – global currency trading.
Commodities (Gold, Oil, Wheat, etc.) – physical or derivative-based trade.
Mutual Funds & ETFs – pooled investment vehicles.
Cryptocurrencies (Bitcoin, Ethereum, etc.) – emerging digital assets.
6. Regulatory Framework
Financial markets are heavily regulated to maintain transparency, fairness, and investor protection. Regulatory bodies include:
Securities and Exchange Board of India (SEBI) – regulates Indian securities markets.
U.S. Securities and Exchange Commission (SEC) – oversees American securities markets.
Commodity Futures Trading Commission (CFTC) – regulates derivatives and commodity trading.
Central Banks – control money supply, interest rates, and banking regulations.
Regulation ensures stability, reduces fraud, and maintains investor confidence.
7. Technology and Financial Markets
Technological advancements have transformed financial markets:
Algorithmic Trading – automated trading using mathematical models.
High-Frequency Trading (HFT) – executing large volumes of trades in milliseconds.
Blockchain and Cryptocurrencies – decentralized, secure trading platforms.
Robo-Advisors – AI-based investment advisory services.
Mobile Trading Apps – enabling retail investors to trade seamlessly.
Technology improves efficiency, reduces costs, and increases accessibility.
8. Challenges in Financial Markets
Despite their benefits, financial markets face several challenges:
Market Volatility – prices can fluctuate due to economic, political, or global events.
Fraud and Manipulation – insider trading and market rigging remain risks.
Liquidity Risks – lack of buyers or sellers can affect market stability.
Regulatory Gaps – outdated regulations may fail to address new instruments.
Global Interconnectivity – crises in one market can affect others globally.
9. Recent Trends
Modern financial markets are evolving rapidly:
ESG Investing – focus on environmentally and socially responsible investments.
Digital Assets – growth of cryptocurrencies and tokenized securities.
Sustainable Finance – promoting green bonds and renewable energy projects.
Globalization of Markets – increased cross-border investments.
Financial Inclusion – mobile and digital platforms enabling wider participation.
10. Conclusion
Financial markets are the lifeblood of the global economy. They channel funds efficiently, provide investment opportunities, allow risk management, and drive economic growth. With technological advancements, regulatory oversight, and innovative instruments, financial markets continue to evolve, shaping the modern financial landscape.
Understanding these markets is crucial for investors, policymakers, and corporations to make informed decisions and navigate the complexities of the financial world.

Part 3 Learn Institutional TradingOption Greeks – The Science Behind Pricing
Options pricing is influenced by multiple factors. These sensitivities are known as the Greeks:
Delta – Measures how much option price changes with stock price.
Gamma – Rate of change of Delta.
Theta – Time decay (options lose value daily).
Vega – Sensitivity to volatility.
Rho – Sensitivity to interest rates.
Example: A call option with Delta = 0.6 means for every ₹10 rise in stock, option premium increases by ₹6.
Basic Option Strategies (Beginner Level)
Buying Calls – Bullish bet.
Buying Puts – Bearish bet.
Covered Call – Hold stock + sell call for extra income.
Protective Put – Own stock + buy put for downside insurance.

Part 2 Trading MasterclassOption Trading vs Stock Trading
Stocks = Ownership, long-term growth, dividends.
Options = Contracts, leverage, flexible strategies.
Stocks = Simpler, but capital-intensive.
Options = Complex, but require less capital and offer hedging.
For example:
Buying 100 shares of Reliance at ₹2500 = ₹2,50,000.
Buying 1 call option of Reliance at ₹100 premium with lot size 250 = only ₹25,000.
This leverage makes options attractive—but also riskier.
Real-Life Examples & Case Studies
Case 1: Bull Market
A trader buys Nifty 20000 Call at ₹200 premium. Nifty rallies to 20500. Profit = ₹300 (500 – 200). Huge return on a small premium.
Case 2: Bear Market
Investor holds TCS shares but fears a fall. Buys a protective put. When stock drops, put increases in value, reducing losses.
Case 3: Neutral Market
Trader sells an Iron Condor on Bank Nifty, betting price will stay range-bound. Premium collected = profit if market stays sideways.

Options Trading in India1. Introduction to Options Trading
Options trading has become one of the fastest-growing segments of the Indian financial market. Once considered a playground only for institutions and advanced traders, options are now widely accessible to retail investors thanks to online trading platforms, mobile apps, and reduced brokerage costs.
In India, the NSE (National Stock Exchange) is the world’s largest derivatives exchange in terms of contracts traded, with Bank Nifty and Nifty 50 options leading the charge. For retail traders, options present opportunities for hedging, speculation, and income generation, making them versatile instruments.
But options are also complex. Unlike stocks, where you directly own a piece of a company, options are derivative contracts—their value depends on the price of an underlying asset. This makes them both powerful and risky if not understood properly.
2. What are Options?
An option is a financial contract that gives the buyer the right, but not the obligation, to buy or sell an underlying asset at a predetermined price (strike price) before or on a specific date (expiry).
Call Option → Right to buy an asset at a strike price.
Put Option → Right to sell an asset at a strike price.
Unlike futures contracts, option buyers are not obligated to execute the trade. They can choose to let the option expire worthless if the trade doesn’t go their way.
3. Key Terms in Options Trading
Strike Price: The price at which you can buy/sell the underlying.
Premium: The cost paid to buy the option.
Expiry Date: Last day the option is valid (weekly/monthly in India).
Lot Size: Minimum tradable quantity (e.g., Nifty options = 25 units per lot).
ITM (In the Money): Option has intrinsic value.
ATM (At the Money): Strike price = underlying price.
OTM (Out of the Money): Option has no intrinsic value.
4. How Options Work (Indian Example)
Let’s take an example with Nifty 50 trading at ₹22,000:
Suppose you buy a Nifty 22,200 Call Option for a premium of ₹100 (lot size = 25).
Total cost = 100 × 25 = ₹2,500.
Case 1: Nifty goes up to 22,400
Intrinsic value = 22,400 – 22,200 = ₹200
Profit per lot = (200 – 100) × 25 = ₹2,500
Case 2: Nifty stays at 22,000 or falls
Option expires worthless.
Loss = Premium paid = ₹2,500
This asymmetry—limited risk, unlimited reward—is what attracts many retail traders to options.
5. Why Trade Options?
Leverage: Trade larger positions with smaller capital.
Hedging: Protect your portfolio against market falls.
Speculation: Bet on market direction with limited risk.
Income Generation: Write (sell) options to earn premium.
6. Options Market in India
Introduced in 2001 by NSE with index options.
Stock options followed in 2002.
India now has weekly expiries for Nifty, Bank Nifty, and FinNifty.
SEBI & Exchanges regulate margin rules, position limits, and trading practices.
The retail participation in options has exploded post-2020 with apps like Zerodha, Upstox, Angel One, Groww, making it extremely easy to trade.
7. Option Premium & Pricing (The Greeks Simplified)
Premium depends on:
Intrinsic Value = difference between spot & strike.
Time Value = extra value based on time to expiry & volatility.
The Greeks explain sensitivity of option price:
Delta: Sensitivity to underlying price.
Theta: Time decay (options lose value as expiry nears).
Vega: Sensitivity to volatility.
Gamma: Rate of change of Delta.
For example, Indian traders often notice how Bank Nifty weekly options lose value rapidly on expiry day (Theta decay)—which is why option sellers make money on “expiry day trading.”
8. Types of Options in India
Index Options – Nifty 50, Bank Nifty, FinNifty (most liquid).
Stock Options – Individual companies like Reliance, TCS, HDFC Bank.
Currency Options – USD/INR, EUR/INR (for forex hedging).
9. Options Trading Strategies
Basic Strategies
Long Call → Buy call, bullish.
Long Put → Buy put, bearish.
Covered Call → Own stock + sell call for income.
Protective Put → Own stock + buy put for protection.
Intermediate Strategies
Straddle: Buy Call + Put at same strike (bet on volatility).
Strangle: Buy Call (higher strike) + Put (lower strike).
Bull Call Spread: Buy low strike call + sell higher strike call.
Bear Put Spread: Buy put + sell lower strike put.
Advanced Strategies
Iron Condor: Range-bound strategy selling OTM call + put spreads.
Butterfly Spread: Profit from low volatility near strike.
Ratio Spreads: Adjust risk/reward with multiple options.
10. Margin Requirements & Leverage
Option buyers: Pay only premium (small capital).
Option sellers (writers): Need large margin (higher risk).
NSE SPAN + Exposure margin system determines requirements.
For example, selling 1 lot of Bank Nifty option may require ₹1.5–2 lakh margin depending on volatility.
11. Taxation of Options in India
Treated as business income under Income Tax Act.
Classified as non-speculative business income (since traded on exchange).
Profits taxed as per slab rate; audit required if turnover exceeds limits.
12. Risks in Options Trading
Time decay eats premium if direction isn’t quick.
Volatility crush reduces premium post-events (like RBI policy).
Unlimited risk for sellers if market moves sharply.
Liquidity issues in some stock options.
13. Options Trading Psychology
Requires discipline & patience—most beginners lose by overtrading.
Emotions like fear of missing out (FOMO) or greed destroy capital.
Successful option traders often specialize in 1–2 instruments (e.g., Bank Nifty weekly options).
14. Conclusion
Options trading in India has transformed from a niche product for institutions into a mainstream retail trading instrument. The flexibility of calls and puts allows traders to profit in any market—rising, falling, or sideways. However, the high leverage and complexity mean traders must respect risk management, taxation rules, and psychology.
For beginners, the right path is to:
Start with small option buying.
Learn option chain, Greeks, and price behavior.
Slowly graduate to spreads and hedged strategies.
Avoid naked selling until well-capitalized.
With discipline, knowledge, and the right strategies, options can become a powerful tool for wealth creation, hedging, and trading opportunities in India’s growing markets.
Retail vs Institutional Trading1. Introduction
In financial markets, traders can be broadly categorized into two groups: retail traders and institutional traders. While both operate in the same markets—stocks, forex, commodities, derivatives, cryptocurrencies—their goals, resources, and impact differ significantly.
Think of it like a chess game:
Retail traders are like passionate hobbyists, playing with personal strategies, smaller capital, and limited tools.
Institutional traders are like grandmasters with advanced chess engines, big teams, and massive resources.
Understanding the differences between these two groups is crucial for anyone involved in trading because:
It helps retail traders set realistic expectations.
It reveals how market moves are often driven by institutional flows.
It allows traders to align their strategies with the "big money" rather than fighting against it.
2. Defining the Players
Retail Traders
Who they are: Individual traders using their own capital to trade.
Examples: You, me, the average person with a brokerage account.
Capital size: Typically from a few hundred to a few hundred thousand dollars.
Trading style: Often short-term speculation, swing trading, or occasional long-term investing.
Motivation: Profit, financial freedom, hobby, or passive income.
Institutional Traders
Who they are: Professional traders working for large organizations, handling pooled funds.
Examples: Hedge funds, mutual funds, pension funds, banks, proprietary trading firms.
Capital size: Millions to billions of dollars.
Trading style: Long-term positions, algorithmic trading, arbitrage, high-frequency trading.
Motivation: Generate consistent returns for clients/investors, maintain market share, and manage risk.
3. Key Differences Between Retail & Institutional Trading
Aspect Retail Trading Institutional Trading
Capital Small, personal funds Huge pooled funds
Execution speed Slower, via broker platforms Ultra-fast, often via direct market access
Tools & technology Basic charting tools, retail brokers Advanced analytics, proprietary algorithms
Market impact Negligible Can move markets significantly
Risk tolerance Usually higher (due to smaller size) Often lower per trade but diversified
Regulations Fewer compliance rules Strict regulatory oversight
Information access Public data, delayed feeds Direct market data, insider networks (legal)
Strategy type Swing/day trading, small-scale strategies Large-scale arbitrage, hedging, portfolio balancing
4. Trading Infrastructure & Technology
Retail
Uses broker platforms like Zerodha, Upstox, Robinhood, E*TRADE.
Relies on charting software (TradingView, MetaTrader).
Order execution passes through multiple intermediaries, adding milliseconds or seconds of delay.
Limited access to Level 2 data and dark pool information.
Institutional
Uses Direct Market Access (DMA), bypassing middlemen.
Employs co-location — placing servers physically close to exchange data centers to reduce latency.
Custom-built AI-driven trading algorithms.
Access to Bloomberg Terminal, Reuters Eikon—costing thousands of dollars a month.
5. Market Impact
Retail Traders’ Impact
Individually, they have minimal effect on price.
Collectively, they can cause temporary market surges—e.g., GameStop 2021 short squeeze.
Often act as liquidity providers for institutional strategies.
Institutional Traders’ Impact
Can move prices by large orders.
Use order slicing (Iceberg Orders) to hide trade size.
Influence market sentiment through research, investment reports, and large portfolio shifts.
6. Trading Strategies
Retail Strategies
Day Trading – Quick in-and-out trades within the same day.
Swing Trading – Holding for days or weeks based on technical setups.
Trend Following – Buying in uptrends, selling in downtrends.
Breakout Trading – Entering when price breaches support/resistance.
Options Trading – Buying calls/puts for leveraged moves.
Copy Trading – Following successful traders’ trades.
Institutional Strategies
Algorithmic Trading – Automated, high-speed trade execution.
Market Making – Providing liquidity by quoting buy and sell prices.
Arbitrage – Exploiting price differences between markets.
Quantitative Strategies – Using statistical models for predictions.
Index Fund Management – Matching market indexes like S&P 500.
Hedging & Risk Management – Using derivatives to protect portfolios.
7. Advantages & Disadvantages
Retail Advantages
Flexibility: No need to report to clients.
Ability to take high-risk/high-reward bets.
Can enter/exit positions quickly due to small size.
Niche opportunities—small-cap stocks, micro trends.
Retail Disadvantages
Lack of insider or early information.
Higher transaction costs (relative to trade size).
Emotional trading—fear & greed affect decisions.
Lower technology access.
Institutional Advantages
Massive capital for diversification.
Best technology, research, and execution speeds.
Influence over market movements.
Access to private deals (private placements, IPO allocations).
Institutional Disadvantages
Large orders can move the market against them.
Regulatory and compliance burden.
Slower decision-making (bureaucracy).
Public scrutiny.
8. Regulatory Environment
Retail Traders:
Must follow general market rules set by SEBI (India), SEC (US), FCA (UK), etc.
Brokers are regulated; traders themselves are less scrutinized unless committing fraud.
Institutional Traders:
Heavily monitored by regulators.
Must follow reporting rules, such as 13F filings in the US.
Must ensure compliance with anti-money laundering (AML) and know-your-customer (KYC) laws.
9. Psychological Factors
Retail
Driven by emotions, social media hype, and news.
Prone to FOMO (Fear of Missing Out) and panic selling.
Often lack structured trading plans.
Institutional
Decisions made by teams, not individuals.
Uses risk-adjusted returns as a guiding principle.
Employs psychologists and behavioral finance experts to reduce bias.
10. Case Studies
GameStop 2021 – Retail Power
Retail traders on Reddit’s WallStreetBets caused a short squeeze.
Institutional short-sellers lost billions.
Showed that coordinated retail action can disrupt markets temporarily.
Flash Crash 2010 – Algorithmic Impact
Institutional algorithmic trading caused rapid market drops and rebounds.
Retail traders were mostly spectators.
Final Thoughts
Retail and institutional traders are two sides of the same market coin.
Retail traders bring diversity and liquidity, while institutional traders bring stability and efficiency—most of the time.
For retail traders, the key is to stop fighting institutional flows and instead follow their footprints. By understanding where big money is moving and aligning with it, retail traders can dramatically improve their odds of success.
In essence:
Institutional traders are the elephants in the market jungle.
Retail traders are the birds — smaller, more agile, able to grab quick opportunities the elephants can’t.
Long Axis Bank - target 1500Axis bank is forming inverted head and shoulder pattern. If it continues to form this pattern
then following are the target
Target 1 - 1218
Target 2 - 1339
Target 3 - 1500
Medium term view

Axis Bank : Swing Trade Pick#axisbank #swingtrade #momentumtrade #trendingstock
Axis Bank : Swing Trade
>> Low PE Stock
>> Banking Sector Theme, most likely to perform
>> Trending stock
>> Low Risk Trade
Swing Traders can lock profit at 10% and keep Trailing
Please Boost, comment and follow us for more Learnings.
Note : Markets are still Tricky and can go either ways so don't be over aggressive while choosing & planning your Trades, Calculate your Position sizing as per the Risk Reward you se and most importantly don't go all in
Disc : Charts shared are for learning purpose only, not a Trade recommendation. Do your own research and consult your financial advisor before taking any position.

Axis Bank breakout buy above the breakout onlyAxis Bank breakout buy above the breakout only, Axis has been hammered due to results, it can bounce, levels on the chart
R:R very good .1:3.2
B uy only if level triggers above 994, Future
If you want to hedge sell 1000 Call or not

AXIS BANK LEVELSSupport Level of AXIS BANK
Buy axis bank on these levels 987 when in hourly oversold region on intraday basis
823 is for positional buyers.
Don't short Axis bank on positional basis as it has not given enough return on 5 yearly basis
Fresh long trades now are not avaialble as market is weak
Consult your financial advisor before trading

Axis Bank Simple Trend Analysis!!AB can bounce from 1169 to 1189 in coming days and Ab has broken daily & weekily resistance trendline and also retested at the end on the day.
May a bounce can come if open above weekly trendline (1170) or gap up. if not another buying oppurtunity is will be at 1144 where both daily n weekly are intersecting.

Axis Bank Target and analysis NSE:AXISBANK
Do as directed in the chart
This is not the trading recommendation or advise
Do your analysis before taking any step. 🚨👍

AXISBANK complete domination by bulls this week AXISBANK looks to resume the uptrend to new highs as this week was overwhelmed by strong buying by forming an engulfing candle on weekly . Looks good buying opportunity with SL with this week's low
Cheers

Axis Bank Long Setup - Axis Bank is currently trading at 1175
- BNF is carrying a bullish structure and at the same time Axis Bank is trying to form a base
- Axis Bank looks for a swing long around 1155-1164
- Watch out for the invalidation before looking for longs
- The structure looks intact and it will soon expand towards the upside as long the index doesn't collide.

EURUSD Levels // 20 MinHello Everyone 👋
Current Price
1.0850: This is the latest price level, reflecting the current market sentiment.
Resistance Levels
1.0880: The first resistance level, where selling pressure might increase.
1.0920: The second resistance level, indicating a stronger barrier for upward movement.
1.0980: The third resistance level, a significant hurdle for the bulls.
Support Levels
1.0820: The first support level, where buying interest might emerge.
1.0780: The second support level, indicating a stronger floor for the price.
1.0740: The third support level, a critical point for the bears.
Technical Indicators
Moving Averages: The 50-day and 200-day moving averages can provide insights into the trend direction.
Relative Strength Index (RSI): An RSI above 70 indicates overbought conditions, while below 30 indicates oversold conditions.
MACD (Moving Average Convergence Divergence): This can help identify potential buy or sell signals.
Market Sentiment
Economic Data: Keep an eye on upcoming economic releases from the Eurozone and the US, such as GDP, employment data, and inflation reports.
Geopolitical Events: Any significant geopolitical developments can impact the EUR/USD pair.

Axis Bank - Pull Back TradeStrong demand zone area 1115-1135
Wait till stock reaches the area
May consolidate a while before making an upmove
Breach of 1100 will make the stock fall further, which right now dosent seems possible
Risk to rewards looks promising
