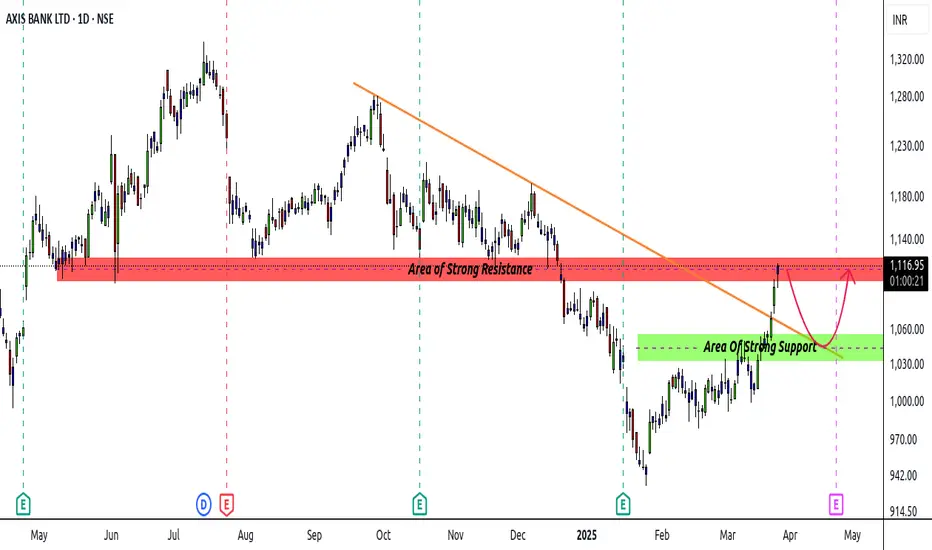
Axis Bank - Possible ResistanceStock in sideways to uptrend past few weeks
Right now reaching a DBD area + Flip zone
Combine resistance area from 1115 - 1125
Stock may go sideways and if possible try to move downwards upto 1040 - 50 levels
Upside Sl can be kept above 1030 (CLBS)
Whole market is in minor uptrend so be cautious before taking a counter trade
Take confirmation from LTF
Axisbanktrend
Axis Bank - Tough times aheadRecently stock managed to breach the yearly low of around 994 and went downhill upto 933
We saw some buying from the same areas as it had monthly n weekly demand zones
With that stock managed to pull itself back to 1k+ levels
But it seems struggling days are not yet over for axis
As we can clearly see, stock has got multiple and strong resistance point on daily time frame
1st starts immediately as a gap resistance zone between 1015 to 1030
2nd area at 1035 to 45
3rd at 1050 to 60
4th at 1085 to 95
5th from 1105 to 1120
Stock may or will try to reverse from these points in coming days
Alerts can be set accordingly
Lower TF confirmation is a must before entering
R:R on each level is excellent
Trade accordingly and cautiously

AXIS BANK LEVELSSupport Level of AXIS BANK
Buy axis bank on these levels 987 when in hourly oversold region on intraday basis
823 is for positional buyers.
Don't short Axis bank on positional basis as it has not given enough return on 5 yearly basis
Fresh long trades now are not avaialble as market is weak
Consult your financial advisor before trading

Axis Bank - Possibly BearishStock after good uptrend seems to be in a corrective mode
Created Multiple supply zones in various TFs
Last few minor supports left to be broken
Now strong resistance at 1265-70 can be used as SL
Can be sold on rise with proper RR

Axis Bank Good Long BetAXIS BANK looks good long opportunity to buy at dips, with bank nifty looking strong.Axis Bank looks good buy at current market price as price looks to take support at breakout point , trendline and weekly EMA.
Good opportunity as long as price stays above 1,100
Cheers

Axis bank looking bearish on higher time frame.
Axis bank has been trading around the higher level and is forming a base near 1030 zone. Both side movement can be there in the stock and confirmation is need for the entry to trigger.
But the stock on the weekly chart is showing some bearish RSI divergence and the dropping strength can be the initial signal of a bearish move.
On the daily charts, it is around the 200 ema. Either it will breach the levels or take support from the same. Watch for the levels and price action.
If the stock starts trading below the 1028 level and even close below it, next month expiry derivatives can be traded for the bearish momentum in the stock.
Major bearish target levels :- 980, 950.
Entry :- Close below 1028 levels.
Positional/ swing trade can be initiated in the stock for the next month expiry and trailing SL must be kept to limit the lose and capture the move.
Wait for the price action near the level before entering the trade.

Axisbank Support Level ExplainedAxisbank had given a breakout around 1100 level and made a high of close to 1130 and higher.. its resistance can now be well backed by a good support at 1100, On monday we can expect axisbank to open lower and fall even lower only to take support around 1100 and from there on we can expect further upside for axisbank.
Entry level 1100
Stop Loss 1080
Target 1145
Happy Trading,
Yamini Prabu
NSE,NISM Certified TA,
Independent Trader and Trainer

AXIS BANK Analysis for Short termIntraday view stock is in down trend. It's follow a trendline . When price will be near at or touch trendline we can shorts our position. For long term investor buy on dip . It's a best options for them .
Support: 1092
Resistance: 1104
Maximum volume at 1100 (So we can think if price will be near this level and create a bearish candle we can make a position on shorts)
As expected if continue the downtrend price will be come at 1090. if near 1090 any bullish candle will be create at 15 or 30 or 45 min then buy .
Level 1090 was the Fibonacci retracement zone.
Bullish position will be create when price will be trade upper 1104.


Axis Bank-Intraday-31.10.2023if trigger line crosses above 58.13 may reach to the level of 67.
if trigger line crosses below 47.51, may reach to the level of 34.31

Intraday Trade Setup #AxisbankPattern on this scrip is looking strong and there is a possibility of breakout.. Keep this in radar

Axis Bank Big Breakout But Wait For Right LevelsBuy Axis Bank. Cmp 868
Buy Only If Stock Come To 800-820
Add More If Falls To 770
Strict SL - 700 ( Weekly Closing Basis )
Target - 1000/1050/1150

AXISBANK LEVELS FOR MONDAY - 24-10-2022Important AXISBANK Levels ( Support & Resistance ) for Monday Market- 24-10-2022.

Axis Bank Chart analysis |Result DayAxis Bank Chart analysis
Negative divergence observed...
We should be in hurry to take it...wait for perfect time

Preparing for a BO ?????>In a consolidation zone dec 2018
>7th approach to resistance i.e - 815
>6th approach post 2020
> Trading above 200 MA in both weekly & daily chart
>Strong Bounce from 200 MA on a daily chart


Axis Bank Chart Analysis for next weekAxis Bank:
------------
Price Volume relationship:
---------------------------------
Monthly: Volume decline & Price up (Something fishy)
Weekly: Volume is supporting the Price movement but the last candle showed rejection from the top.
Day: Yes Volume is supporting price decline.
Now, look at the Red trendline & Black trendline intersection part, If goes below then further decline we can expect else vice-versa.

AXIS BANK - DAY CHART - 18.08.2022 - BAHAVAN CAPITALAXIS BANK as per Daily Chart Analysis
Stock Above 780 Target 798 levels.
Happy Trading to All...

AXISBANK Fresh BreakoutAxis Bank has Seen fresh breakout of Consolidation I am Buying Axis bank Future August around CMP 742 with Stoploss of 729 And Targets Expected are 772
Reason To Buy Axis bank:
# Ascending Triangle Pattern Breakout
# Bank Sector & Pvt Banking Looking Bullish
# Stock Trading above 20,50,100,200 EMA

Axis Bank broken previous resistanceAxis Bank broken previous resistance 738 to 740 today and it is looking good and bullish.
Expecting 800 to 850 levels in this month.

AXIS BANK DAY CHART LEVEL - 01.08.2022 - BAHAVAN CAPITALAXIS BANK as per daily chart analysis
Below 719 then Target @ 704 Level.
Above 738 then Target @ 750 Level

AXIS BANK CHART ANALYSIS - 26.07.2022 - BAHAVAN CAPITALAXIS BANK as per Daily chart pattern has broken 714 levels and iam anticipating the fall up to 660 levels.
Happy Trading to all...

AXIS BANK CHART ANALYSIS - 25.07.2022 - BAHAVAN CAPITALAXIS BANK As per Daily chart analysis if it Breaks 714 then expected to fall up to 660 levels.
Happy Trading to All....
