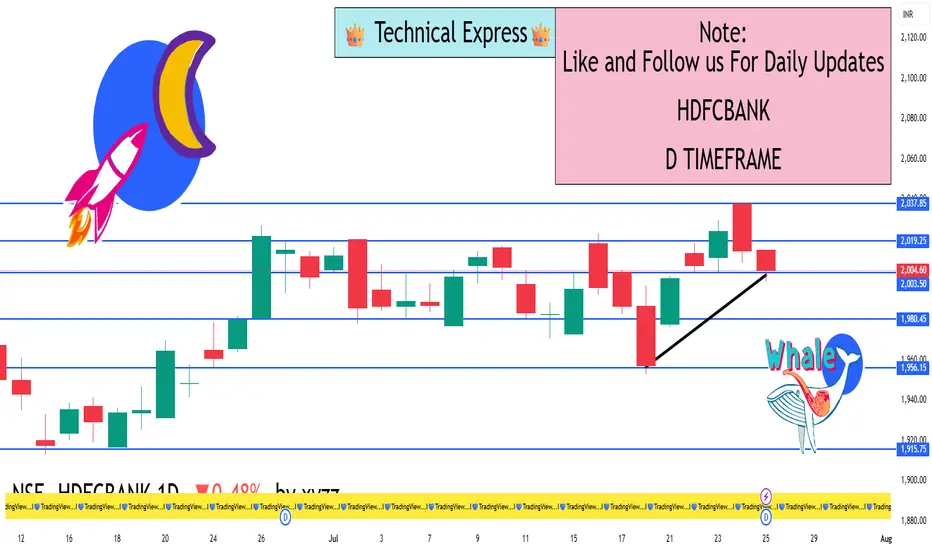
HDFCBANK 1D TimeframeClosing Price: ₹2,004.60
Opening Price: ₹2,018.80
Day’s High: ₹2,028.00
Day’s Low: ₹1,996.75
Net Change: –₹16.10 (–0.80%)
Trend: Mild Bearish
🔻 Support Levels
₹1,985 – Immediate support (20-day moving average)
₹1,950 – Short-term support (50-day moving average)
₹1,910 – Medium support (100-day moving average)
🔺 Resistance Levels
₹2,030 – Recent swing high and near-term resistance
₹2,050 – Breakout zone if momentum picks up
₹2,100 – Major resistance area
📈 Technical Indicators
RSI (Relative Strength Index): ~62
➤ In neutral to bullish territory, showing healthy momentum but close to overbought levels.
MACD (Moving Average Convergence Divergence):
➤ MACD line above Signal line – currently a bullish signal.
Volume:
➤ Normal trading volume; no heavy buying or panic selling.
➤ Indicates steady participation from both retail and institutional investors.
Candlestick Pattern:
➤ Small bearish candle after a strong bullish move earlier in the week.
➤ Indicates temporary profit booking or hesitation near resistance zone.
🧠 Market Sentiment
Overall sentiment remains positive for HDFC Bank due to:
Strong financials and balance sheet
Good loan growth reported in recent results
High investor confidence post bonus issue announcement
However, profit booking is likely near ₹2,030 as it is a psychological and technical resistance.
✅ Conclusion
Short-Term View: Mild pullback within an uptrend; no major weakness.
Medium-Term Trend: Still bullish as price remains above key moving averages.
Action to Watch:
A breakout above ₹2,030 may trigger a rally toward ₹2,050+.
A drop below ₹1,985 may invite short-term selling toward ₹1,950.