Next bull run leader from Heavyweight indexSharing analysis for daily TF only. Not a SEBI registered analyst, just sharing opinion. Please analyze carefully before investing.
Earlier price was showing hidden bullish divergence and then price gave a move of 6% in 3 weeks ( not bad for large cap).
Now, Price is breaking out from trendline & RSI is also at 60. Price looks almost ready for move. May be taken for a swing or can be a good entry for long-term accumulation.
Close the position if price closes below 50 EMA in daily for 3-4 days.
Bajajauto

Bearish Engulfing Candle: BAJAJ_AUTOToday's low is the support, i.e., 8996, which, if breached, will trigger the bearish engulfing candle.
The reason for publishing a video idea instead of a simple chart idea is to show you an interesting setting in the parallel channel of TradingView, in case you don't know about it.
Target range downside is between 8800-8750, depending on the line of support in the channel.

Bajaj Auto #Screener — Structure Compression Before the BreakoutBajaj Auto (NSE: BAJAJ-AUTO) is forming a clean structure compression between a long-term descending trendline (blue) and rising support trendline (purple).
The stock has created higher lows, showing buyer strength returning after a corrective phase.
This is a classic squeeze pattern where price coils before a directional move — something high-quality large caps often do before a trend continuation.
Key Structure Highlights
📌 Strong support base at ₹8550–8600
📌 Rising trendline support since Mar 2025
📌 Sellers defending the ₹9490 major supply zone
📌 Multiple failed breakdowns → indicates demand
📌 Compression between trendlines tightening
📌 Price still above 50 EMA on weekly (momentum intact)
Key Levels
Major Resistance:
₹9490 (big supply zone + trendline confluence)
Support Levels:
₹8850
₹8550 (structure support)
Below this, momentum weakens
As long as price maintains above ₹8550, structure stays bullish-to-neutral with potential for upside resolution.
View
Momentum bias stays positive above ₹8550.
A decisive close above ₹9490 may trigger a clean continuation move.
Technical Snapshot
✅ Large-cap quality stock
✅ Higher lows (structure strength)
✅ Price contraction = energy build-up
✅ Watching breakout above ₹9490 for trend continuation
✅ Good risk-defined setup for swings
This isn’t a random breakout play — it’s a large cap structural setup, where the next move usually sets a multi-week trend.
📒 Educational price structure analysis — not investment advice.

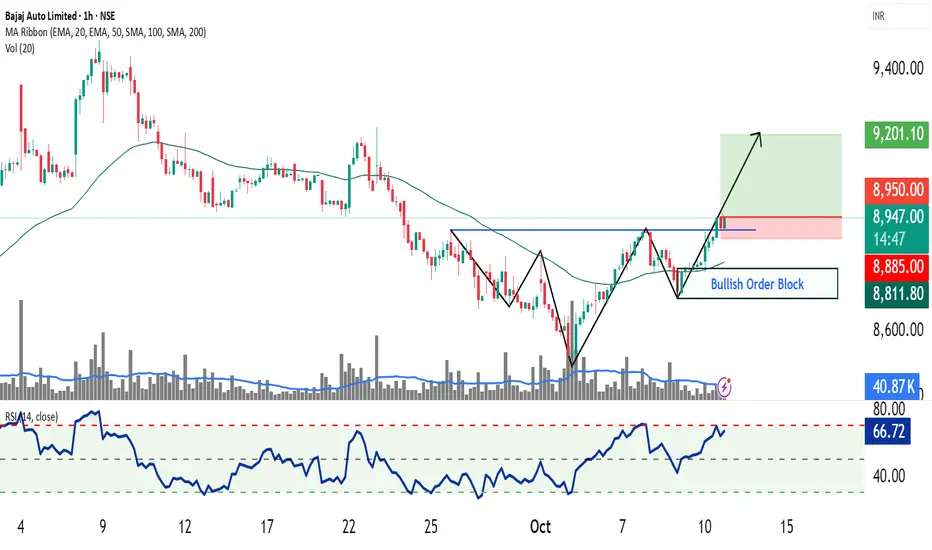
#BajajAuto | Inverse Head & Shoulders Breakout Alert!📊 CMP: 9057 | 🎯 Pattern Target: 9900+ (+10% from cmp)
🛡 Support: 9012-9005 / 8956 | 🚧 Resistance: 9168-9174 / 9225-9237 / 9455-9490
❌ Invalidation Level: Below 9005 (4 HCB)
#BajajAuto | #InverseHeadnShoulders | #ChartPattern | #SwingTrade | #PriceAction
📌 Disclaimer: This analysis is shared for educational purposes only. It is not a buy/sell recommendation. Please do your own research before making any trading decisions.

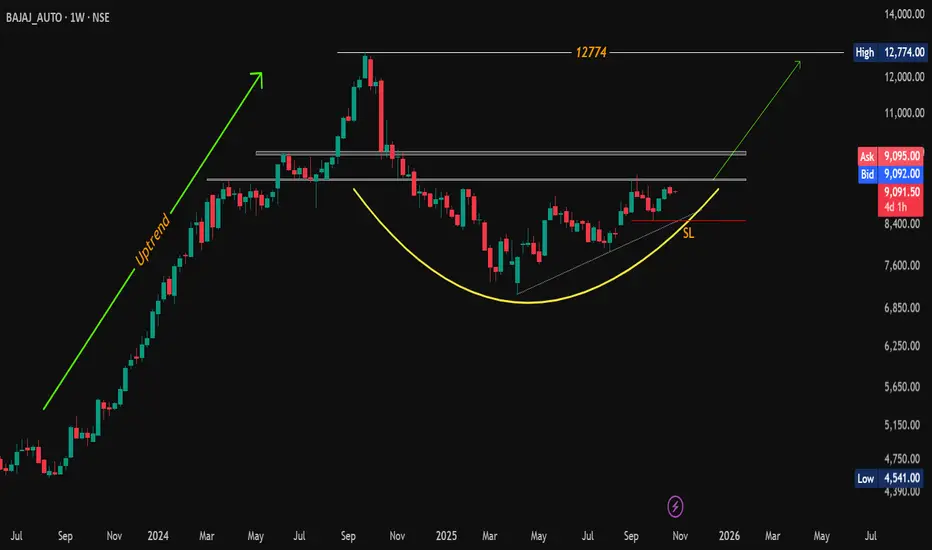
#BajajAuto | Rounding Bottom spotted on the Weekly timeframe!CMP: 9,091
🔽 Support: 8787–8741 / 8680
🔼 Resistance: 9156 / 9386 / 9490 / 9962–10039
💥 Weekly close above 9386 = momentum breakout zone!
❌ Pattern invalidation: below 8491.50 (WCB)
Bias remains bullish while above support.
#BajajAuto | #RoundingBottom | #ChartPatterns | #PriceAction | #SwingTrade
📌 Disclaimer: This analysis is shared for educational purposes only. It is not a buy/sell recommendation. Please do your own research before making any trading decisions.
Bajaj Auto – Bullish head and shoulder breakout📈 Pattern Analysis: Bajaj Auto has successfully completed a Bullish Head and Shoulders pattern on the chart, followed by a clean breakout and subsequent retest, confirming the validity of the formation. The price action now awaits a pivot breakout, which would trigger the next leg of upside momentum.
📊 Trading Strategy:
Two distinct trading approaches can be considered based on trader type:
1. Retail Concept Strategy:
Enter long above the pivot high once price breaks decisively.
Place stop-loss below the breakout candle, ensuring a safer entry with confirmation.
Note: The risk–reward ratio is less favorable if the SL is kept below the right shoulder in classical style.
2. Smart Money Strategy:
Enter on retrace to the order block area positioned just above the right shoulder.
This offers a superior risk–reward entry aligned with institutional-style trading concepts.
🔎 Indicators & Trend:
50 EMA is sloping upward on the hourly timeframe, confirming short-term uptrend strength.
RSI > 65, indicating sustained bullish momentum with potential for continuation.
🎯 Target Projection:
Targets will be determined using the measurement rule, projecting the height of the head added to the neckline breakout zone.
⚠️ Disclaimer:
This analysis is prepared only for educational and training purposes. It does not constitute investment advice or a trading recommendation.
✍️ Prepared by: SEBI Certified Research Analyst (Not Registered)
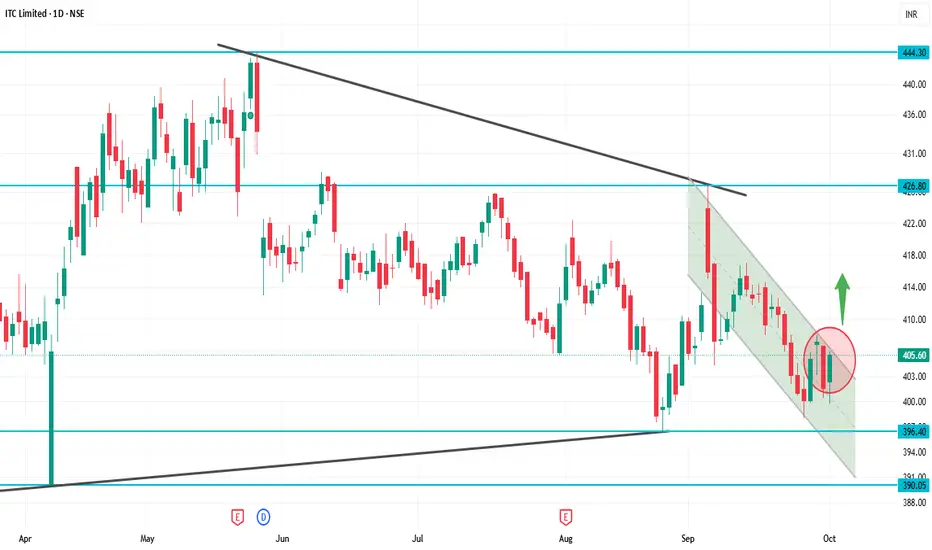
ITC 1D Time frameCurrent Price: ₹405.60
52-Week High: ₹524.35
52-Week Low: ₹390.15
Trend: Downward — trading below 5, 20, 50, 100, 200-day moving averages
Daily Chart Insights
Price below moving averages → bearish trend.
RSI & MACD → weak momentum, signaling short-term selling pressure.
Support zone at ₹390–₹400 → critical; a break below can push price down to ₹370–₹380.
Resistance at ₹420–₹430 → a strong close above may signal trend reversal.
Strategy / Outlook
Bearish Bias: Short-term trend is downward.
Buying Opportunity: Near support zones (₹390–₹400) if it holds.
Bullish Trigger: Close above ₹430 with strong volume indicates potential reversal.
Risk Management: Use stop-loss below critical support zones.
SBIN 1D Time frameCurrent Price (approx): ₹864
52-Week Low: ₹680
52-Week High: ₹880.50
Daily Chart Explanation
On the 1-day timeframe, SBIN is moving near its upper range, close to the recent high. This means the stock is strong but also facing heavy resistance.
Trend: Uptrend overall (higher highs and higher lows).
Momentum: Price is consolidating near resistance, showing hesitation.
Candles: Recent candles show wicks near the top, which means sellers are active near ₹880.

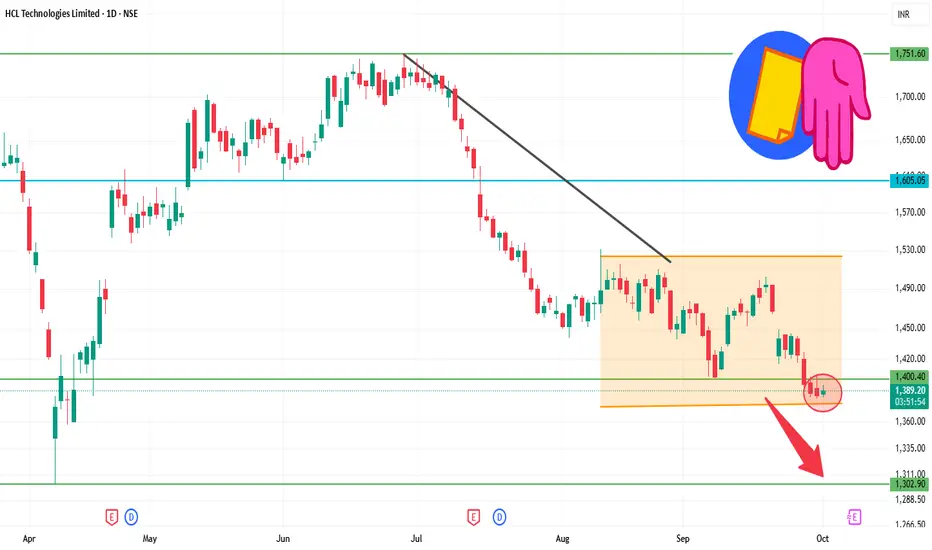
HCLTECH 1D Time frameOpening Price: ₹1,387.40
Closing Price: ₹1,387.40
Day Range: ₹1,383.10 – ₹1,395.00
Previous Close: ₹1,387.40
📉 Trend Analysis
Short-Term Trend: Bearish — The stock is trading below key moving averages, confirming the bearish trend.
Medium-Term Trend: Neutral — The stock is in a consolidation phase, characterized by lower highs and lower lows.
Long-Term Trend: Neutral — No significant trend identified; the stock is trading within a range.
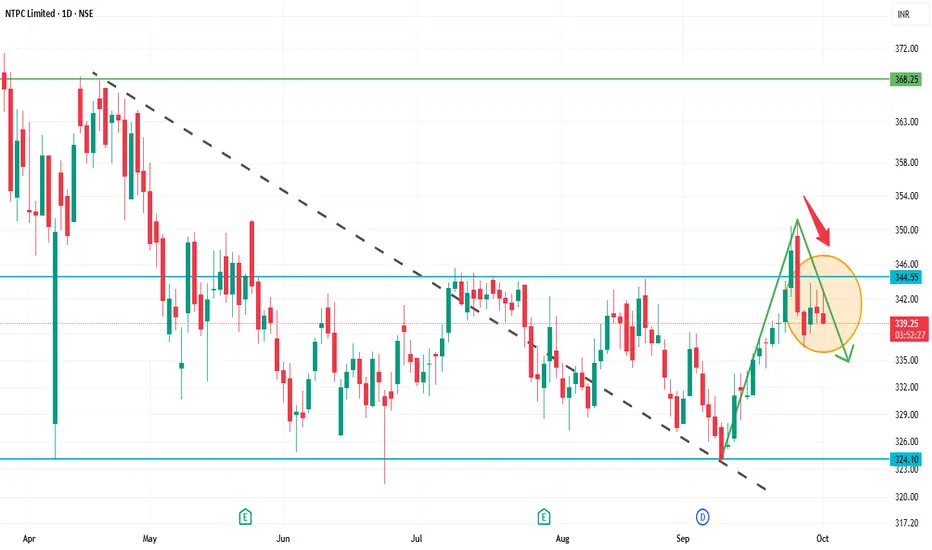
NTPC 1D Time frameOpening Price: ₹340.30
Closing Price: ₹340.25
Day Range: ₹339.45 – ₹343.05
📉 Trend Analysis
Short-Term Trend: Bearish — The stock is trading below key moving averages, confirming the bearish trend.
Medium-Term Trend: Neutral — The stock is in a consolidation phase, characterized by lower highs and lower lows.
Long-Term Trend: Neutral — No significant trend identified; the stock is trading within a range.
🔮 Conclusion
NTPC Ltd. is in a bearish trend with weak momentum.
Break below ₹335.00 could lead to further decline toward ₹330.00.
Break above ₹347.00 would indicate a potential trend reversal.
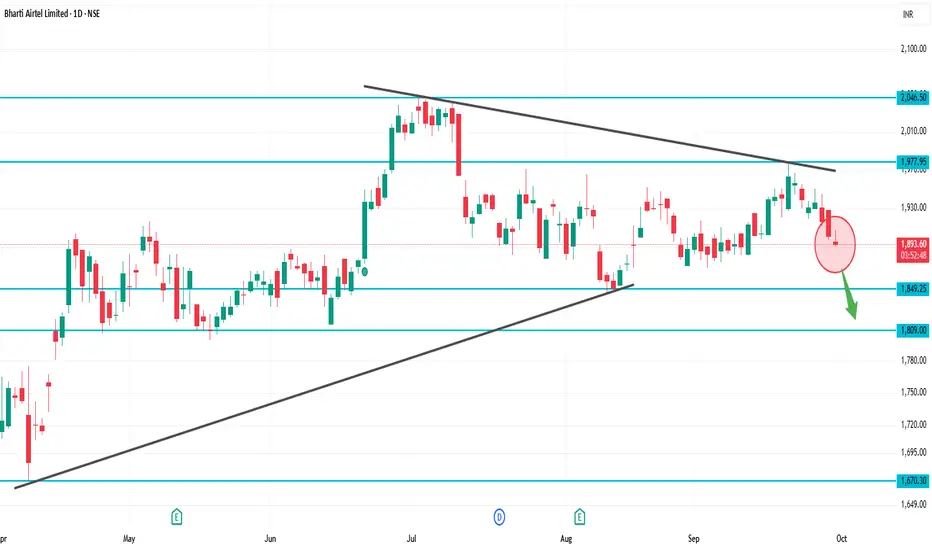
BHARTIARTL 1D Time frameCurrent Price Snapshot
Current Price: ₹1,897.80
Day’s Range: ₹1,890.80 – ₹1,907.60
52-Week Range: ₹1,511.00 – ₹2,045.80
Technical Indicators
RSI (14-day): 44.19 — indicates a neutral to slightly bearish momentum.
MACD: -4.010 — suggests bearish momentum.
Moving Averages:
5-day: ₹1,896.00 — indicates a Sell signal.
50-day: ₹1,890.00 — indicates a Sell signal.
200-day: ₹1,850.00 — indicates a Buy signal.
Technical Summary: Predominantly Sell signals across various indicators.
Summary
Above ₹1,907.60: Potential rise toward ₹1,920 – ₹1,940.
Below ₹1,890.80: Potential fall toward ₹1,880 – ₹1,860.
Between ₹1,860 – ₹1,900: Likely range-bound movement.
BAJFINANCE 1D Time frameCurrent Price Snapshot
Current Price: ₹999.00
Day’s Range: ₹989.45 – ₹1,002.30
52-Week Range: ₹645.10 – ₹1,036.00
Technical Indicators
RSI (14-day): 59.37 — indicates a neutral to slightly bullish momentum.
MACD: -4.010 — suggests bearish momentum.
Moving Averages: Mixed signals — short-term averages are bearish, while long-term averages are bullish.
Technical Summary: Predominantly Buy signals across various indicators.
Summary
Above ₹1,002.30: Potential rise toward ₹1,020 – ₹1,030.
Below ₹989.45: Potential fall toward ₹980 – ₹970.
Between ₹980 – ₹1,010: Likely range-bound movement.
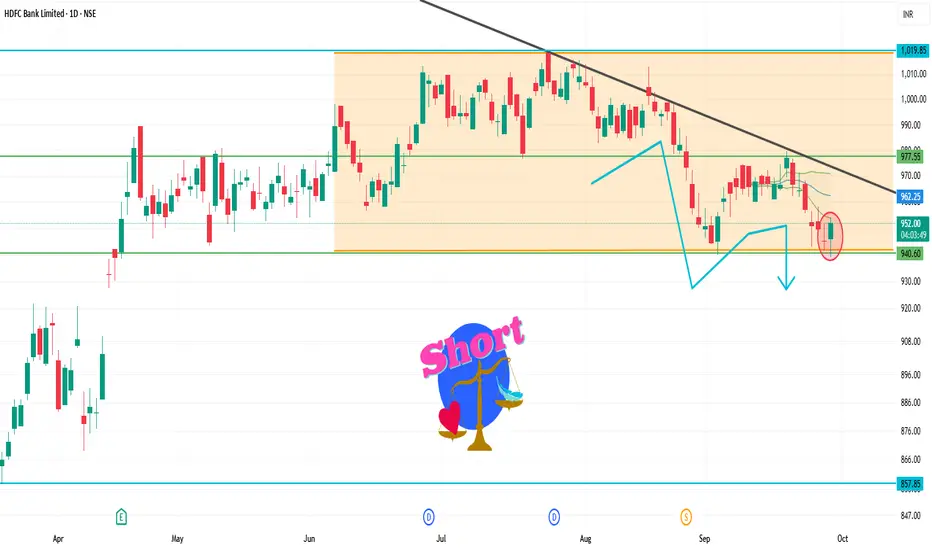
HDFCBANK 1D Time frameCurrent Market Snapshot
Current Price: ₹954.05
Opening Price: ₹945.10
Day's Range: ₹939.10 – ₹953.00
Previous Close: ₹945.05
🔑 Technical Indicators
Relative Strength Index (RSI): 35.08 – indicating a neutral to bearish condition.
Moving Average Convergence Divergence (MACD): -6.02 – suggesting bearish momentum.
Moving Averages: Trading below the 50-day and 200-day moving averages, indicating a bearish trend.
📈 Key Support & Resistance Levels
Immediate Support: ₹939
Immediate Resistance: ₹953
Pivot Point: ₹946
📉 Market Sentiment
Trend: The stock is trading below its 50-day and 200-day moving averages, indicating a bearish trend.
Volume: Trading volume is higher than average, suggesting increased investor activity.
📈 Strategy (1D Timeframe)
1. Bullish Scenario
Entry: Above ₹953
Stop-Loss: ₹939
Target: ₹960 → ₹965
2. Bearish Scenario
Entry: Below ₹939
Stop-Loss: ₹953
Target: ₹930 → ₹925
⚠️ Risk Management
Limit risk to 1% of capital per trade.
Always use stop-loss to protect against unexpected market movements.
Monitor broader market trends and sector-specific news that may impact stock performance.
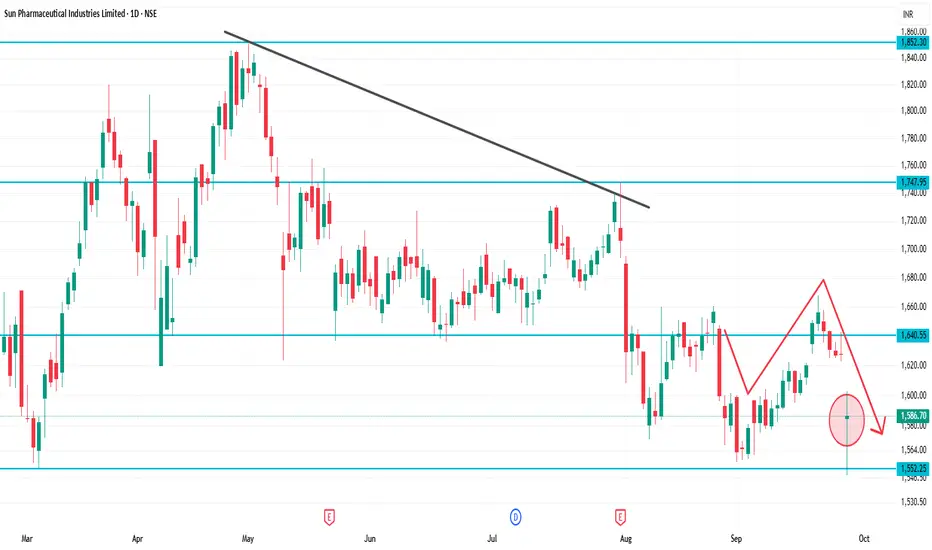
SUNPHARMA 1D Time frameCurrent Price: ~₹1,586
Day Range: ~₹1,582 – ₹1,600
52-Week High: ~₹1,960
52-Week Low: ~₹1,553
📈 Technical Outlook
Immediate Support: ₹1,580 (very close to current price)
Strong Support: ₹1,553 – ₹1,560 (52-week low zone)
Immediate Resistance: ₹1,600 – ₹1,620
Major Resistance: ₹1,650 – ₹1,670
Trend Bias:
Stock is weak, testing lower supports.
If it breaks below ₹1,580, then ₹1,553 may be tested.
A bounce is only possible if it sustains above ₹1,600.
📌 Step-by-Step Market View
Above 1,600: Chance for small recovery toward ₹1,620 – ₹1,650.
Stays between 1,580 – 1,600: Consolidation zone.
Breaks below 1,580: Weakness may extend to ₹1,553.
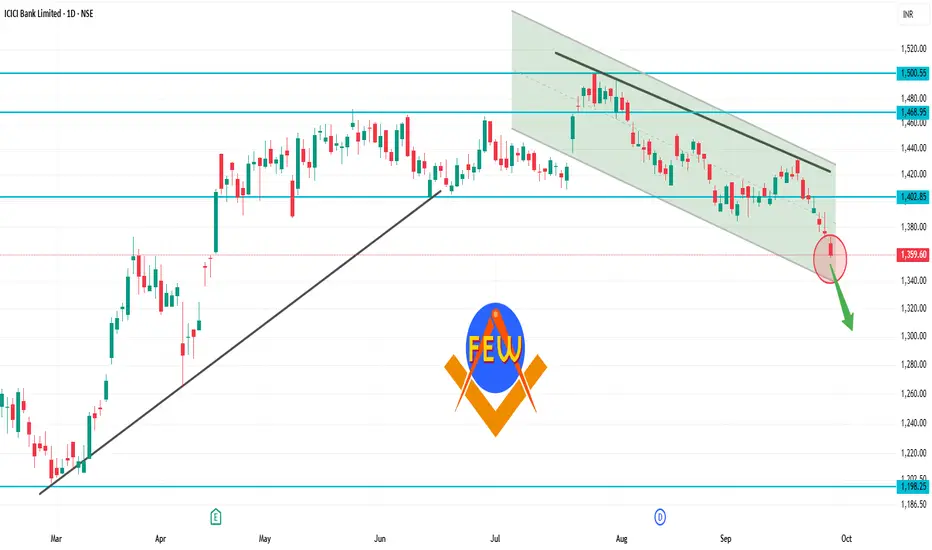
ICICIBANK 1D Time frameClosing Price: ₹1,363.00
Day's Range: ₹1,357.00 – ₹1,372.70
Previous Close: ₹1,375.80
Volume: 18,342,280 shares traded
Market Cap: ₹971,186 crore
52-Week High: ₹1,500.00
52-Week Low: ₹1,186.00
Face Value: ₹2.00
Beta: 0.90
🧾 Financial Highlights
P/E Ratio (TTM): 18.36
P/B Ratio: 3.12
EPS (TTM): ₹74.04
Dividend Yield: 0.81%
ROE: 17.05%
Book Value: ₹436.56
📈 Technical Insights
Trend: The stock is approaching its 200-day moving average, a key technical indicator. A bounce from this level could signal a buying opportunity, while a breakdown may suggest further downside risk.
Support Levels: ₹1,357.00, ₹1,350.00
Resistance Levels: ₹1,375.00, ₹1,400.00
📌 Key Takeaways
Recent Performance: ICICI Bank's stock declined by 0.91%, underperforming the broader market.
Analyst Sentiment: Despite recent volatility, ICICI Bank remains a top pick among analysts for long-term investment.
INFY 1D Time frame📊 Daily Snapshot
Closing Price: ₹1,484.65
Day’s Range: ₹1,476.50 – ₹1,502.70
Previous Close: ₹1,494.60
Change: Down –0.64%
52-Week Range: ₹1,307.00 – ₹2,006.45
Market Cap: ₹6.17 lakh crore
P/E Ratio (TTM): 22.62
Dividend Yield: 2.90%
EPS (TTM): ₹65.63
Beta: 1.09 (indicating moderate volatility)
🔑 Key Technical Levels
Support Zone: ₹1,469 – ₹1,473
Resistance Zone: ₹1,485 – ₹1,490
Pivot Point: ₹1,480.97 (Fibonacci)
All-Time High: ₹2,006.45
📈 Technical Indicators
RSI (14-day): 44.45 – approaching oversold territory, suggesting potential for a rebound.
MACD: Negative at –6.34, indicating bearish momentum.
Moving Averages: Trading below the 50-day (₹1,511.06) and 200-day (₹1,495.15) moving averages, indicating a bearish trend.
Stochastic RSI: Between 45 and 55, indicating a neutral condition.
CCI (20): Between –50 and 50, implying a neutral condition.
📉 Market Sentiment
Recent Performance: Infosys experienced a decline of 0.64% on September 25, 2025, underperforming the broader market.
Volume: Trading volume was significantly higher than its 20-day average, indicating increased investor activity.
📈 Strategy (1D Timeframe)
1. Bullish Scenario
Entry: Above ₹1,485
Stop-Loss: ₹1,469
Target: ₹1,490 → ₹1,500
2. Bearish Scenario
Entry: Below ₹1,469
Stop-Loss: ₹1,485
Target: ₹1,460 → ₹1,450
SBIN 1D Time frame📊 Daily Snapshot
Closing Price: ₹861.15
Day’s Range: ₹859.95 – ₹870.15
Previous Close: ₹866.20
Change: Down –0.59%
52-Week Range: ₹680.00 – ₹880.50
Market Cap: ₹794,895 crore
P/E Ratio: 10.01
Dividend Yield: 1.85%
EPS (TTM): ₹86.06
Beta: 1.00 (indicating average market volatility)
🔑 Key Technical Levels
Support Zones: ₹860.00 – ₹854.00 – ₹844.00
Resistance Zones: ₹876.00 – ₹886.00 – ₹892.00
All-Time High: ₹912.00
Fibonacci Pivot Point: ₹865.68
📈 Strategy (1D Timeframe)
1. Bullish Scenario
Entry: Above ₹876.00
Stop-Loss: ₹859.00
Target: ₹886.00 → ₹892.00
2. Bearish Scenario
Entry: Below ₹859.00
Stop-Loss: ₹866.00
Target: ₹854.00 → ₹844.00

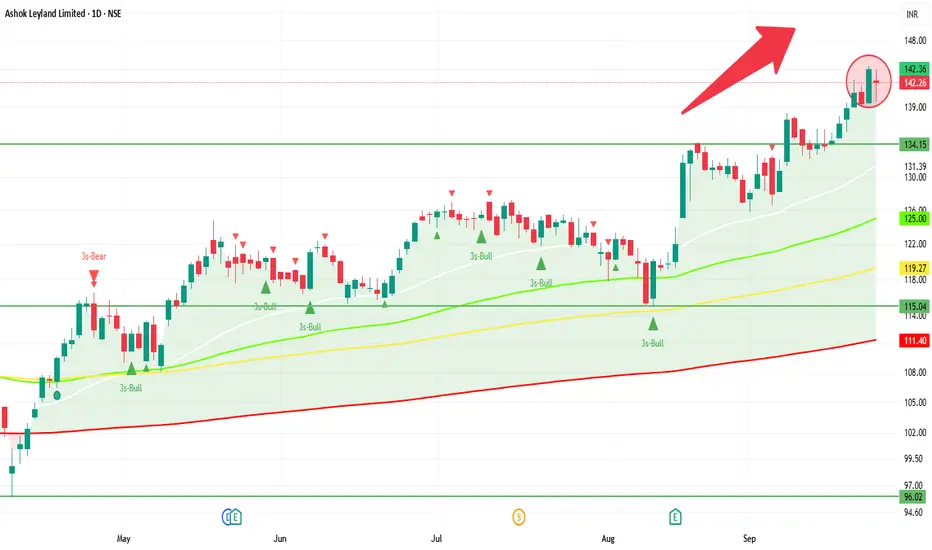
ASHOKLEY 1D Time frame📊 Today's Performance
Closing Price: ₹142.26
Day’s Range: ₹139.60 – ₹143.99
Previous Close: ₹144.04
Change: Down ~ –1.24%
52-Week Range: ₹95.93 – ₹144.50
Volume: ~36.96 million shares
Market Cap: ₹83,556 crore
P/E Ratio: 26.05
Dividend Yield: 4.39%
EPS (TTM): ₹5.46
🔍 Key Technical Levels
Support Zone: ₹139.60 – ₹140.00
Resistance Zone: ₹143.50 – ₹144.50
All-Time High: ₹144.50
📈 Strategy (1D Timeframe)
1. Bullish Scenario
Entry: Above ₹143.50
Stop-Loss: ₹141.50
Target: ₹146.00 – ₹148.00
2. Bearish Scenario
Entry: Below ₹139.60
Stop-Loss: ₹141.50
Target: ₹136.00 – ₹134.00
SENSEX 1D Time frame📊 Today’s Sensex Performance
Closing Level: ~ 81,715.63
Point Change: ~ –386.47
% Change: ~ –0.47%
The market has been weak lately; today extends losses.
Broad weakness across sectors, with IT & financials under pressure.
🎯 Key Support & Resistance Levels
Support Zone: ~ 81,550 to 81,400
Strong Support: ~ 81,200
Resistance Zone: ~ 82,000 to 82,150
If Sensex rises above 82,150 and holds, bullish bias may resume.
But if it breaks below 81,400 with strength, further downside possible.
📝 Strategy Ideas for Next Trading Day(s)
Bearish Setup (if weakness continues)
Short when Sensex rallies into resistance (~ 82,000–82,150) and shows reversal candle or weakness.
Stop-loss just above 82,200.
Target toward support zones: 81,400 → 81,200.
Bullish Setup (if rebound happens)
If Sensex finds support near ~ 81,400–81,550 and bounces with strength, go long.
Stop-loss below 81,300.
Target toward 82,000 → 82,150.
Range / Intraday Play
Trade between 81,400 (support) and 82,100 (resistance) as range, until a decisive breakout occurs.
Keep tight stop-losses, take small profits.

SBIN 1D Time frame📍 Today’s Expected Range (Intraday Approximation)
Expected High: ₹861–₹865
Expected Low: ₹855–₹850
These are approximate intraday levels. Actual prices may fluctuate slightly due to volatility.
🔍 Key Points
Current price: ₹860–₹861, close to resistance.
If price breaks above ₹861–₹865 with strong volume → bullish momentum likely.
If price drops below ₹855–₹850 → short-term correction or pullback possible.
📊 Suggested Trading Strategy
Bullish Scenario
If SBIN breaks ₹861–₹865, you can buy, targeting ₹870–₹875.
Stop-loss: ₹855
Bearish Scenario
If SBIN drops below ₹855, you can sell/short, targeting ₹850–₹845.
Stop-loss: ₹860
Range-Bound / Sideways
If SBIN trades between ₹855–₹861, it’s better to wait and avoid trading until a clear breakout occurs.
💡 Summary
Resistance Zone: ₹861–₹865
Support Zone: ₹855–₹850
Strategy: Trade in the direction of the breakout, and always use stop-loss to manage risk.

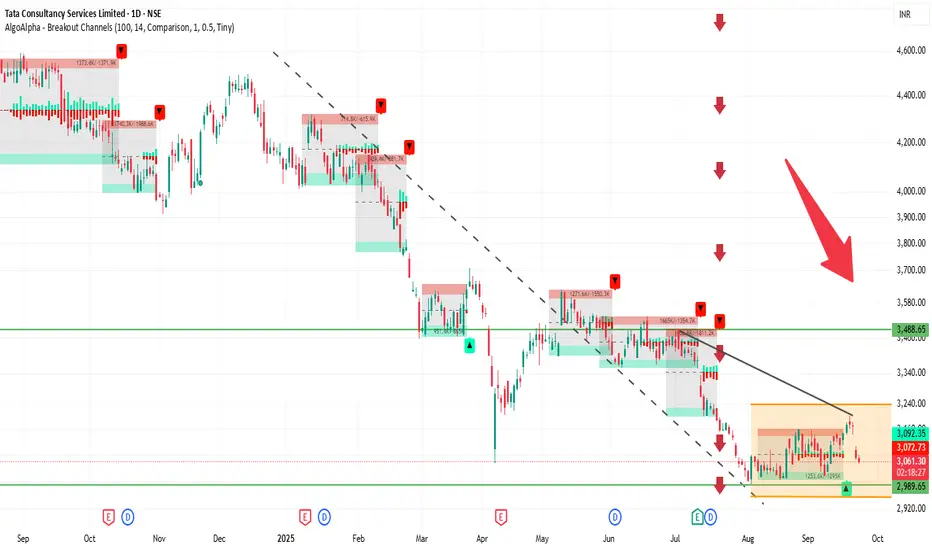
TCS 1D Time frame📍 Current Price & Range
Current price: ₹3,063.80
Day’s High / Low: ₹3,106.90 / ₹3,052.00
52-week High / Low: ₹4,494.90 / ₹2,991.60
🔍 Key Levels
Immediate resistance: ₹3,100–₹3,110
Next resistance: ₹3,200–₹3,250
Immediate support: ₹3,050–₹3,060
Psychological / strong support: ₹3,000
📊 Indicators & Momentum
Price is just below near-term resistance, showing hesitation.
Short-term trend is neutral to slightly bearish; momentum is weak.
RSI and MACD suggest neutral to weak momentum, no strong reversal yet.
Stock is trading well below its 52-week high, indicating it has already corrected significantly.
🔮 Possible Scenarios
Bullish breakout → Sustaining above ₹3,110 could push price toward ₹3,200–₹3,250.
Sideways / consolidation → Likely to trade between ₹3,050–₹3,110 if no strong catalyst.
Bearish pullback → Breaking below ₹3,050 may take price toward ₹3,000, and further down to ₹2,950–₹2,900 if weakness continues.
👉 Outlook: At the current level (₹3,073.80), TCS is in a neutral zone. The next directional move depends on either a breakout above resistance or a fall below support.
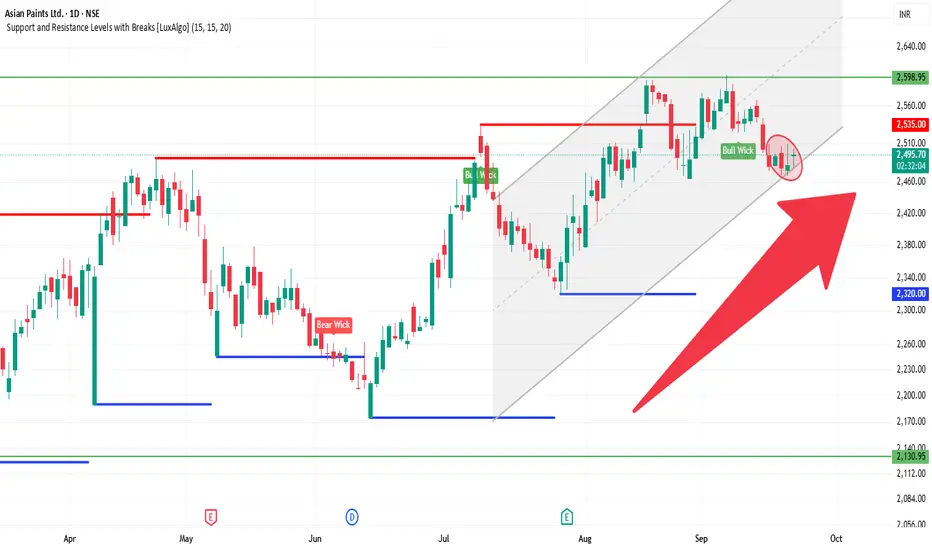
ASIANPAINT 1D Time frame🔍 Current Status
The stock is trading around ₹2,490 – ₹2,500
Recent price action has been somewhat mixed — not a strong trend, some resistance in higher zones.
🧮 Trade Strategy Ideas
Long Setup:
If price holds above ~₹2,460 and shows reversal candlestick or volume strength.
Target resistance around ₹2,505-₹2,528.
Stop-loss could be placed just below ₹2,440 or so (to protect against breakdowns).
Short / Pullback Setup:
If price gets rejected near resistance around ₹2,505-₹2,528 and bearish candlestick forms.
Potential downside toward ~₹2,460 first, then further to ~₹2,420.
Breakout Setup:
If price breaks above ~₹2,528 with good volume, could aim for ~₹2,546 or higher.
Must confirm with strength / follow-through.
✅ Summary: Asian Paints is in a consolidation / neutral phase. Key to watch is how it reacts around the resistance zone ~₹2,505-₹2,528. Holding above support ~₹2,460 is important. A clear breakout gives upside, else downside risk remains.
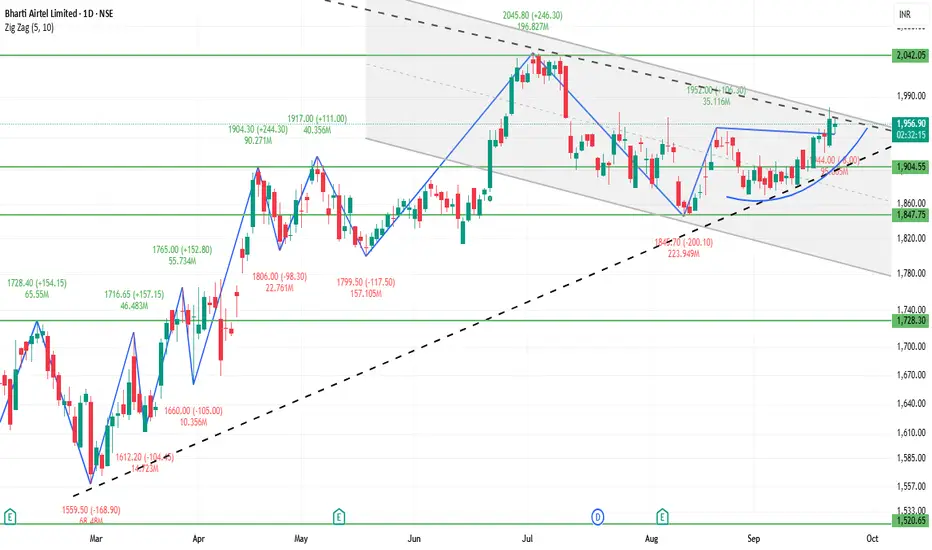
BHARTIARTL 1D Time frame🔍 Current Price & Context
Trading around ₹1,950 – ₹1,960 (approx).
Day’s range recently: low ~ ₹1,944 – ₹1,946, high ~ ₹1,920 – ₹1,925 — showing testing of resistance.
52-week range: low ~ ₹1,510, high ~ ₹2,045.
🧮 Strategy / Trade Ideas
Long Setup:
Entry could be around / just above support zone (₹1,900 – ₹1,895) if there are reversal signals (bullish candles, volume).
Stop loss: slightly below deeper support (~₹1,870 – ₹1,880) to protect against breakdown.
Initial target: resistance around ₹1,920 – ₹1,930. If crossed, then next target near ₹1,950 – ₹1,960.
Short / Pullback Setup:
If price fails to break above resistance (~₹1,920 – ₹1,930) and shows signs of reversal (bearish candle, volume drop).
Target downward to support ~₹1,900, then further to ~₹1,880 – ₹1,870.
Breakout Setup:
If it breaks above ~₹1,950 – ₹1,960 with good volume, then move toward psychological level ~₹2,000 and possibly toward 52-week high (~₹2,045).
✅ Summary
Bharti Airtel in daily chart is showing a mild bullish bias, but the resistance zones (~₹1,920-₹1,930, ₹1,950-₹1,960) are critical. Holding above support around ₹1,900 is important. A clear breakout above resistance could open room for upside; failure to do so may lead to sideways movement or slight downside.