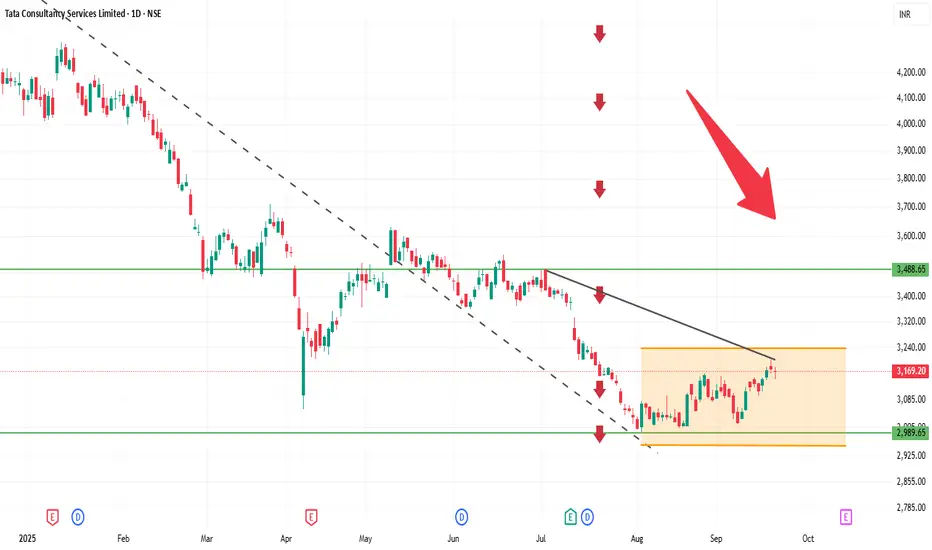
TCS 1D Time frameCurrent Price: Around 3,174
Current Trend: Stock is in a sideways to slightly bullish phase after consolidation.
Support Zone: Strong support at 3,140 – 3,150. Buyers may defend this level.
Resistance Zone: Key resistance at 3,200 – 3,220. A breakout above 3,220 can trigger fresh upside.
Indicators: Daily candles indicate mild buying interest; volume is stable.
Outlook:
Above 3,220 → bullish momentum may extend toward 3,250+.
Below 3,140 → weakness may push toward 3,100–3,120.
👉 In short:
Range: 3,140 – 3,220.
Neutral to slightly bullish; breakout will determine next move.
Bajajauto
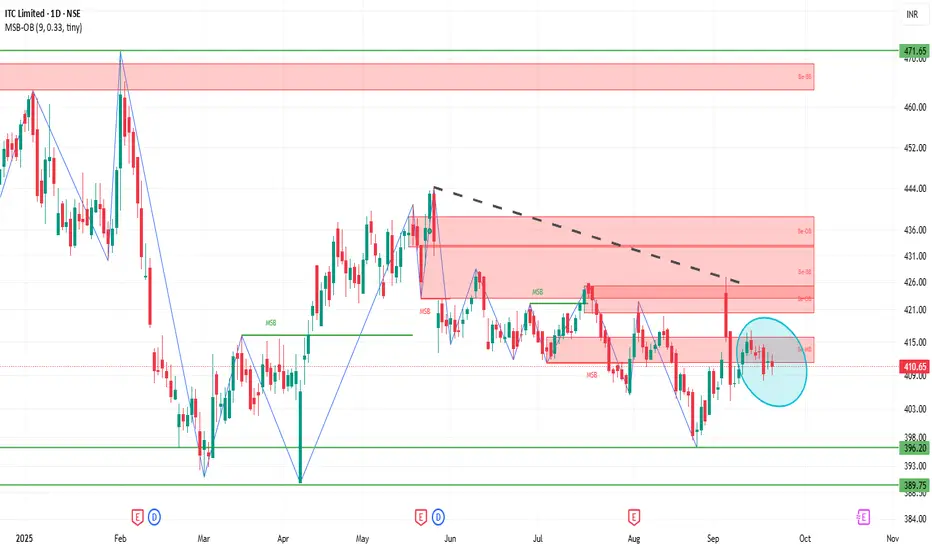
ITC 1D Time frameCurrent Price: Please confirm, but ITC is trading near 440–445 zone recently.
Current Trend: Stock is in consolidation after a recent decline; sideways movement visible.
Support Zone: Strong support lies at 435 – 438. If this holds, stock may bounce.
Resistance Zone: Major resistance is around 450 – 455. A breakout above 455 can bring fresh upside.
Indicators: Daily candles show buyers trying to defend lower levels, but volume is moderate.
Outlook:
Above 455 → bullish momentum may return.
Below 435 → weakness can extend toward 425.
👉 In short:
Range: 435 – 455.
Neutral tone, waiting for breakout.
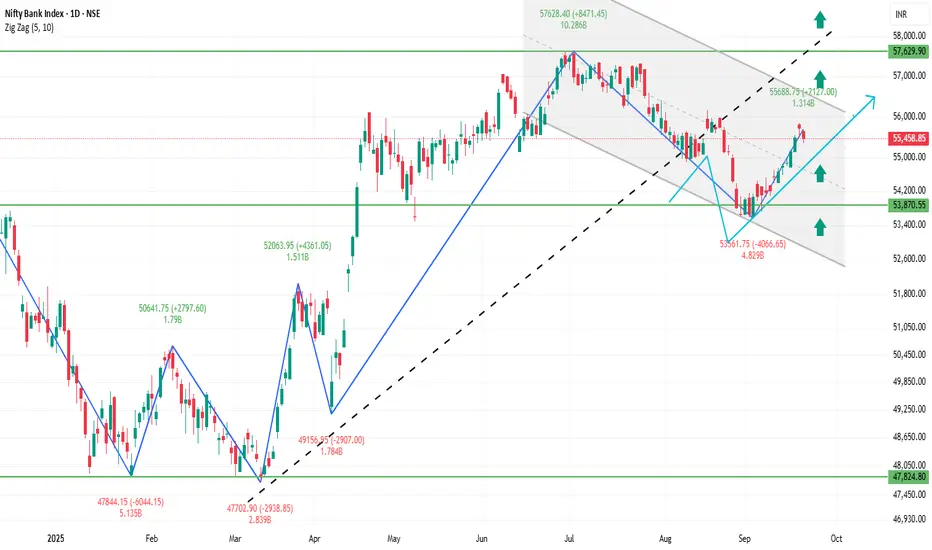
BANKNIFTY 1D Time frameCurrent Trend: BANKNIFTY is showing consolidation with mild bullish bias.
Support Zone: Strong support lies near 55,200 – 55,400. If this holds, buyers may remain active.
Resistance Zone: Key resistance is around 55,800 – 56,000. A breakout above this can bring strong momentum.
Indicators: Daily structure is stable; candles show demand near support zones.
Outlook:
Above 56,000 → fresh rally possible.
Below 55,200 → weakness can extend.
👉 In short:
Sideways to bullish.
Strength above 56,000, weakness below 55,200.
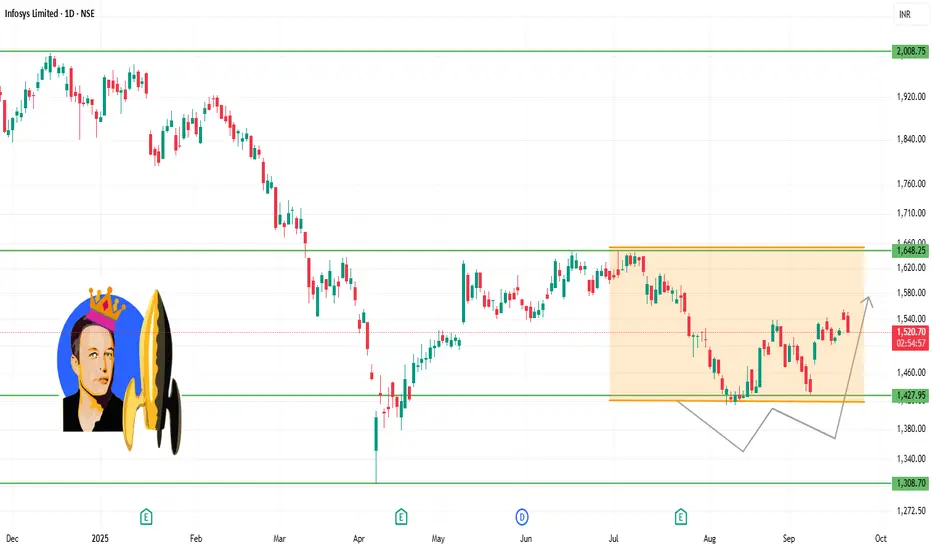
INFY 1D Time frameCurrent Facts
INFY is trading around ₹1,525-₹1,530.
Recent high / resistance being tested around ₹1,540-₹1,550.
The stock has a 52-week low around ₹1,307 and a high near ₹2,006.
Technical momentum is neutral to mildly bullish. Indicators like MACD are positive but RSI is not yet overbought.
🔍 Key Support & Resistance Levels
Immediate Support: ~ ₹1,500-₹1,510 — this is the level to watch closely. If INFY remains above this, it helps maintain bullish bias.
Secondary Support: ~ ₹1,470-₹1,490, in case the nearer support fails.
Immediate Resistance: ~ ₹1,540-₹1,550 — price is facing supply pressure here.
Stronger Resistance: ~ ₹1,560-₹1,570 if INFY manages to break above the nearer resistance.
⚙️ Interpretation & Outlook
As long as INFY stays above the ~₹1,500 support, bulls have a chance to push toward resistance.
Selling pressure is visible near the resistance zone; repeated failures at that zone could lead to consolidation or a pullback.
If INFY breaks above ₹1,550 with strong volume, the upside may extend toward ~₹1,560-₹1,570 and beyond.
⚠️ Risk Points
Breakdown below ₹1,500 may drag INFY toward the ~₹1,470-₹1,490 support.
If that too fails, deeper weakness may set in, possibly toward lower zones depending on market sentiment.
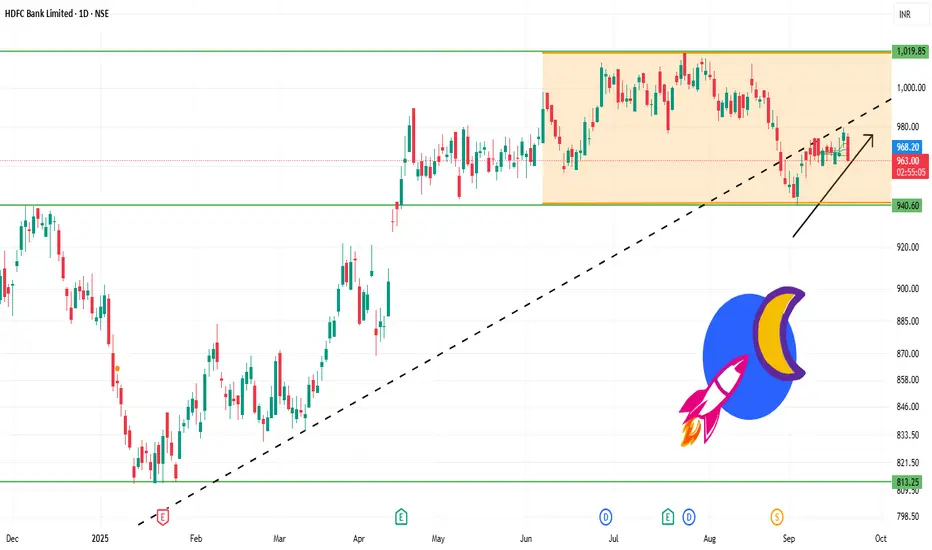
HDFCBANK 1D Time frameTrend
Trading around ₹967 – ₹970.
Stock is in a consolidation phase for the past few months.
Long-term trend is intact since it is above the 200-day moving average.
Support Levels
₹960 – ₹965 → immediate support zone.
₹945 – ₹950 → stronger support; if this breaks, stock may weaken further.
Resistance Levels
₹970 – ₹975 → immediate resistance; stock is struggling to cross this area.
₹980 – ₹992 → next major resistance; breakout above this could open path to ₹1,020.
Indicators
RSI near 55 → neutral to mildly bullish, not overbought.
MACD positive, showing some upward momentum.
Short-term moving averages are mixed, but long-term support remains strong.
Price Action
Range-bound between ₹960 – ₹975.
Breakout or breakdown from this range will decide the next trend.
✅ Facts & Insights
Fact 1: Above ₹975, HDFC Bank can rally towards ₹980 – ₹992 and possibly ₹1,020.
Fact 2: Below ₹960, stock may slip to ₹945 – ₹950, and deeper to ₹920 – ₹900 if weakness continues.
Fact 3: Long-term outlook remains positive, but short-term is sideways until a breakout.
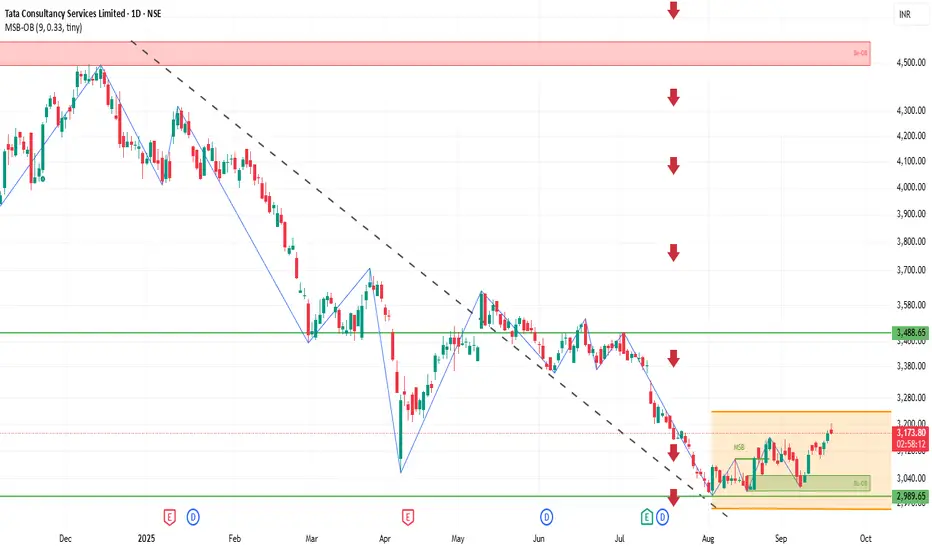
TCS 1D Time frameCurrent Snapshot
Price: ₹3,174
Stock has moved above earlier resistance zones (₹3,150 – ₹3,170).
Momentum looks positive, buyers are holding strength.
📌 Key Levels
Immediate Resistance: ₹3,190 – ₹3,200
Next Resistance: ₹3,220 – ₹3,250
Immediate Support: ₹3,150 – ₹3,160
Stronger Support: ₹3,100 – ₹3,120
✅ Outlook
If TCS sustains above ₹3,170, it can extend the rally toward ₹3,200 – ₹3,220.
If it slips back below ₹3,160, consolidation may happen around ₹3,120 – ₹3,150.
Larger trend remains bullish as long as price stays above ₹3,100.
INFY 1D Time frameCurrent Snapshot
Price is trading near ₹1,545.
Stock is holding above the 50-day moving average, showing underlying strength.
Near medium-term averages (100-day and 200-day), so trend is stable with mild bullish bias.
⚙️ Indicators / Momentum
RSI (14): Mid-to-high range, showing steady strength but not overbought yet.
MACD: Positive, suggesting upward momentum is intact.
Overall Momentum: Slightly bullish with chances of consolidation near resistance.
📌 Key Levels
Immediate Resistance: ₹1,550 – ₹1,560.
Immediate Support: ₹1,510 – ₹1,520.
Stronger Support: ₹1,450 – ₹1,480 zone if bigger pullback happens.
✅ Outlook
As long as the stock stays above ₹1,510, trend remains bullish.
Breakout above ₹1,560 could open further upside targets.
If price slips below ₹1,510, short-term weakness may pull it toward ₹1,450 – ₹1,480.

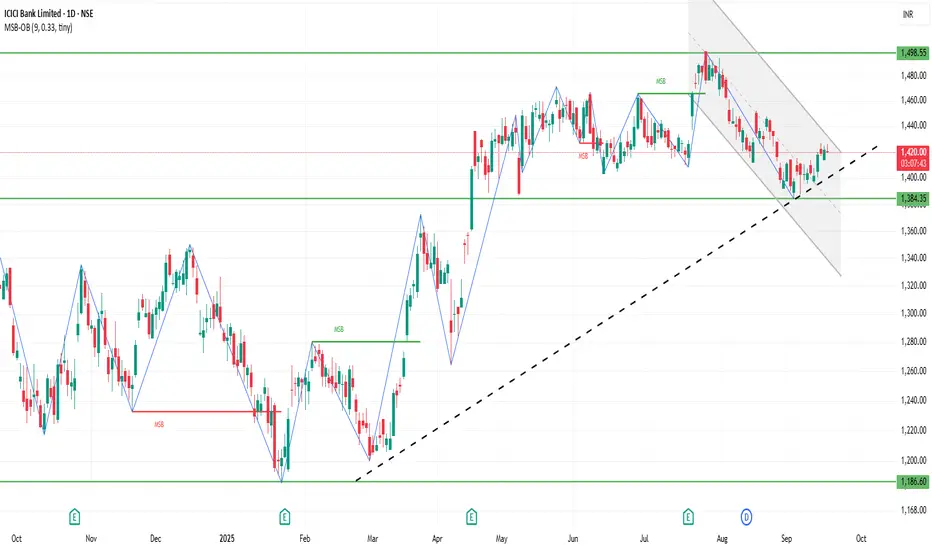
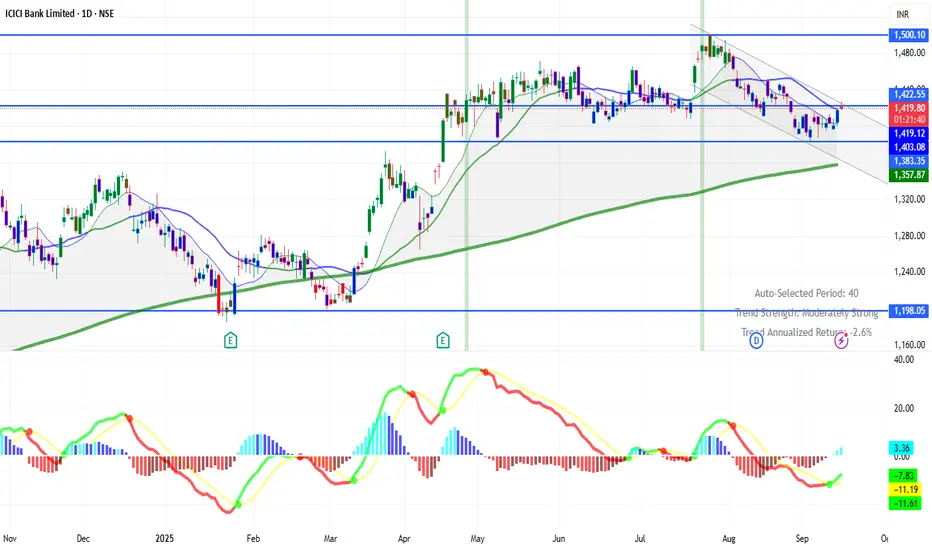
ICICIBANK 1D Time frameCurrent Snapshot
Price is around ₹1,402 – ₹1,420.
Stock is facing some short-term weakness, trading close to or slightly below short-term averages.
Longer-term trend is still stable as the price is well above its 200-day moving average.
⚙️ Indicators / Momentum
RSI (14): Neutral zone, not overbought or oversold.
MACD: Mixed, showing weak bearish pressure in the short term.
Moving Averages:
Short-term (5–10 day) → Mixed / sideways.
Medium-term (50–100 day) → Acting as resistance.
Long-term (200 day) → Still supportive, trend remains intact.
📌 Key Levels
Immediate Resistance: ₹1,440 – ₹1,450.
Immediate Support: ₹1,394 – ₹1,400.
Stronger Support: ₹1,340 – ₹1,350 zone.
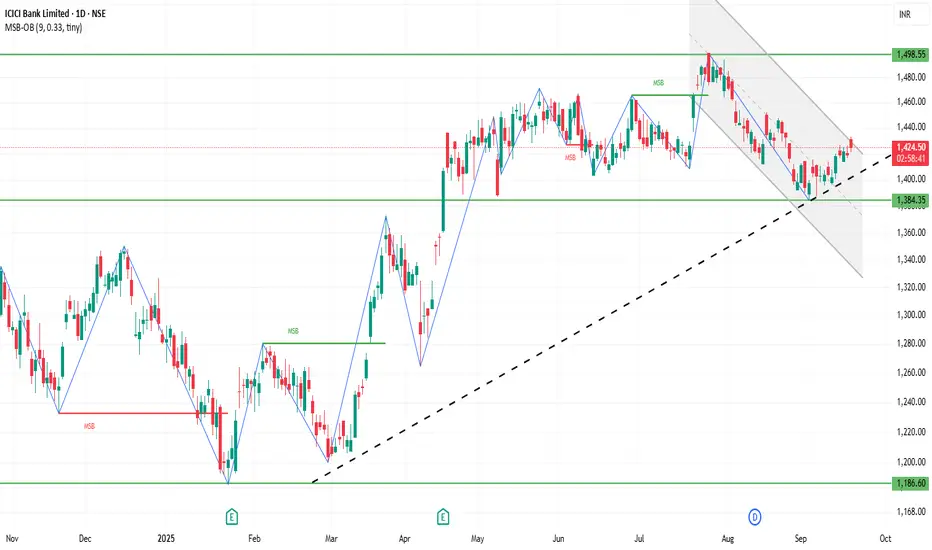
ICICIBANK 1D Time frameCurrent Stock Price
Current Price: ₹1,421.60
Day’s Range: ₹1,420.00 – ₹1,426.10
52-Week Range: ₹1,186.00 – ₹1,500.00
Market Cap: ₹10.17 lakh crore
P/E Ratio (TTM): 18.01
EPS (TTM): ₹74.05
Dividend Yield: 0.77%
Book Value: ₹436.67
📈 Trend & Outlook
Short-Term Trend: Bullish; the stock is trading near its 52-week high, indicating strong investor confidence.
Resistance Levels: ₹1,426.10 (day’s high), ₹1,500.00 (52-week high).
Support Levels: ₹1,420.00 (day’s low), ₹1,400.00 (psychological support).
Investor Sentiment: Positive, with strong institutional interest and favorable analyst outlooks.
🧭 Analyst Insights
Valuation: The stock is trading at a P/E ratio of 18.01, which is slightly below the sector average of 19.82, suggesting potential value.
Growth Prospects: The bank's strong earnings growth and robust capital position support its premium valuation.
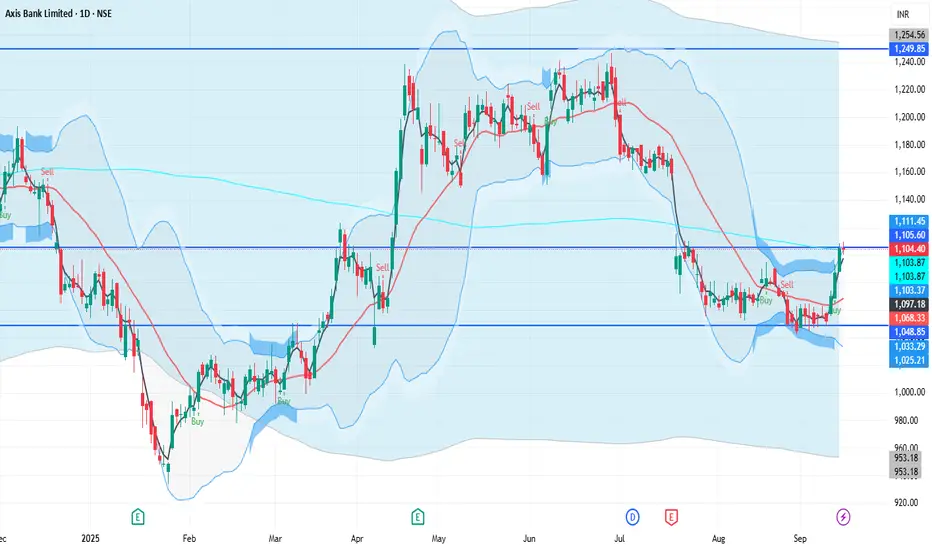
AXISBANK 1D Time frameUpdated Snapshot
Current Price: ₹1,105 – ₹1,107
Day’s Range: ₹1,101 – ₹1,110
Previous Close: ₹1,105.30
🔹 Support & Resistance
Support 1: ₹1,100 – ₹1,095
Support 2: ₹1,085 – ₹1,080
Resistance 1: ₹1,110 – ₹1,115
Resistance 2: ₹1,125 – ₹1,130
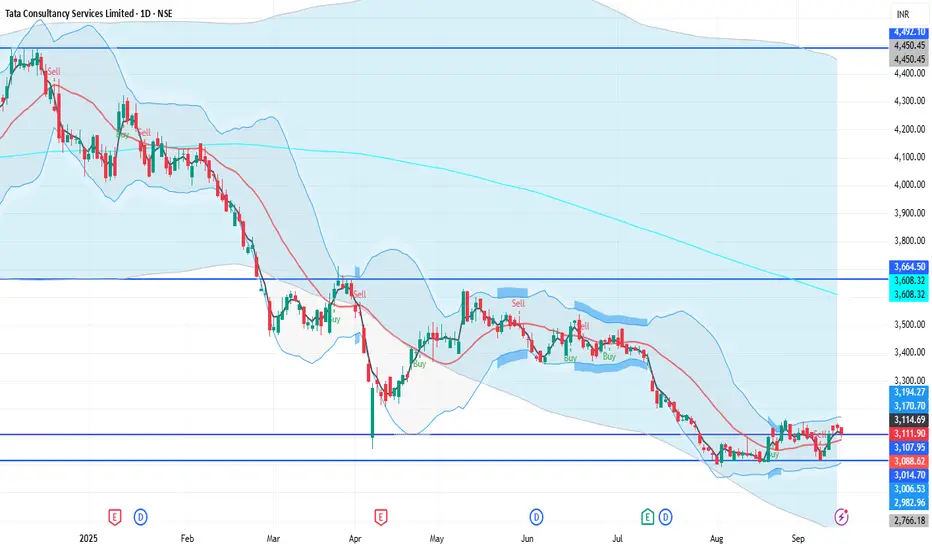
TCS 1D Time framePrice Action
Current Price: ₹3,111.60
Previous Close: ₹3,124.20
Day’s Range: ₹3,096 – ₹3,134
52-Week Range: ₹2,991.60 – ₹4,546.05
🔹 Support & Resistance
Support 1: ₹3,096
Support 2: ₹3,050 – ₹3,060
Resistance 1: ₹3,134
Resistance 2: ₹3,150 – ₹3,160
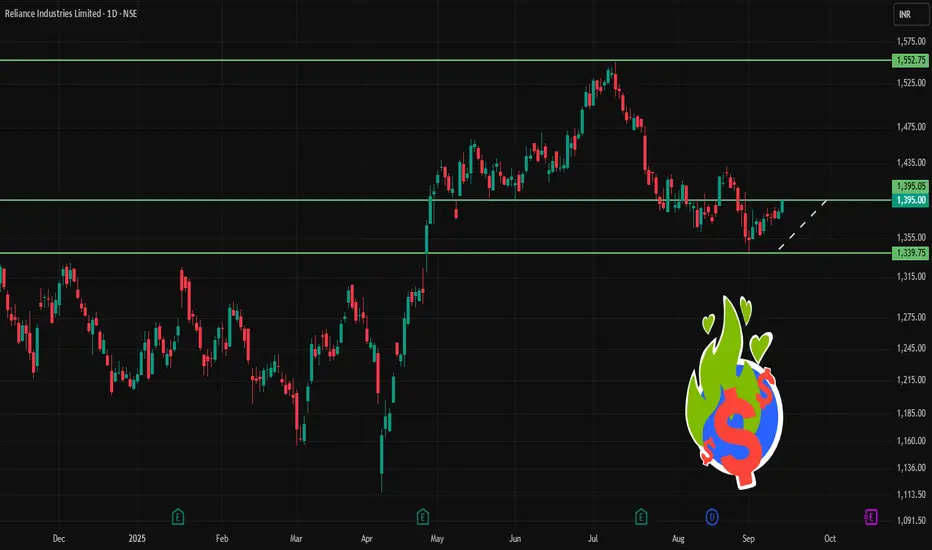
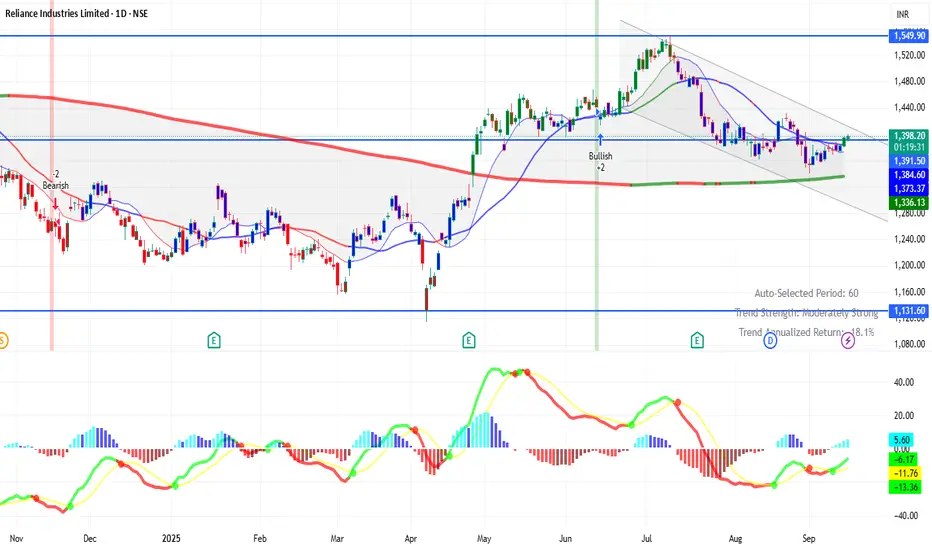
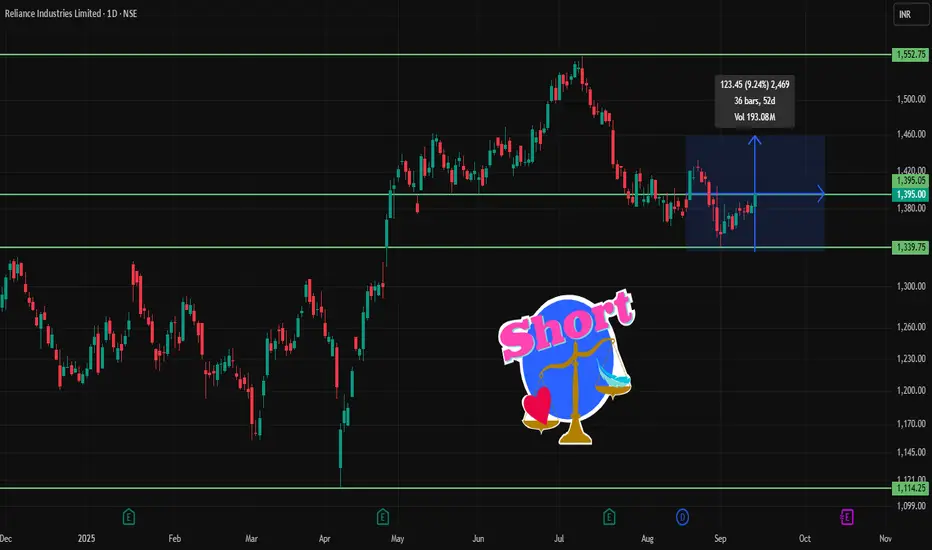
RELIANCE 1D Time framePrice Action
Current Price: ₹1,392 – ₹1,395 (approx)
Previous Close: ₹1,383.50
52-Week Range: ₹1,114.85 – ₹1,551.00
🔹 Support & Resistance
Immediate Support: ₹1,385 – ₹1,375
Next Support: ₹1,369
Immediate Resistance: ₹1,400 – ₹1,406
Next Resistance: ₹1,417
ICICIBANK 1D Time frameCurrent Price: ₹1,422 (approx)
Previous Close: ₹1,417.70
52-Week Range: ₹1,186 – ₹1,500
🔹 Support & Resistance (Daily)
Immediate Support: ₹1,390 – ₹1,392
Next Support: ₹1,360 – ₹1,365
Immediate Resistance: ₹1,407 – ₹1,415
Next Resistance: ₹1,416+
KOTAKBANK 1D Time frameCurrent Price: ₹1970.40 (approx)
Day Range: ₹1968 – ₹1981.60
Previous Close: ₹1972.30
🔹 Support & Resistance
Pivot: ₹1975.70
Resistance 1: ₹1983.40
Resistance 2: ₹1989.30
Resistance 3: ₹2002.90
Support 1: ₹1969.80
Support 2: ₹1962.10
Support 3: ₹1948.50

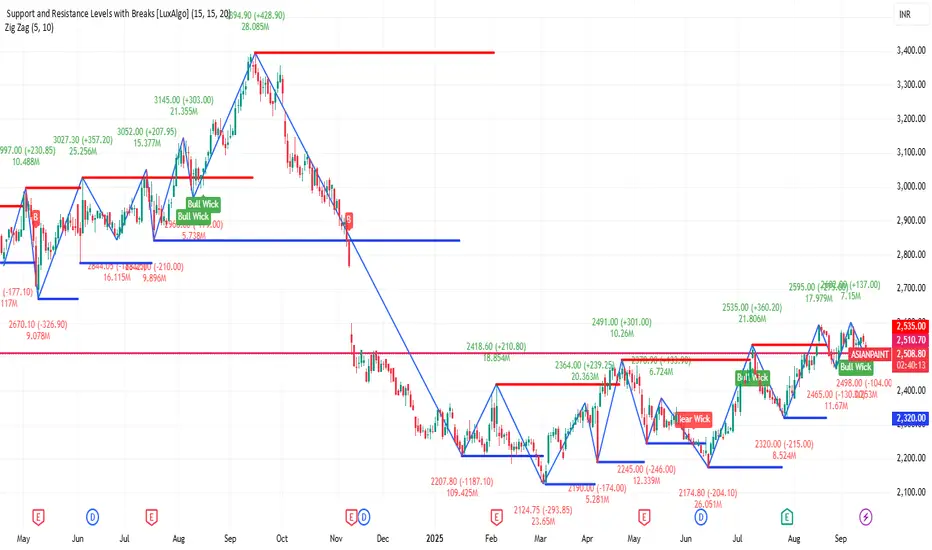
ASIANPAINT 1D Time frameToday's Trading Range:
Day's Range: ₹2,498.00 – ₹2,543.50
Opening Price: ₹2,535.10
Previous Close: ₹2,540.50
52-Week Range: ₹2,124.75 – ₹3,394.90
📈 Circuit Limits:
Upper Circuit Limit: ₹2,800.90
Lower Circuit Limit: ₹2,291.70
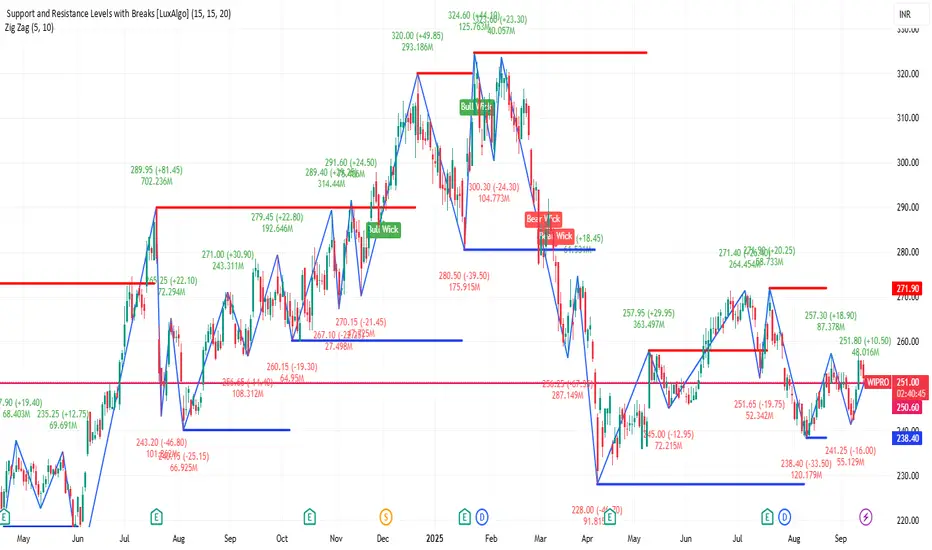
WIPRO 1D Time frameCurrent Price
₹251.50
🔹 Market Snapshot
Day’s Range: ₹249.60 – ₹251.79
Previous Close: ₹251.94
52-Week Range: ₹228.00 – ₹324.60
Market Cap: ₹2.64 lakh crore
P/E Ratio (TTM): 19.53
P/B Ratio: 3.20
Dividend Yield: 2.39%
Book Value per Share: ₹78.57
EPS (TTM): ₹12.84
RELIANCE 1D Time frameCurrent Price & Trend
Trading around ₹1,395
Price is below many of its short- to medium-term moving averages (50-day, 100-day), suggesting resistance in that zone.
Indicators & Momentum
Relative Strength Index (RSI) is in mid-range → neither overbought nor oversold, leaning neutral.
MACD is weak to mildly bearish in daily view.
Volume has shown mixed behaviour; resistance zones are not being convincingly broken.
Trend strength indicators show some weakening or caution among buyers.
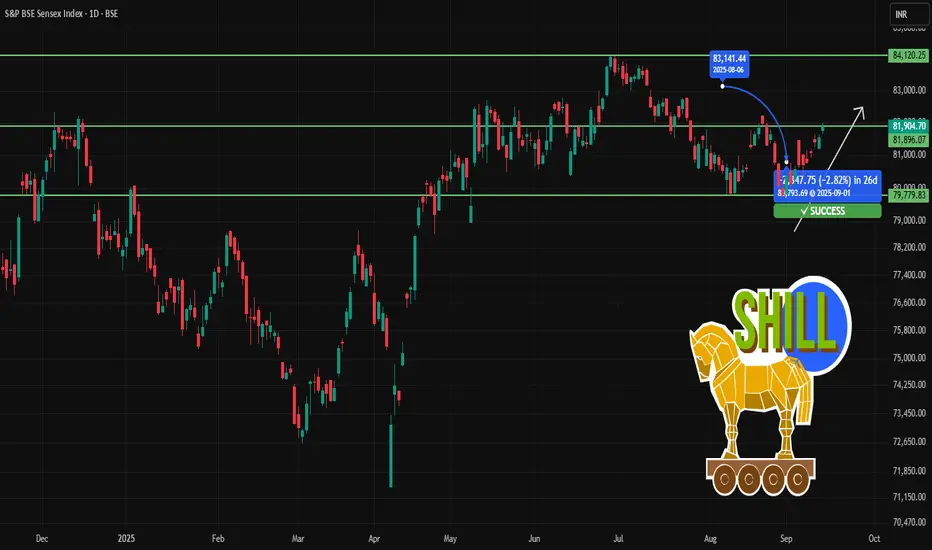
SENSEX 1D Time frameCurrent Price & Trend
Current Level: 81,904
Trend: Neutral to bullish — trading near the upper part of its 52-week range (71,425 – 85,978).
Momentum: Stable; holding above key supports.
Bullish Scenario
If Sensex holds above ~ 81,900 and breaks past ~ 82,200 with conviction, upside toward 82,400-82,600 looks possible
Sustained strength and positive sentiment (especially from financials, tech etc.) can drive moves higher.
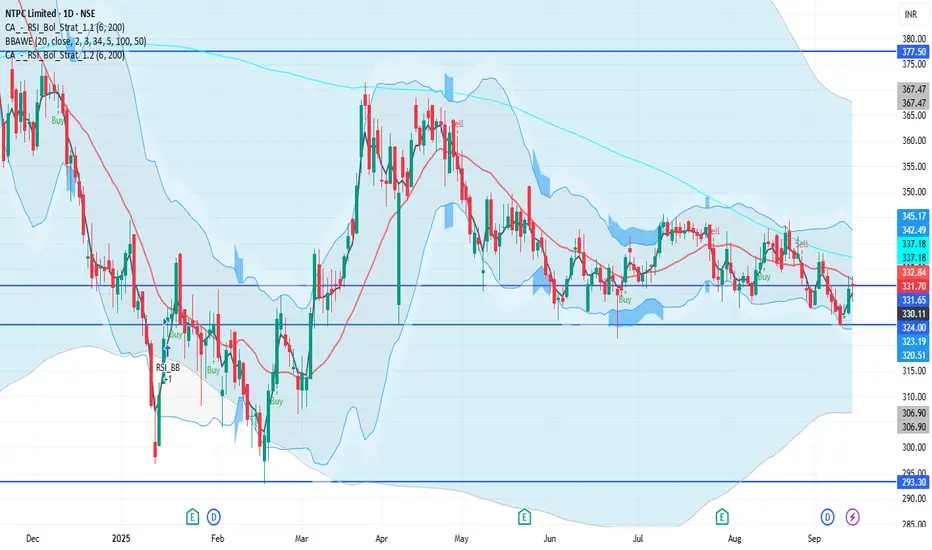
NTPC 1D Time frameCurrent Price & Trend
Price: ₹331.75
Trend: Neutral; trading approximately 26% below its 52-week high of ₹448.30, achieved on September 30, 2024.
Momentum: Indicators suggest a neutral to slightly bullish outlook.
Bullish Scenario
Breakout Above ₹340: A sustained move above ₹340 could target ₹345 – ₹350 in the short term.
KOTAKBANK 1D Time frameCurrent Price & Trend
Price: ₹1,972.30
Trend: Neutral; trading approximately 14.3% below its 52-week high of ₹2,301.90, reached on April 22, 2025.
Momentum: Indicators suggest a neutral to slightly bearish outlook.
Bullish Scenario
Breakout Above ₹1,990: A sustained move above ₹1,990 could target ₹2,000 – ₹2,020 in the short term.

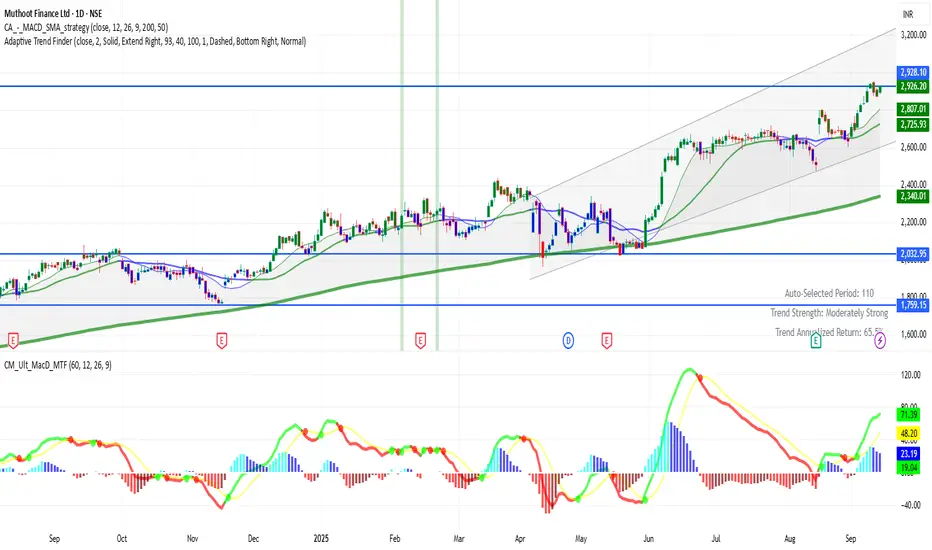
MUTHOOTFIN 1D Time framePrice is about ₹2,926
It's near its 52-week high region.
Price is trading well above most of its longer moving averages (50-day, 100-day, 200-day).
Bullish Scenario
Holding above ~ ₹2,900 is key. If that holds and price pushes past ~ ₹3,000, there’s potential to move up toward ~ ₹3,100-₹3,150.
Strength in broader market & favorable sector sentiment (gold prices, NBFC performance) would help.
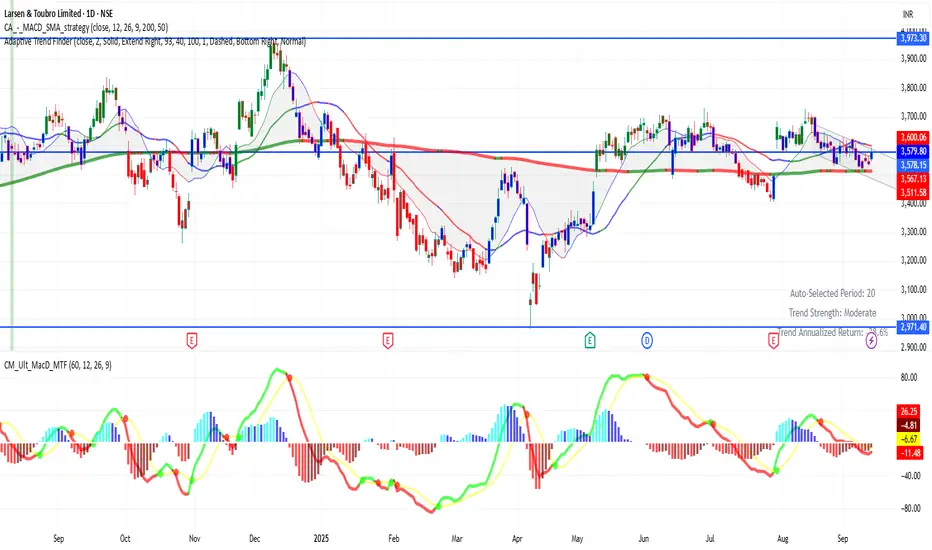
LT 1D Time frame LT — Daily (1D) Time Frame
Current Price: ₹3,579
Key Levels
Immediate Support: ₹3,540
Strong Support: ₹3,400
Immediate Resistance: ₹3,600
Major Resistance: ₹3,900
RELIANCE 1D Time frameClosing Price: ₹1,395.00
Day's Range: ₹1,380.50 – ₹1,396.30
52-Week High: ₹1,551.00
52-Week Low: ₹1,114.85
Market Cap: ₹18,87,780 crore
P/E Ratio (TTM): 25.30
Dividend Yield: 0.85%
Book Value: ₹1,100.00
EPS (TTM): ₹55.00
Face Value: ₹10.00
Volume: 7.4 million shares
VWAP: ₹1,388.40