BAJFINANCE : AT A GOOD SWING
Timeframe: Daily
Current Spot Price: ~₹949
Trend Context: Primary uptrend intact | Ongoing corrective phase
🔍 Technical Structure Overview
Bajaj Finance has completed a corrective ABC structure, where:
Wave (a) initiated the correction,
Wave (b) retraced upward,
Wave (c) is nearing completion near a high-probability demand zone.
The ABC completion zone (₹934–₹945) coincides with:
Rising trendline support
Prior structure demand
Short-term mean reversion support (7-SMA)
This confluence increases the probability of a trend resumption bounce rather than a breakdown.
🟩 Swing Trade – Buying Strategy (Cash / Futures)
✅ Buy Zone (Accumulation Range):
₹945 – ₹935 (staggered buying preferred)
🎯 Swing Targets:
Target 1: ₹981
Target 2: ₹1,020
Extended Target: ₹1,066 (only if momentum sustains)
🛑 Stop Loss (Strict):
₹903 (Daily candle close basis)
Risk–reward remains favorable as long as price holds above the ABC completion zone and trendline support.
🟨 Options Trade Strategy – January Expiry
📌 Directional Bias: Moderately Bullish (Buy on Dip)
▶️ Call Buying Setup
Buy: 960 CE or 980 CE (January Expiry)
Ideal Entry: When spot sustains above ₹950–₹955 after pullback confirmation
🎯 Option Targets:
On move towards ₹981–₹1,020 in spot, expect healthy premium expansion
🛑 Option Stop Loss:
Spot-based SL: Hourly close below ₹931
OR 40–45% premium SL, whichever is hit earlier
Avoid aggressive OTM calls; prefer ATM or slightly ITM strikes for better theta and delta balance.
⚠️ Risk Management Notes
If price fails to hold ₹931 on an hourly closing basis, the bullish structure weakens.
A daily close below ₹903 invalidates the swing setup and may open deeper correction.
Position sizing should be conservative due to January expiry volatility.
📌 Summary View
Bias: Buy on dips near demand
Structure: ABC correction nearing completion
Edge: Trendline + demand zone confluence
Best Approach: Staggered swing buying + disciplined option positioning
⚠️ Disclaimer
This analysis is for educational purposes only. I am not a SEBI-registered analyst. Traders should manage risk responsibly and consult their financial advisor before taking positions.
Bajajfinance

Bajaj finance Yellow support line has been breached, and there's no other support until 892 level, so there's a high possibility it could fall to 892 or to the white horizontal ray marked on the chart .
Disclaimer :
It's a personal view not a financial advice and I assume no responsibility and liability whatever outcome arises.

Bajaj Finance cmp 990.45 by Daily Chart viewBajaj Finance cmp 990.45 by Daily Chart view
- Support Zone 955 to 980 Price Band
- Resistance Zone 1005 to 1030 Price Band
- Bearish Head & Shoulders by neckline just above Support Zone
- IF ..... Support Zone brake then basis Bearish H&S downfall expected
- Support Zone tested, hoping it sustains, expect upside reversal by past data

#Bajaj Finance Limited - BUY - Technical Analysis#Bajaj Finance Limited - #Technical Analysis
Price: 1,048.00
#Swing Trading Setup
Pattern: #Range #breakout with #consolidation above breakout zone. #Triangle/Box pattern breakout with target hit. Currently forming double bottom pattern.
Key Technical Points:
1. Range breakout & consolidating above breakout area
2. EMA's sorted & aligned - price trading above all EMAs
3. Triangle/Box pattern breakout - target achieved, now forming double bottom
4. Classic divergence in recent bounce area confirming retracement completion
Target Levels:
- Target 1: 1,103.80
- Swing Target 2: 1,155.00
- Grand Target: 1,225.00
Support: 1,026 - 1,018 (critical zone)
#Outlook
Strong bullish structure with potential upside of 10-17% toward targets. The double bottom formation suggests the retracement phase is complete. Price sustaining above ₹1,048 confirms continuation toward higher targets.
⚠️ DISCLAIMER
This is NOT investment advice. For educational purposes only. Stock trading involves substantial risk. Past performance doesn't guarantee future results. Always do your own research and consult a SEBI-registered financial advisor before investing. Author assumes no responsibility for losses.
#BajajFinance #StockMarket #NSE #TechnicalAnalysis #SwingTrading #IndianStockMarket #Trading #FinTwit #ChartAnalysis #StocksToWatch #TradingView #MarketAnalysis

Bajaj Finance Approaching Potential Cup & HandleBajaj Finance is approaching a key trendline support after a strong advance, and price action is attempting to carve out a larger cup and handle structure on the daily chart. The left side of the chart highlights how price has respected the rising trendline multiple times, making this zone crucial for the handle pullback and potential next impulse leg.
On the right, the 1050 call option for 30 Dec 2025 reflects this developing pattern, with a sharp bounce and nearly 23% move from recent lows, showing early option participation in the anticipated breakout. The idea is to track whether spot continues to respect the trendline and form a higher low, which could complete the handle and open up a higher‑timeframe breakout opportunity for both the stock and its options.

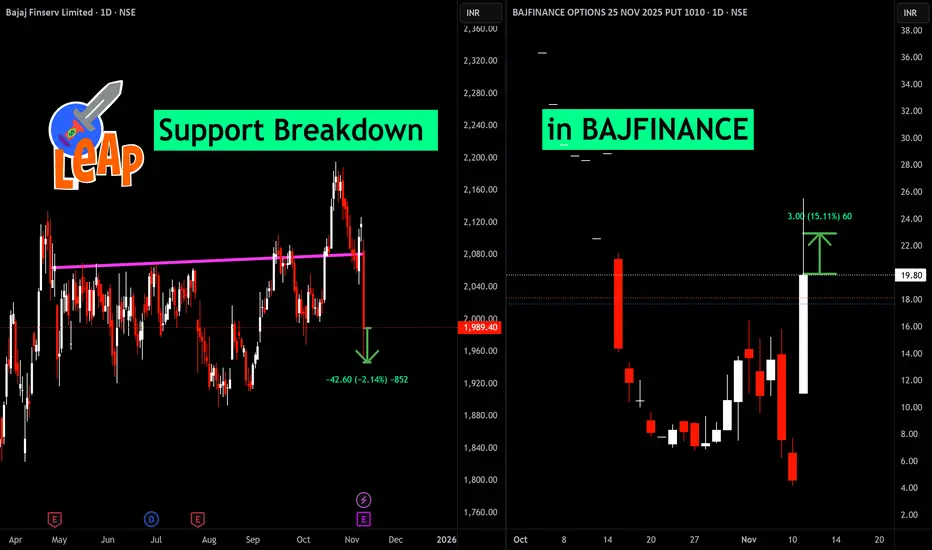
Support Breakdown in BAJFINANCEBajaj Finserv broke key support, triggering a sharp 2% drop and bearish momentum. This led to a strong move in Bajaj Finance PUT options, which surged 15%, reflecting aggressive downside hedging and trading interest. Watch for further volatility and trading opportunities following this breakdown
BAJAJFINANCE F&P BREAKOUTBajajfinance breaking flag&pole pattern
good volume building up last few days
rsi above 60, trading at ATH
SL 970 ,Target 1130 on pivot level
NO BUY/SELL RECOMENDATION

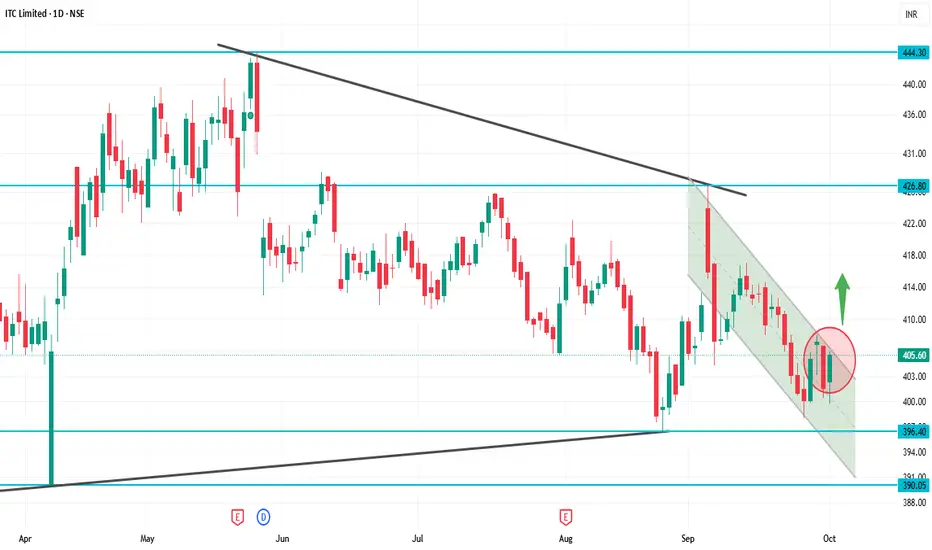
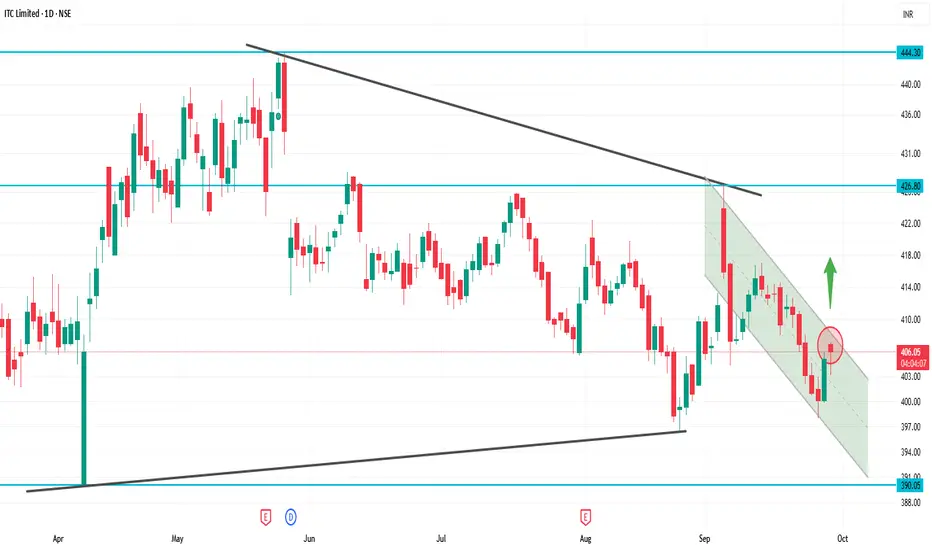
ITC 1D Time frameCurrent Price: ₹405.60
52-Week High: ₹524.35
52-Week Low: ₹390.15
Trend: Downward — trading below 5, 20, 50, 100, 200-day moving averages
Daily Chart Insights
Price below moving averages → bearish trend.
RSI & MACD → weak momentum, signaling short-term selling pressure.
Support zone at ₹390–₹400 → critical; a break below can push price down to ₹370–₹380.
Resistance at ₹420–₹430 → a strong close above may signal trend reversal.
Strategy / Outlook
Bearish Bias: Short-term trend is downward.
Buying Opportunity: Near support zones (₹390–₹400) if it holds.
Bullish Trigger: Close above ₹430 with strong volume indicates potential reversal.
Risk Management: Use stop-loss below critical support zones.
SBIN 1D Time frameCurrent Price (approx): ₹864
52-Week Low: ₹680
52-Week High: ₹880.50
Daily Chart Explanation
On the 1-day timeframe, SBIN is moving near its upper range, close to the recent high. This means the stock is strong but also facing heavy resistance.
Trend: Uptrend overall (higher highs and higher lows).
Momentum: Price is consolidating near resistance, showing hesitation.
Candles: Recent candles show wicks near the top, which means sellers are active near ₹880.

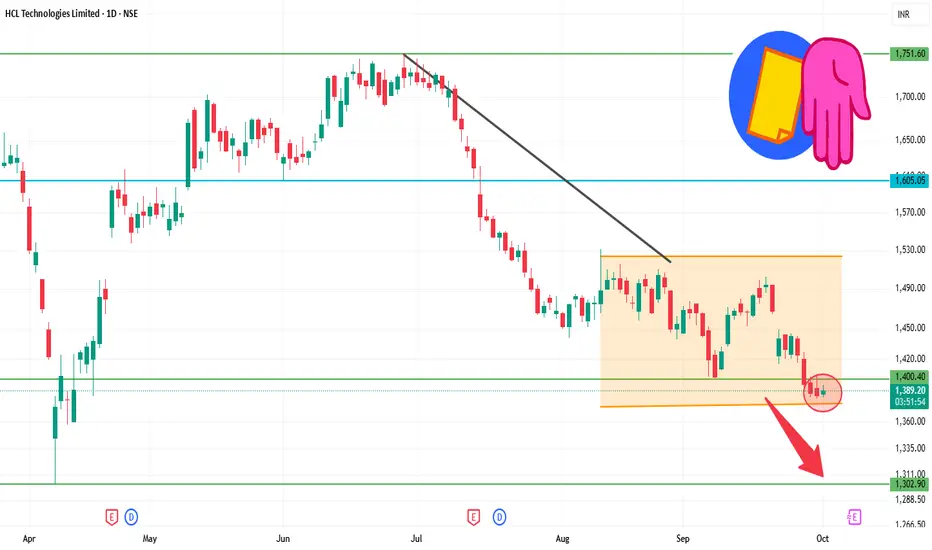
HCLTECH 1D Time frameOpening Price: ₹1,387.40
Closing Price: ₹1,387.40
Day Range: ₹1,383.10 – ₹1,395.00
Previous Close: ₹1,387.40
📉 Trend Analysis
Short-Term Trend: Bearish — The stock is trading below key moving averages, confirming the bearish trend.
Medium-Term Trend: Neutral — The stock is in a consolidation phase, characterized by lower highs and lower lows.
Long-Term Trend: Neutral — No significant trend identified; the stock is trading within a range.
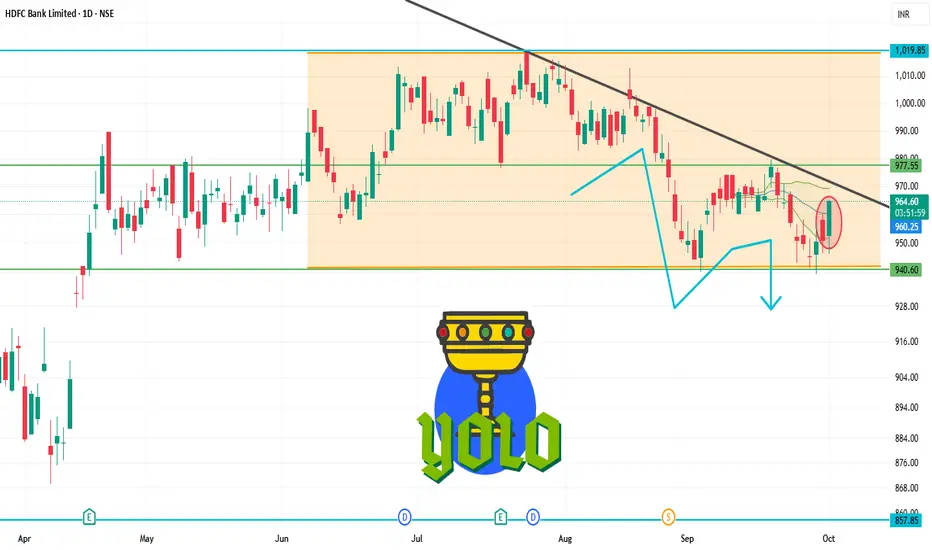
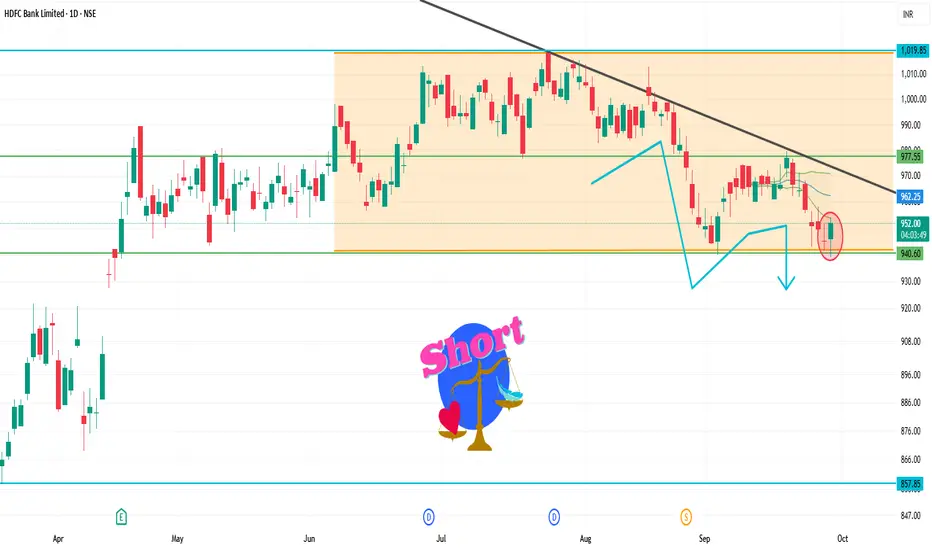
HDFCBANK 1D Time frameOpening Price: ₹950.30
Closing Price: ₹960.45
Day Range: ₹946.00 – ₹961.40
Previous Close: ₹950.30
🧠 Price Action Insights
The stock is trading below key moving averages, confirming the bearish trend.
No significant reversal pattern has formed, suggesting the downtrend may continue.
Watch for a breakout above ₹970.00 for a potential trend reversal.
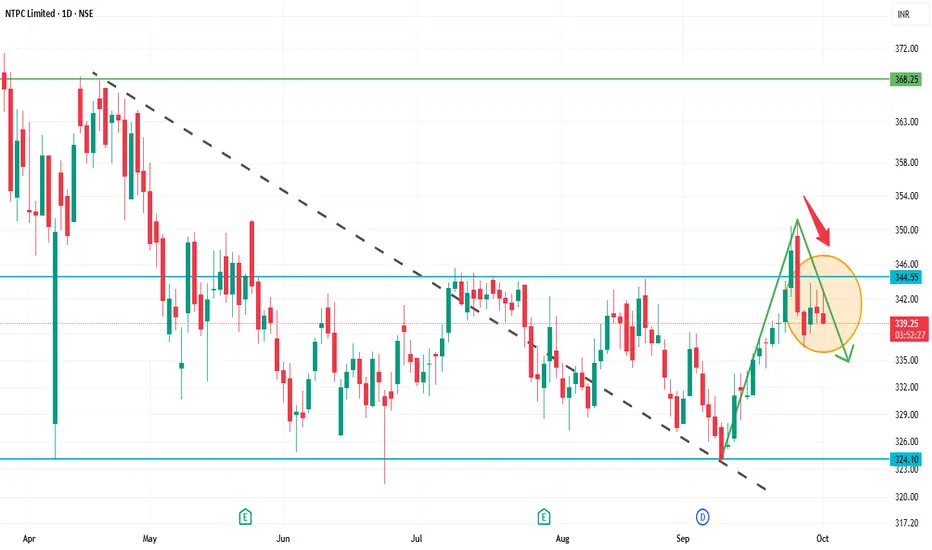
NTPC 1D Time frameOpening Price: ₹340.30
Closing Price: ₹340.25
Day Range: ₹339.45 – ₹343.05
📉 Trend Analysis
Short-Term Trend: Bearish — The stock is trading below key moving averages, confirming the bearish trend.
Medium-Term Trend: Neutral — The stock is in a consolidation phase, characterized by lower highs and lower lows.
Long-Term Trend: Neutral — No significant trend identified; the stock is trading within a range.
🔮 Conclusion
NTPC Ltd. is in a bearish trend with weak momentum.
Break below ₹335.00 could lead to further decline toward ₹330.00.
Break above ₹347.00 would indicate a potential trend reversal.
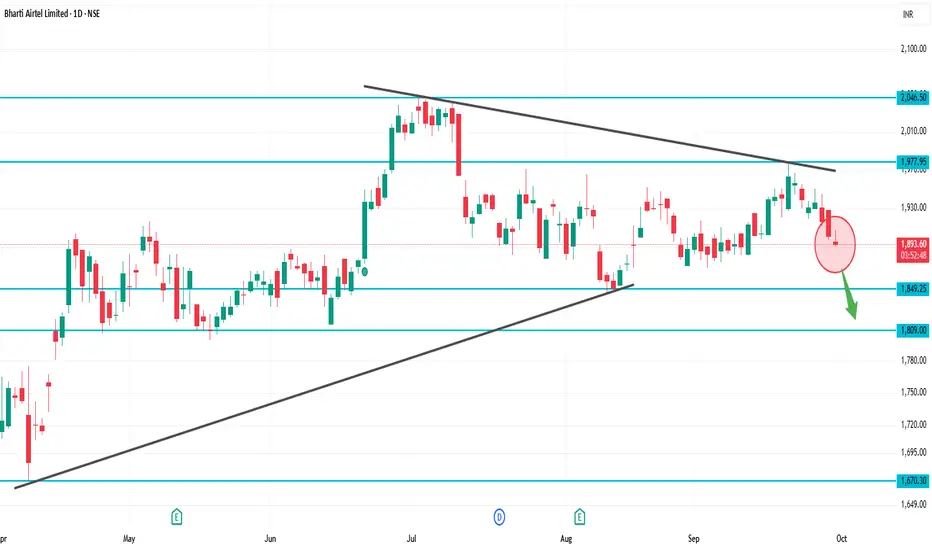
BHARTIARTL 1D Time frameCurrent Price Snapshot
Current Price: ₹1,897.80
Day’s Range: ₹1,890.80 – ₹1,907.60
52-Week Range: ₹1,511.00 – ₹2,045.80
Technical Indicators
RSI (14-day): 44.19 — indicates a neutral to slightly bearish momentum.
MACD: -4.010 — suggests bearish momentum.
Moving Averages:
5-day: ₹1,896.00 — indicates a Sell signal.
50-day: ₹1,890.00 — indicates a Sell signal.
200-day: ₹1,850.00 — indicates a Buy signal.
Technical Summary: Predominantly Sell signals across various indicators.
Summary
Above ₹1,907.60: Potential rise toward ₹1,920 – ₹1,940.
Below ₹1,890.80: Potential fall toward ₹1,880 – ₹1,860.
Between ₹1,860 – ₹1,900: Likely range-bound movement.
KOTAKBANK 1D Time frameCurrent Price Snapshot
Current Price: ₹1,991.60
Day’s Range: ₹1,990.50 – ₹2,015.00
52-Week Range: ₹1,679.05 – ₹2,301.90
Technical Indicators
RSI (14-day): 46.61 — indicates a neutral momentum.
MACD: -7.62 — suggests bearish momentum.
Moving Averages: Mixed signals — short-term averages are bearish, while long-term averages are bullish.
Technical Summary: Predominantly Sell signals across various indicators.
Summary
Above ₹2,015: Potential rise toward ₹2,050 – ₹2,100.
Below ₹1,990: Potential fall toward ₹1,950 – ₹1,900.
Between ₹1,950 – ₹2,010: Likely range-bound movement.

BAJFINANCE 1D Time frameCurrent Price Snapshot
Current Price: ₹999.00
Day’s Range: ₹989.45 – ₹1,002.30
52-Week Range: ₹645.10 – ₹1,036.00
Technical Indicators
RSI (14-day): 59.37 — indicates a neutral to slightly bullish momentum.
MACD: -4.010 — suggests bearish momentum.
Moving Averages: Mixed signals — short-term averages are bearish, while long-term averages are bullish.
Technical Summary: Predominantly Buy signals across various indicators.
Summary
Above ₹1,002.30: Potential rise toward ₹1,020 – ₹1,030.
Below ₹989.45: Potential fall toward ₹980 – ₹970.
Between ₹980 – ₹1,010: Likely range-bound movement.
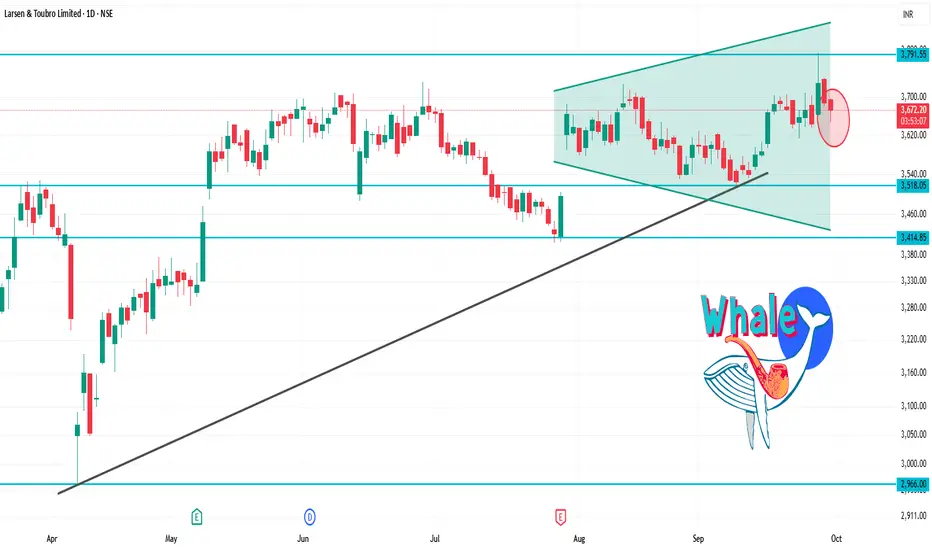
LT 1D Time frameCurrent Price: ₹3,655.30
Day’s Range: ₹3,648.00 – ₹3,696.60
52-Week Range: ₹2,965.30 – ₹3,963.50
Technical Indicators
RSI (14-day): 41.19 — indicates a neutral to slightly bearish momentum.
MACD: -1.47 — suggests bearish momentum.
Moving Averages: Mixed signals — short-term averages are bearish, while long-term averages are bullish.
Technical Summary: Predominantly Sell signals across various indicators.
HDFCBANK 1D Time frameCurrent Market Snapshot
Current Price: ₹954.05
Opening Price: ₹945.10
Day's Range: ₹939.10 – ₹953.00
Previous Close: ₹945.05
🔑 Technical Indicators
Relative Strength Index (RSI): 35.08 – indicating a neutral to bearish condition.
Moving Average Convergence Divergence (MACD): -6.02 – suggesting bearish momentum.
Moving Averages: Trading below the 50-day and 200-day moving averages, indicating a bearish trend.
📈 Key Support & Resistance Levels
Immediate Support: ₹939
Immediate Resistance: ₹953
Pivot Point: ₹946
📉 Market Sentiment
Trend: The stock is trading below its 50-day and 200-day moving averages, indicating a bearish trend.
Volume: Trading volume is higher than average, suggesting increased investor activity.
📈 Strategy (1D Timeframe)
1. Bullish Scenario
Entry: Above ₹953
Stop-Loss: ₹939
Target: ₹960 → ₹965
2. Bearish Scenario
Entry: Below ₹939
Stop-Loss: ₹953
Target: ₹930 → ₹925
⚠️ Risk Management
Limit risk to 1% of capital per trade.
Always use stop-loss to protect against unexpected market movements.
Monitor broader market trends and sector-specific news that may impact stock performance.
SENSEX 1D Time frameOpening Level: ₹80,500
Current Level: ₹80,15.23
Day's Range: ₹80,300 – ₹80,800
🔑 Key Support & Resistance Levels
Immediate Support: ₹80,500
Immediate Resistance: ₹81,000
Pivot Point: ₹80,745.23
📊 Market Sentiment
Trend: The Sensex has experienced a six-day losing streak, indicating bearish momentum.
Reuters
Volume: Trading volume is significantly higher than its 20-day average, suggesting increased investor activity.
📈 Strategy (1D Timeframe)
1. Bullish Scenario
Entry: Above ₹81,000
Stop-Loss: ₹80,500
Target: ₹81,300 → ₹81,500
2. Bearish Scenario
Entry: Below ₹80,500
Stop-Loss: ₹81,000
Target: ₹80,200 → ₹80,000
⚠️ Risk Management
Limit risk to 1% of capital per trade.
Always use stop-loss to protect against unexpected market movements.
Monitor broader market trends and sector-specific news that may impact index performance.

ITCITC Daily Snapshot
Current Price: ~₹405
Day’s Range: ~₹401 – ₹406
🔍 Key Levels
Support: Around ₹399 – ₹401 (near-term buying zone)
Resistance: Around ₹409 – ₹412 (supply zone)
📈 Technical Picture
Trend: Slightly bearish to sideways, but stabilizing above ₹405 gives some strength
RSI (Daily): Neutral zone, neither overbought nor oversold
Moving Averages: Price is close to short-term averages, so a decisive breakout above ₹409 is needed for bullish confirmation
VWAP: Trading near VWAP, showing balance between buyers and sellers
✅ Summary
At ₹405, ITC is near the middle of its range.
If it holds above ₹405 and breaks ₹409–₹412, bullish momentum can pick up.
If it falls below ₹401, it may retest support near ₹398.
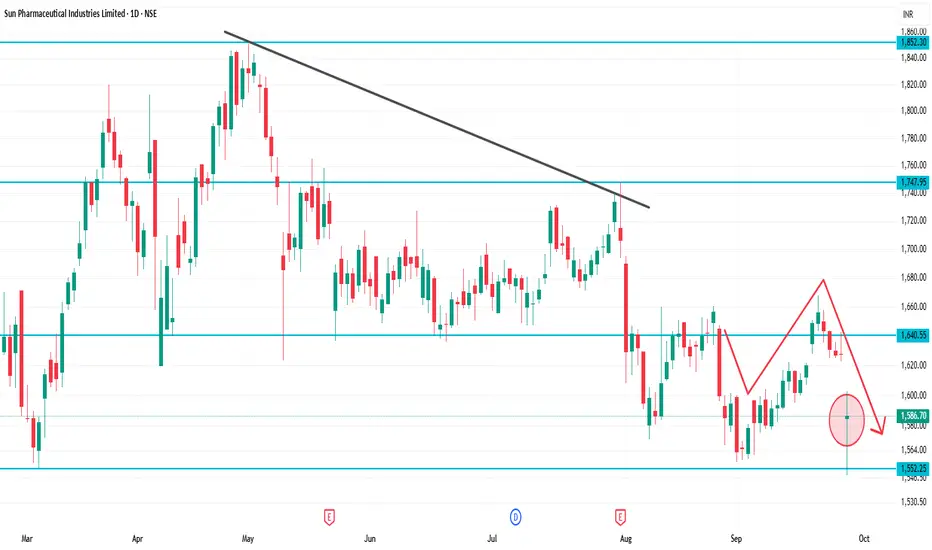
SUNPHARMA 1D Time frameCurrent Price: ~₹1,586
Day Range: ~₹1,582 – ₹1,600
52-Week High: ~₹1,960
52-Week Low: ~₹1,553
📈 Technical Outlook
Immediate Support: ₹1,580 (very close to current price)
Strong Support: ₹1,553 – ₹1,560 (52-week low zone)
Immediate Resistance: ₹1,600 – ₹1,620
Major Resistance: ₹1,650 – ₹1,670
Trend Bias:
Stock is weak, testing lower supports.
If it breaks below ₹1,580, then ₹1,553 may be tested.
A bounce is only possible if it sustains above ₹1,600.
📌 Step-by-Step Market View
Above 1,600: Chance for small recovery toward ₹1,620 – ₹1,650.
Stays between 1,580 – 1,600: Consolidation zone.
Breaks below 1,580: Weakness may extend to ₹1,553.
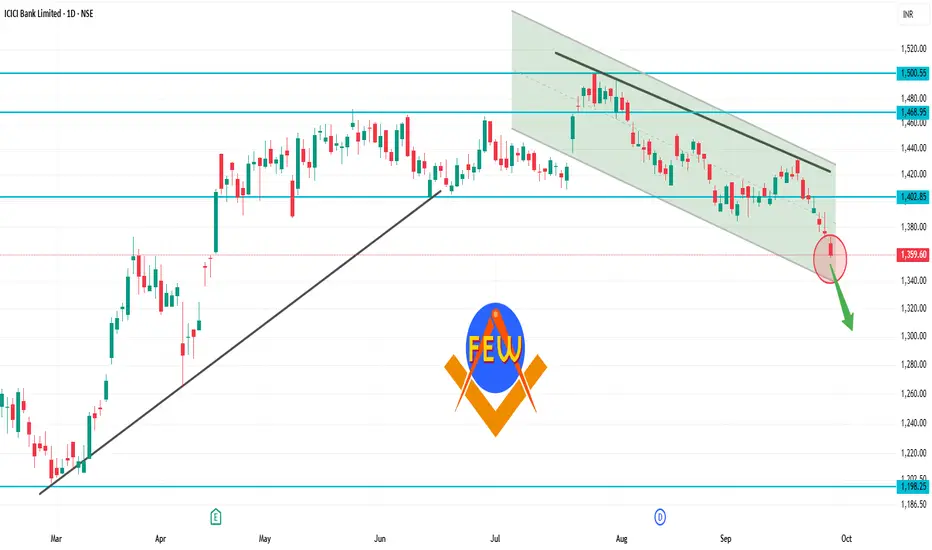
ICICIBANK 1D Time frameClosing Price: ₹1,363.00
Day's Range: ₹1,357.00 – ₹1,372.70
Previous Close: ₹1,375.80
Volume: 18,342,280 shares traded
Market Cap: ₹971,186 crore
52-Week High: ₹1,500.00
52-Week Low: ₹1,186.00
Face Value: ₹2.00
Beta: 0.90
🧾 Financial Highlights
P/E Ratio (TTM): 18.36
P/B Ratio: 3.12
EPS (TTM): ₹74.04
Dividend Yield: 0.81%
ROE: 17.05%
Book Value: ₹436.56
📈 Technical Insights
Trend: The stock is approaching its 200-day moving average, a key technical indicator. A bounce from this level could signal a buying opportunity, while a breakdown may suggest further downside risk.
Support Levels: ₹1,357.00, ₹1,350.00
Resistance Levels: ₹1,375.00, ₹1,400.00
📌 Key Takeaways
Recent Performance: ICICI Bank's stock declined by 0.91%, underperforming the broader market.
Analyst Sentiment: Despite recent volatility, ICICI Bank remains a top pick among analysts for long-term investment.
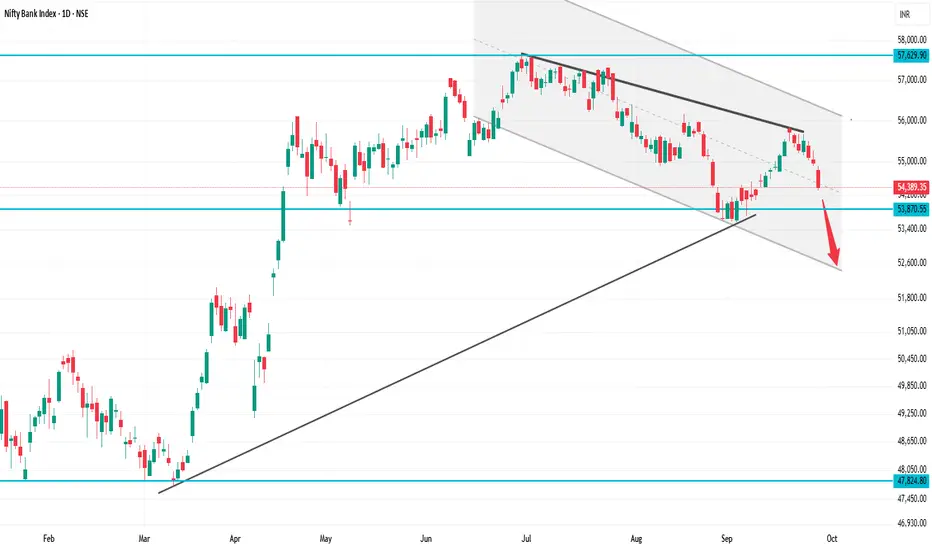
BANKNIFTY 1D Time frame
Previous Close: 55,121
Today Open: 55,061
Day’s High: 55,276
Day’s Low / Last: 54,389
⚡ Strategy
For Intraday / Short-Term Traders:
If BankNIFTY holds above 54,400 – 54,500, a small bounce toward 54,800 – 55,000 is possible.
If it fails to hold 54,400, expect more downside toward 54,000 – 53,800.
Bullish View (Only if recovery): Buy above 54,800 for targets 55,100 – 55,250, SL below 54,500.
Bearish View (Preferred): Sell on rise near 54,700 – 54,900 with SL above 55,000, targets 54,300 → 54,000.
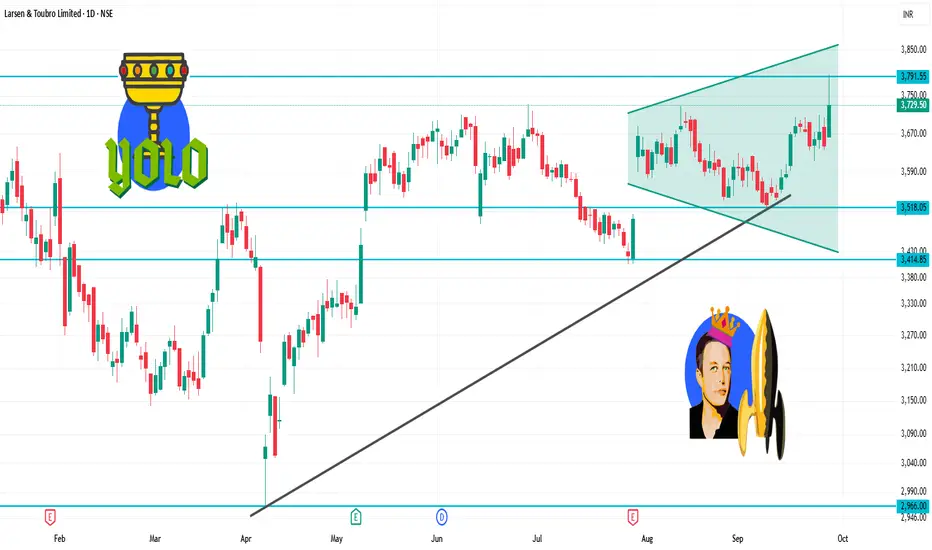
LT 1D Time framePrevious Close: ₹ 3,644
Today Open: ₹ 3,664
Day’s High: ₹ 3,795
Day’s Low: ₹ 3,661
Current / Last Traded Price: around ₹ 3,730
⚡ Strategy
Bullish Side:
Buy on dips near ₹ 3,700 – 3,720 with stop loss below ₹ 3,660. Target ₹ 3,760 → ₹ 3,795.
Bearish Side (Only if Weakness):
If price falls below ₹ 3,660, short opportunities may open toward ₹ 3,600.