BALKRISIND – Zone Based Price Action Setup________________________________________________________________________________
📈 BALKRISIND – Zone Based Price Action Setup
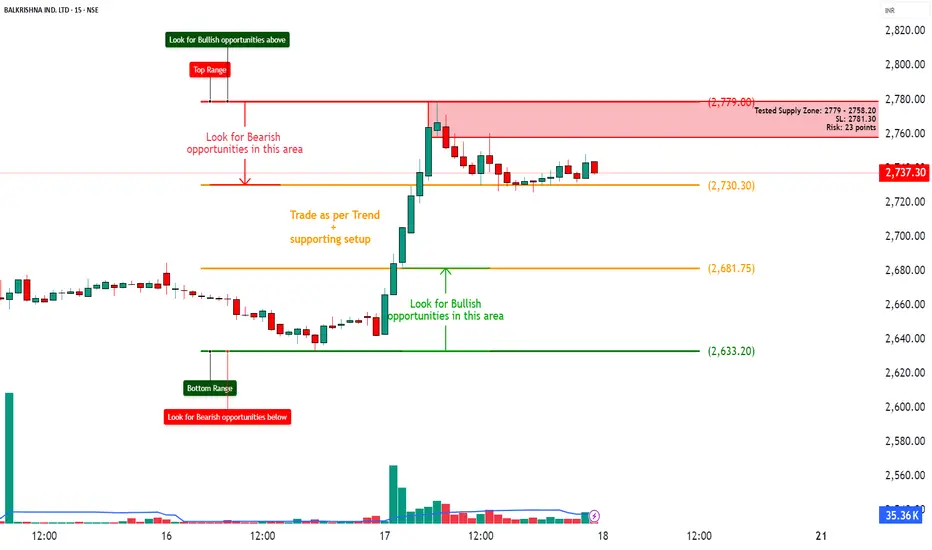
🕒 Chart Type: 15-Min | 🗓 Date: 17th July 2025
🔍 Easy-to-Understand Setup for New Traders
________________________________________________________________________________
🚦 Key Zones to Watch
🔴 Top Range (Resistance) – 2779.00
🟠 Mid-Level Zones – 2730.30 | 2681.75
🟢 Bottom Range (Support) – 2633.20
________________________________________________________________________________
💡 What’s Happening on the Chart?
✅ Strong Up-Move seen from the support zone 📈
✅ Price is now consolidating below a tested Supply Zone (2779 - 2758)
✅ Volume spike shows interest near breakout
✅ A clean structure for price action-based planning 🔍
________________________________________________________________________________
🎯 How to Plan Trades (Educational Purpose Only):
🔼 Best Buy Setup:
• Entry: Above 2779 (Breakout signs)
• SL: Below 2730
• Target: R:R 1:1 | 1:2 +
• Reason: Trend continuation + price holding above key levels
🔽 Best Sell Setup:
• Entry: Near 2775–2780 (Supply Zone)
• SL: 2781.30
• Target: R:R 1:1 | 1:2 +
• Reason: Strong supply zone tested + limited upside + defined risk
________________________________________________________________________________
🧠 Simple Learning Points:
• ✅ Trade with the trend until price reaches an opposing zone
• 🧱 Use zones (not random entries) for planning
• 📉 If price enters Supply → look for bearish signs
• 📈 If price pulls back to Demand → look for bullish setups
________________________________________________________________________________
📦 Zone Markings for Reference:
• 🔴 Supply Zone: 2779 – 2758.20
⚠ Disclaimer (Please Read):
• These Trades are shared for educational purposes only and is not investment advice.
• I am not a SEBI-registered advisor.
• The information provided here is based on personal market observation.
• No buy/sell recommendations are being made.
• Please do your own research or consult a registered financial advisor before making any trading decisions.
• Trading involves risk. Always use proper risk management.
I am not responsible for trading decisions based on this post.
________________________________________________________________________________
💬 Found this helpful?
Drop your thoughts or questions in the comments below ⬇️
🔁 Share this post with your trading community – let them benefit from clean charts, structured setups, and zone-based learning.
✅ Follow simpletradewithpatience for charts, clean setups, and educational content based on price action, zones, and risk-managed trades.
🚀 Trade with patience, trust your charts, and stay clear-headed!
Be Self-Reliant | Trade with Patience | Learn with Charts & Zones 📊
________________________________________________________________________________
BALKRISIND
Balkrishna Industries (BALKRISIND) Monthly Chart AnalysisThe technical setup combines Fibonacci retracements, trendlines, and moving averages to reveal key insights into future price action.
The following analysis covers key support and resistance levels, bullish and bearish scenarios, and potential trade opportunities.
Trend Overview :
The stock is in a long-term uptrend, supported by a rising trendline that has acted as a strong base.
Recent corrections indicate a healthy retracement within this uptrend.
Fibonacci Retracement Levels :
The Fibonacci retracement is drawn from a major swing low to swing high.
Key levels:
23.6% at 3,096.30.
38.2% at 2,966.30 (currently breached).
50% at 2,785.30 (tested as support).
61.8% at 2,605.30 (a critical level for buyers).
78.6% at 2,466.30 (final support zone).
Support Zones :
Primary Support: 50% retracement at 2,785.30 coinciding with EMA-21 (~2,661.59).
Secondary Support: 61.8% retracement at 2,605.30 aligned with a consolidation zone.
The long-term trendline also intersects around these levels, adding confluence.
Resistance Zones :
Immediate Resistance: 23.6% retracement at 3,096.30.
Strong Resistance: Previous swing high near 3,374.30.
Psychological resistance at 3,500.
Exponential Moving Averages (EMAs):
EMA-9 at 2,850.54 is currently supporting the price.
EMA-21 at 2,661.59 aligns with the 50% Fibonacci level, acting as a critical support zone.
The EMAs are in a bullish crossover, indicating long-term strength despite short-term corrections.
Volume Analysis :
Monthly volumes are consistent, with higher volumes during bullish candles, signaling strong institutional interest.
The recent pullback has seen declining volumes, suggesting a lack of aggressive selling.
Bullish Scenario :
If the price holds above the 50% retracement (2,785.30) and regains 3,096.30, the uptrend could resume.
Breakout above 3,374.30 may lead to new all-time highs, targeting 3,826.20 as per the Fibonacci extension.
Bearish Scenario :
A breakdown below the 61.8% retracement (2,605.30) and the long-term trendline could invalidate the uptrend.
Further downside could target the 78.6% retracement at 2,466.30 and psychological support at 2,400.
Trade Plan
For Bulls :
Entry: Near 2,785.30 (50% retracement) with confirmation of reversal signals.
Target 1: 3,096.30 (23.6% retracement).
Target 2: 3,374.30 (previous high).
Target 3: 3,826.20 (Fibonacci extension).
Stop Loss: Below 2,605.30 (61.8% retracement).
For Bears :
Entry: On breakdown below 2,605.30 with strong bearish momentum.
Target 1: 2,466.30 (78.6% retracement).
Target 2: 2,400 (psychological level).
Stop Loss: Above 2,785.30.

Balkrishna Ind Ltd - BearishStock currently in downtrend
Making constant LLs - LHs
3030-50 strong supply area
View changes if close above 3050
Downside 2800 possible

Balkrishna - Coming near support areaLike other stocks even this one is approaching near strongest support area
1st Area of support 2800-2830
2nd Area of support 2770-2790
Best to wait and see where it takes the halt
Also to wait for a buy candle of to make HH Hls
Targets can be around 3000/3080

Balkrishna - Sideways to BullishStock in a small downtrend for last few days
Arriving at a strong support area of 2990-3010
May try to pause and turn back from this level
As it is also a Gap Up support area as well as Resistance turned Support area
Will be good to add on the said levels with a strong Sl below 2960

BALKRISIND - Bullish Consolidation with VolumesNSE: BALKRISIND is closing with a bullish consolidation candle supported with volumes.
Today's volumes and candlestick formation indicates strong demand and stock should move to previous swing highs in the coming days.
The stock has been moving along the horizontal support for the past few days which is indicating demand.
One can look for a 8% to 13% gain on deployed capital in this swing trade.
The view is to be discarded in the event of the stock breaking previous swing low.
#NSEindia #Trading #StockMarketindia #Tradingview #SwingTrade

Balkrishna Industries: Bullish TriangleUsually this wave structure forms in an impulsive sequence as wave 4 . It consists of 5 sub waves as wave-a , wave-b , wave-c, wave-d and a final setback wave-e . Each of these waves consists of three wave internal structure. Each of the waves should not break their extreme points. The final confirmation to enter the position comes when the price gets close above the level of wave-d. The minimum target of the pattern is just a poke above the level of wave-b and just above the level of wave-3 of the impulsive count. There is also a guideline to predict the target of this pattern which is known as triangular thrust. The triangular thrust is the measurement of the distance from the level of wave-a to the level of wave-b . This measured length should be kept at the point of completion of wave-e (conservative approach) or to the breakout level of wave-d to get the target of this pattern (aggressive approach).
INVESTMENT STRATEGY:
Buy on CMP 2445 , keeping SL of 2150 look for the measured target of 2900/2950 in the coming months

My view on BalkrisindBalkrisind should give breakout above 2240.
Balkrisind
Above 2240
Tgt 2280-2300-2350++
Keeping on radar Balkrisind 2240 CE


Balakrisind Stock is in symmetrical triangle Results are good, Weekly bullish engulfing candle. So i go for long in this stock. If you want to stop out your loss , below 1700 closing in weekly candle you may come out .

BALKRISHAN TO TAKE LONGLong Balakrishna at the BO candle. All important levels are marked on the charts. Good Entry point With risk-to-reward trade. This is for your educational purpose only.

Balkrisind- shorting opportunityIdea: Given the current market conditions one can initiate short in Balkris ind. For the current expiry one can buy 2100 PE at Rs 20-22 with target of 50 and SL of Rs 7.
Once 2050 is broken decisively (earlier demand zone) target 1 and target 2 would be possible in Sep series.
Basis: It has broken the trend line on the lower side and given the bearish conditions with Nifty probably approaching 17000 the stock can fall further.
(Above is for educational purpose only. Pl consult your financial advisor before investing/trading).

BALKRISIND - Ichimoku Bullish Breakout Stock Name - Balkrishna Industries Limited
Ichimoku Cloud Setup :
1). Today's close is above the Conversion Line
2). Future Kumo is Turning Bullish
3). Chikou span is slanting upwards
All these parameters are showing bullishness at current price
and more bullishness AFTER crossing 2450.
#This is not Buy and Sell recommendation to any one. This is for education purpose and a helping hand to learn trading in Market.
# Cloud Trading
# Ichimoku Cloud
# Ichimoku Followers
I hope you all like my analysis.
Please do share your thoughts into comment section.
Please give a like, it motivates me to do analysis.

BALKRISIND Trendline BreakoutBalkrishna Industries has given a trendline breakout, volume is also good.
RSI is almost at 70 which is a positive sign.
CMP - 2349
T1 - 2500
T2 - 2700
Keep 1:1 SL @ 2200
If you like this, please hit the like and subscribe :)
Trade Carefully!


Symmetrical triangle pattern breakout in BALKRISIND.The symmetrical triangle pattern seen in today's trading session is given a breakout in BALKRISIND and is likely to go up to 2765.

BALKRISIND Long idea (Intraday)Price bounced from support area and there is high possibility of price to go up. All the analysis and levels mentioned on chart.

BALKRISINDBALKRISIND - short
Analysis done on daily time frame.
Bullish M (BAT) harmonic pattern formation.

Balkrishna Ind. Chart Analysis !!📈 Balkrishna Ind. 📉
My Findings :-
1. Breakout from a swing high and Resistance Zone.
2. Close above March high.
3. Higher High and Higher Low formation.
4. Auto Sector is in Uptrend.
Bias- Long
Target- 2397, 2516 and 2692
SL- 39450
RR- 1: 2.5
All Important Supports and Resistances are drawn in chart.
All levels are of Spot and on closing basis.
Disclaimer : Consult Your Financial Advisor Before Taking Any Decision On This Analysis.

BalkrishindOnly take position on above 1:5 RR ratio
-----------------------------------------------------
Current Price : 1822
Take position at : breakout the triangle setup 1875
Max Target 40% ROI
Stop loss according your Psychology
RRR 1:6
Time period : 1 year

Bala Krishna IndustriesImportant Investment levels and trend line marked.
Fundamentally very good stock. Keep accumulating...
Study based on purely technicals....
For clarity have marked on weekly charts.
Lets Revisit this chart every week...
Will update more info as the movement happens in comment section..
Like... Share... Follow

BALKRISINDBALKRISIND good and leading tier company
completed its 78 retreatment
Careful because of result
if reversal then ride at trailing SL
2275-2349-2389 for trading or swing
For Long term hold with SL of weekly candle

BALKRISHNA INDS WEAK BELOW 2455The stock was going up following a trend line and now at the verge of breaking the downside, looks good to sell if sustains below 2455 for the marked targets on chart until 2540 is intact on the upside.
To motivate us, Please like the idea If you agree with the analysis.
Happy Trading!
InvestPro India Team
