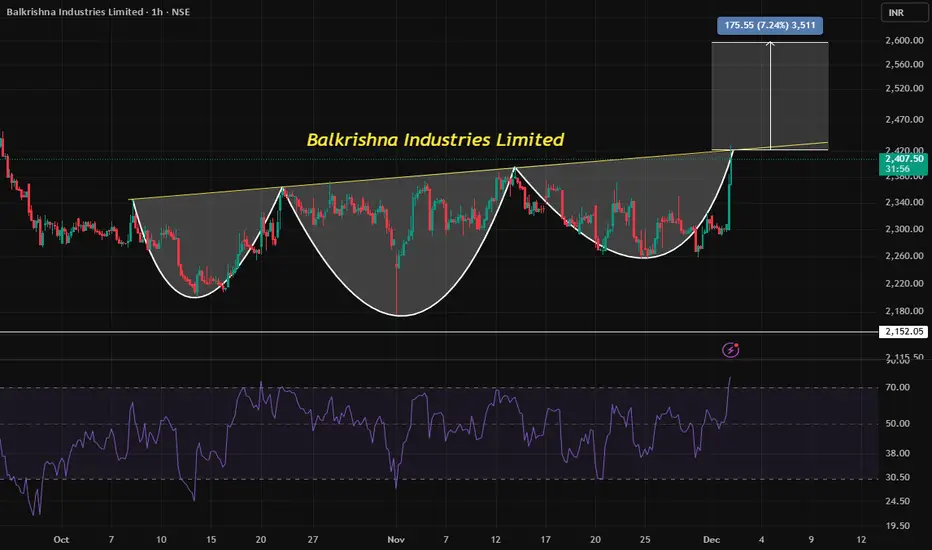
When Charts Speak Loud: Balkrishna Industries at Turning Point📊 Understanding the Head & Shoulder Pattern
Definition: The Head & Shoulder (H&S) pattern is one of the most recognized reversal formations in technical analysis. It consists of three peaks:
Left Shoulder: A rise followed by a decline.
Head: A higher rise followed by another decline.
Right Shoulder: A smaller rise, often mirroring the left shoulder, followed by a decline.
Neckline: The support level connecting the lows after each peak. A breakdown below this line often signals a bearish reversal.
👉 Why it matters: Traders view the H&S as a warning that bullish momentum is fading and a potential trend reversal could be underway.
⚡ RSI Momentum Explained
Relative Strength Index (RSI): A momentum oscillator that measures the speed and change of price movements.
Key Levels:
Above 70 → Overbought zone (possible correction or reversal).
Below 30 → Oversold zone (possible bounce).
In Balkrishna Industries’ case, RSI moving above 70 on the hourly chart suggests the stock is in an overbought condition, increasing the probability of a pullback.
📌 Current Opportunity in Balkrishna Industries (Trading at 2407)
The stock is forming a Head & Shoulder pattern on the hourly timeframe.
RSI above 70 indicates overheated momentum, aligning with the potential reversal signal from the H&S.
Trader’s takeaway:
Watch for a neckline breakdown to confirm the pattern.
A confirmed breakdown could open opportunities for short trades or profit booking.
Risk management is crucial—false breakouts can occur, so traders often wait for volume confirmation.
🎯 Why Traders Should Care
Combining chart patterns (H&S) with momentum indicators (RSI) gives a stronger signal than relying on one alone.
Balkrishna Industries at 2407 is at a critical juncture—either it sustains momentum or confirms reversal.
For traders, this is a classic setup where technical analysis provides a roadmap for potential profit opportunities.
🔥 In short: "Balkrishna Industries is shouting reversal—will you listen to the charts?"
Bankifty
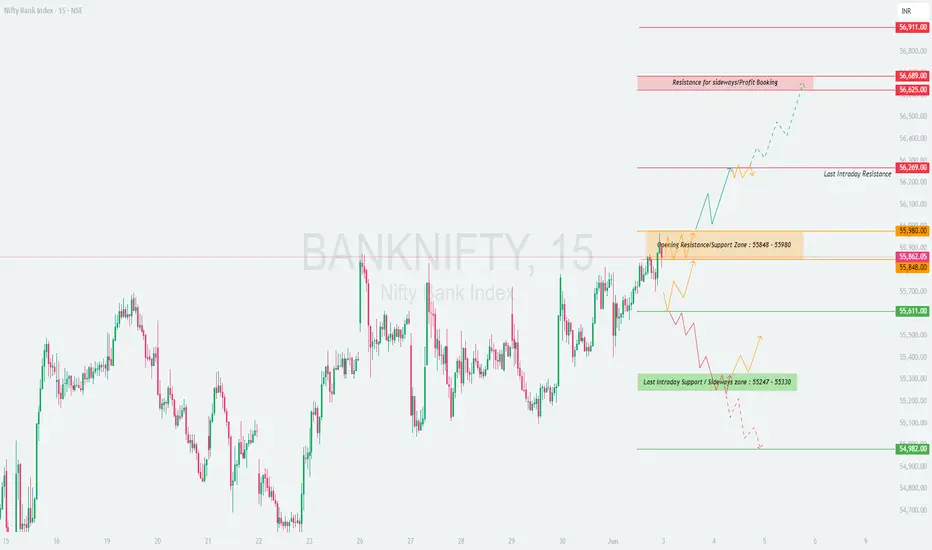
BANKNIFTY : Trading levels and Plan for 03-Jun-2025📘 BANK NIFTY – TRADING PLAN for 03-Jun-2025
🕒 Timeframe: 15-minute Chart Structure
📍 Gap Opening Threshold: 300+ points from previous close of 55,862.05
🔼 GAP-UP OPENING (Above 56,180):
A gap-up beyond 300 points will likely place Bank Nifty near or above the Last Intraday Resistance at 56,269 . This region has historically witnessed profit booking or reversal patterns. If price continues to hold above this resistance, it may aim for the Resistance for Sideways/Profit Booking at 56,625 – 56,689 . Above that lies the final upside target of 56,911.
✅ Plan of Action:
• Wait for 15–30 minutes post-open to confirm sustainability above 56,269.
• If price forms a base and breaks above 56,300 with volume support, look for a breakout trade toward 56,625 – 56,689.
• If rejection is seen at 56,269, with bearish reversal patterns like shooting star / bearish engulfing, consider short trades targeting back to 56,000 – 55,980 with SL above the day’s high.
• Only aggressive breakout buyers may consider continuation trades above 56,689, targeting 56,911, but only after a clear consolidation or retest.
🧠 Educational Insight: In strong gap-ups, always remember: the first move is often emotional. Let structure develop. Avoid chasing strength at known resistance without a base.
⚖️ FLAT OPENING (Between 55,848 – 55,980):
A flat or minor gap open in this zone places price inside the Opening Resistance/Support Zone . This is a zone of indecision, often characterized by choppy price action and traps.
✅ Plan of Action:
• Avoid jumping into trades at the open. Let a clear directional bias form.
• For Long Trades: Wait for a breakout and sustained price action above 55,980, with at least 1–2 bullish candles holding above it. Target would be 56,269, then 56,625.
• For Short Trades: If price fails to sustain above 55,980 and forms lower highs, consider shorts below 55,848, aiming for 55,611, and potentially 55,330 if momentum builds.
• Avoid trading inside this boxy range unless a decisive 15-min candle gives direction.
🧠 Educational Insight: Price in resistance/support zones often consolidates. The smart move is to let the direction emerge and avoid the urge to catch every minor bounce or dip.
🔽 GAP-DOWN OPENING (Below 55,560):
A gap-down of over 300 points will place price below the Last Intraday Support Zone (55,330 – 55,247) , or possibly near the panic support level of 54,982. This area becomes critical for intraday sentiment.
✅ Plan of Action:
• Let the initial panic selling settle in the first 15–30 mins.
• For Reversal Longs: If price reaches 54,982 and shows reversal signs (bullish hammer, engulfing), one can attempt a long scalp toward 55,247 – 55,330, with a tight SL below 54,960.
• For Breakdown Shorts: If price breaks and sustains below 55,247 – 55,330 zone without any signs of demand, you can short with SL above 55,330, for a move towards 54,982 and further if broader markets also remain weak.
• Be ready for false breakdowns in such setups—always rely on candle close confirmation.
🧠 Educational Insight: Gap-downs are often driven by fear or news. Instead of chasing fear, let the market show whether it's real selling or a trap. Trade reactively, not emotionally.
🛡 RISK MANAGEMENT TIPS FOR OPTIONS TRADERS:
✅ 1. Don’t trade the first 5–15 mins on gaps — wait for structure confirmation.
✅ 2. Avoid naked option buying after IV spike on big gaps — prefer spreads or directional futures with hedge.
✅ 3. Use time-based exits — if trade doesn’t move in 20–25 mins after breakout, re-evaluate.
✅ 4. Use proper position sizing — risk only 1–2% of your capital per trade.
✅ 5. Don’t trade breakouts blindly near resistance/support — look for confluence (price + volume + structure).
📊 SUMMARY & CONCLUSION:
• 🟢 Bullish Above: 55,980, Target: 56,269 → 56,625 → 56,911
• 🔴 Bearish Below: 55,848, Target: 55,611 → 55,330 → 54,982
• 🟧 Opening Resistance/Support Zone: 55,848 – 55,980 (Wait for clarity)
• 🟩 Support Zones: 55,330 / 54,982
• 🟥 Resistance Zones: 56,269 / 56,625 / 56,911
• ⏱ Time-based strategy: Let 15–30 mins develop, then decide based on clear structure
✨ Final Thought: Trade what you see, not what you feel. Level-based structure with time confirmation gives the best entries. Avoid emotional trades on gaps.
📢 DISCLAIMER: I am not a SEBI-registered analyst. This trading plan is for educational and informational purposes only. Please consult a SEBI-registered financial advisor before taking any investment or trading decision.
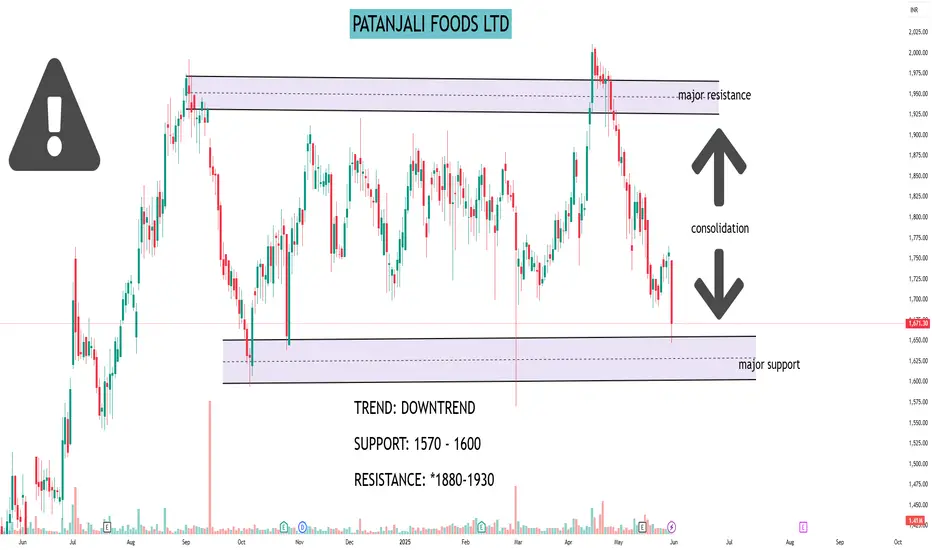
PATANJALI FOODS LTD#PATANJALI
STOCK NAME: PATANJALI FOODS LTD (NSE)
CHART ANALYSIS:
Price has broken out of a long consolidation range. Strong bearish candles indicate downside momentum. Ideal shorting opportunity for swing traders.
TREND: DOWNTREND
SUPPORT: 1570 - 1600
RESISTANCE: *1880-1930
TRADE:
SELL BELOW 1670
Target 1: *1620
Target 2: *1575
Target 3: *1520
Stop Loss: *1750
▲ I AM NOT SEBI REGISTERED. THIS IS ONLY FOR EDUCATIONAL PURPOSES.
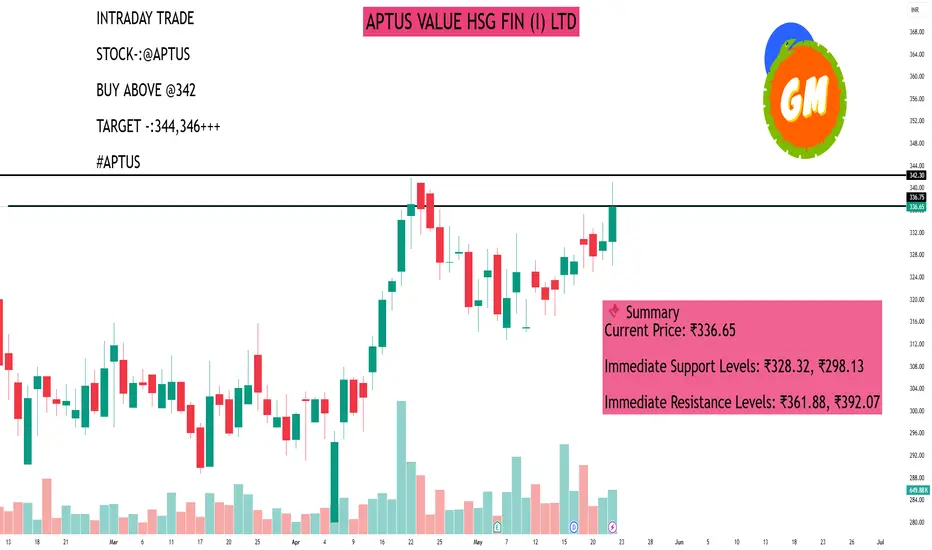
APTUS VALUE HSG FIN (I) LTDAs of May 22, 2025, Aptus Value Housing Finance India Ltd (NSE: APTUS) closed at ₹336.65, marking a 1.89% increase from the previous session.
📊 Daily Support and Resistance Levels
Based on technical analysis, the following support and resistance levels have been identified for Aptus Value Housing Finance India Ltd:
Classic Pivot Points:
Pivot Point: ₹328.32
Support Levels:
S1: ₹298.13
S2: ₹264.57
S3: ₹234.38
Resistance Levels:
R1: ₹361.88
R2: ₹392.07
R3: ₹425.63
Fibonacci Retracement Levels (from recent downtrend):
Resistance Levels:
23.6%: ₹319.49
38.2%: ₹323.75
50%: ₹327.20
61.8%: ₹330.65
76.4%: ₹334.91
📈 Technical Indicators Overview
Relative Strength Index (RSI): 43.56 (indicates a bearish trend)
Stochastic RSI: 11.05 (oversold condition)
MACD: 0.47 (bullish crossover)
Average Directional Index (ADX): 31.01 (indicates a strong trend)
Commodity Channel Index (CCI): -165.91 (suggests the stock is oversold)
📌 Summary
Current Price: ₹336.65
Immediate Support Levels: ₹328.32, ₹298.13
Immediate Resistance Levels: ₹361.88, ₹392.07
Given the current technical indicators and support/resistance levels, traders should exercise caution. Monitoring the stock's movement around these key levels can provide insights into potential trading opportunities. It's advisable to consider these technical factors in conjunction with broader market trends and fundamental analysis before making investment decisions.
MACD ( Moving Average Convergence Divergence)When To Use And How To Read The MACD Indicator - short for Moving Average Convergence Divergence, is a popular momentum indicator in technical analysis used to identify trends and potential reversals in stock prices. It's a tool that helps traders understand the strength, direction, and duration of a trend by analyzing the relationship between two moving averages.

Option and Database TradingOption type: The options chain segregates call options, which allow you to buy TIL shares, and put options, which grant you the right to sell them. Bid and ask prices: Each option contract at a specific strike price and expiration date comes with bid and ask prices. For example, a call option with a strike price of Rs.

Nifty 50 : Channel Breakout and Target ReachedIn Nifty 50, Channel Pattern formed and Breakout. So Buy on August 16 and Target was reached on August 24.

TATAELXSI Good to Study NSE:TATAELXSI
Good to keep on the radar
Always respect SL & position sizing
========================
Trade Secrets By Pratik
========================
Disclaimer
SEBI UNREGISTERED
This is our personal view and this analysis
is only for educational purposes
Please consult your advisor before
investing or trading
You are solely responsible for any decisions
you take on basis of our research.

[INTRADAY] #BANKNIFTY PE & CE Levels(30/08/2023)Today will be gap up opening in BANKNIFTY . After opening if banknifty sustain above 44550 level then possible upside rally of 400-500 points upto 44950 Level. And this rally can extend for another 400 points if it gives breakout of 45050 level. Any Major downside only expected in case banknifty starts trading below 44450 level.

Nifty Finance Turned PositiveNifty Finance turned positive on Hourly chart. Nifty Finance has seen a breakout above downtrend line and sustaining here. Keep watch a small or big upside move likely

PITCHFORK ANALYSIS FOR BankNifty SPOT- LONG VIEW STARTING TODAYUsing Pitchfork analysis on a daily timeframe it is evident as everyone can see that we have taken support from the bottom line of the pitchfork. Since it is a green candle now our first target(44500/45000) will be the middle line and stoploss would be closing below the bottom-line (42970) of the pitchfork.

Nifty BankNifty Analysis for 01-12-2022NSE:NIFTY
NSE:BANKNIFTY
Good to keep on the radar
Always respect SL & position sizing
========================
Trade Secrets By Pratik
========================
Disclaimer
SEBI UNREGISTERED
This is our personal view and this analysis
is only for educational purposes
Please consult your advisor before
investing or trading
You are solely responsible for any decisions
you take on basis of our research.

NIFTY banknifty AnalysisNSE:NIFTY NSE:BANKNIFTY
Good to keep on the radar
Always respect SL & position sizing
========================
Trade Secrets By Pratik
========================
Disclaimer
SEBI UNREGISTERED
This is our personal view and this analysis
is only for educational purposes
Please consult your advisor before
investing or trading
You are solely responsible for any decisions
you take on basis of our research.

Banknifty Keep watchNSE:BANKNIFTY
Good to keep on the radar
Always respect SL & position sizing
========================
Trade Secrets By Pratik
========================
Disclaimer
SEBI UNREGISTERED
This is our personal view and this analysis
is only for educational purposes
Please consult your advisor before
investing or trading
You are solely responsible for any decisions
you take on basis of our research.

41000 Target 25 April or 9 May Cup & Handle Confirm Pattern with Bullish Daily Candle
RSI Bullish After crossing 60 points
ADX Positive
Above 200 EMA Retest Cofirm
25th April Target
next 9th May Target Prefer

Bank Nifty-09/12/2021Gap-Up: with sup of PDH BO(BUY) / PDH Rej/ BO(SELL)
Flat: Above PDH(BUY) / Imp BO(SELL)
Gap-D: with Support of PDL(BUY) / Imp Rej(SELL)


