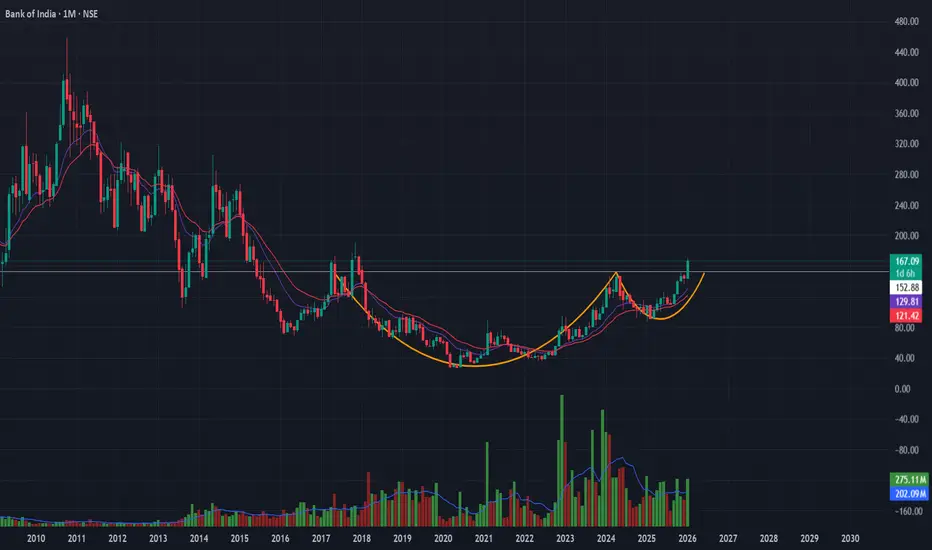
BankIndia : Ready for ~169%+ Ride !Hi friends,
Target & Stoploss are mentioned on the self explanatory chart .
please don`t go with the buzz around you regarding the stocks and stock market .
Please follow what Technical chart & analysis is conveying .
Bank Of India is a central government backed bank and currently it is reversal phase in terms of chart pattern.
Higher-High & Higher-Low getting formed in longer time-frame like Weekly & monthly chart .
Please feel free to comment or share your views on my analysis .
Note : I am not SEBI registered advisor . Please consider my analysis for education purpose only .
BANKINDIA

BankIndia - Rounding bottomBank of India has formed a rounding bottom pattern and also had a small breakout.
It had made high of 170 and then come down for the resting.
So, once it breaks and sustain above 170, you can buy and hold for the target of 200 and 220.
Buy on every dips after breakout, it will give handsome amount of return.

Bank of India | Cup & Handle Breakout SetupStructure:
Long-term Cup & Handle pattern nearing completion on monthly timeframe, indicating accumulation after a prolonged base.
Confirmation Signals:
-Volume expanding on rallies
-RSI above 50 and rising
-OBV trending higher → accumulation visible
-Price holding above short-term EMAs
Trade Plan:
-Buy: Sustained breakout above ₹151
-Targets: ₹199 → ₹268
-Stop-loss: ₹134 (ATR-based, structure-valid)
-Risk–Reward: ~1:5
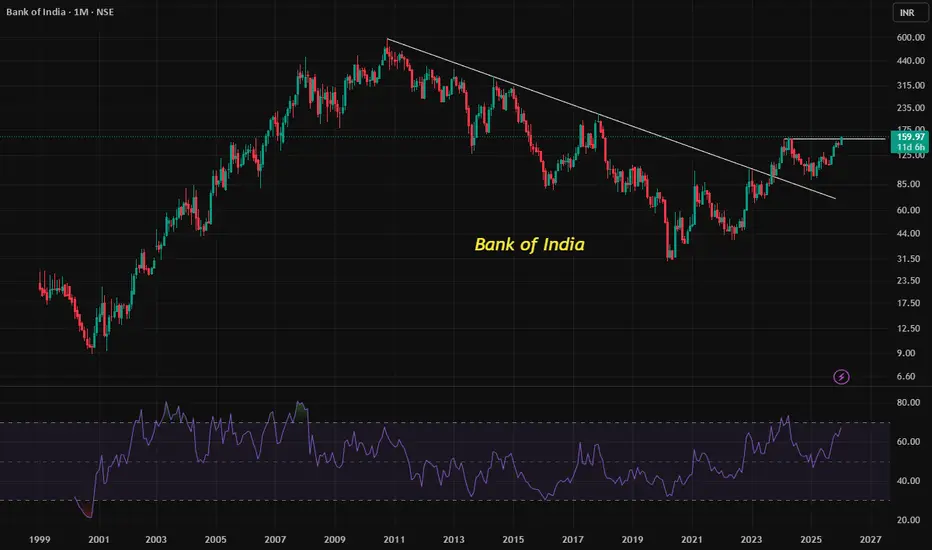
Understanding Long-Term Breakouts & RSI Strength in Stock TrendUnderstanding Long-Term Breakouts and RSI Strength in Stock Trends : Base Chart BANK OF INDIA (BANKINDIA)
📈 Long-Term Downtrend Breakout
A long-term downtrend line represents a period where a stock has consistently moved lower, connecting its major peaks over months or years.
When a stock breaks above this line, it signals a potential end to prolonged weakness.
This breakout often attracts new buyers, as it suggests the stock may be entering a fresh bullish phase.
Importantly, the breakout is not just about crossing the line—it must be sustained above it to confirm strength. Temporary moves above the line without follow-through are often false signals.
🔑 Importance of Sustaining Above the Breakout
Sustaining above the breakout level shows follow-up buying interest:
It means investors are not just reacting to the breakout but are continuing to accumulate the stock.
This sustained action builds confidence that the breakout is genuine and not a short-lived spike.
In technical analysis, this is often referred to as confirmation of breakout strength.
📊 Uptrend Formation in Interim Trends
After a breakout, the stock’s behavior in shorter-term trends (weekly or monthly swings) becomes crucial.
Formation of higher highs and higher lows in interim trends is a classic sign of an uptrend.
This pattern reflects consistent demand, where buyers step in at higher levels each time.
For traders, this is a positive sign that the stock is not just stabilizing but actively building momentum.
💡 RSI as a Strength Indicator
The Relative Strength Index (RSI) is a momentum oscillator that measures the speed and change of price movements.
RSI above 50 generally indicates bullish momentum, while below 50 suggests bearishness.
In this case, RSI has stayed above 50 since 2022, showing persistent strength.
Recently, RSI moving above 60 adds further conviction, signaling additional buying interest and stronger momentum.
Sustained RSI levels above 60 often align with healthy uptrends, reinforcing the bullish outlook.
📝 Key Takeaways
Breakout of a long-term downtrend marks a potential shift from weakness to strength.
Sustaining above breakout levels confirms genuine buying interest and reduces the risk of false signals.
Higher highs in interim trends reflect continued demand and a strong uptrend formation.
RSI above 50 and rising above 60 highlights persistent and growing buyer enthusiasm.
Together, these factors suggest that the stock is not only recovering but also building a strong foundation for continued upward movement.
Bank of India Signals Bullish Continuation on Monthly ChartBank of India (NSE: BANKINDIA) is currently trading at ₹139.88 and presents a technically strong setup for bullish trend continuation. A closer look at the monthly chart reveals several key developments that reinforce this outlook.
🔍 Technical Highlights
✅ Intermediate Downtrend Reversal
The stock has completed an intermediate downtrend reversal, marked by a higher high at ₹107.00. This level sits above the neckline of the previous consolidation pattern, confirming a shift in momentum and signaling renewed strength in the trend.
📊 Moving Average Alignment
Price action is currently above both the 50-day and 100-day moving averages. This positioning reflects underlying bullish sentiment and sustained buying interest. Moreover, the 50 DMA has crossed above the 100 DMA—a classic bullish crossover that often precedes further upward movement.
📈 Long-Term Uptrend Intact
The broader trend remains upward, supported by consistent higher lows and higher highs. The recent price behavior aligns with this long-term trajectory, suggesting that the stock is well-positioned for continued gains.
💪 RSI Above 50
The Relative Strength Index (RSI) is comfortably above the 50 level, indicating strong buyer strength and confirming the bullish momentum.
📌 Learners Takeaway
With the intermediate downtrend reversal, bullish moving average crossover, and RSI strength, Bank of India shows a textbook setup for trend continuation. Traders and investors may find this an opportune moment to align with the prevailing uptrend, while keeping an eye on price action near key support and resistance zonesfor validation.
Live chart Example

Bank of IndiaBANKINDIA - The stock is currently trading within a clear ascending channel. The price recently rebounded from the lower channel support and appears to be moving towards the mid-to-upper range.
We observed a small falling wedge/flag breakout near the 117–118 level, which is a bullish indicator. This strength is further confirmed by subsequent candles showing good follow-through with strong volume.
Consider initiating a position around 127, with target prices set at 138 and 150.
If the stock closes below 110, I recommend promptly exiting all long positions to protect capital, as this would suggest a shift to negative technical momentum.

BANKINDIABANKINDIA is currently trading above resistance breakout and also recently has shown Inverted H&S breakout as well. Volume in recent session has been increased. If we check pattern target then it has a potential to go up to 160-70 level. I may change my view if it closes below 120. In recent time I have observed traction in all PSU banking stock. Is it something that we don't know!! Chart is indicating something to be watched very closely. Keep it on radar.

Bank Of India Daily timeframe analysis for long
NSE:BANKINDIA was in narrowing range over several months, now with increasing volume above 109 with SL 100.
Major Targets Highlighted in Blue lines, sub targets in grey lines.

Bank of IndiaHello and welcome to this analysis
Since end Jan we have see the stock consolidate and drift down, prior to that for 4 years the stock gave a strong rally.
Crucial support at 90-95 with strong resistance at 150.
Investors could look to accumulate as medium to long term outlook remains very strong.
Had covered Union Bank of India earlier this month. Link is given below, can check the analysis for it too.
Happy Investing

BANKINDIA - nice setup to study and take positionNSE:BANKINDIA
cmp 125
one can take position here at 125 or wait for BO above 157
The objective of this analysis is knowledge sharing and education. There isn't any buy or sell advise in this article. Every stock is held for a short to medium amount of time and is positional.
It is expected of each person to carry out independent research and evaluation to ascertain whether my perspective is consistent with your studies.

Short Term Swing Trading Idea in Indian Bank 15% UpsideHi,
NSE:BANKINDIA has given a Bullish Inverted Head & Shoulder Breakout on Daily charts with very good volume.
MACD is also on the bullish side on Daily and Monthly time frames. RSI is also on the bullish side on daily, weekly and monthly time frames.
In the current market scenario, I am expecting that the bullish momentum will continue.
Complete price projection like entry, stop loss and targets mentioned on the charts for educational purpose.
Don't Forget to Follow me to get all the updates.
Please share your feedback or any queries on the study.
Disclaimer: Please consult your financial advisor before making any investment decision.

Triple Bottom Breakout - Keep An Eye - BANKINDIA📊 Script: BANKINDIA
📊 Sector: Banks
📊 Industry: Banks - Public Sector
Key highlights: 💡⚡
📈 Script is giving breakout of Triple Bottom on daily chart.
📈 Stock was facing resistance at 149 level, today it has given breakout and closed at 150, keep an eye on stock it may give good rally.
📈 Script is trading at upper band of BB.
📈 MACD is giving crossover .
📈 Already Crossover in Double Moving Averages.
📈 Right now RSI is around 63.
📈 One can go for Swing Trade.
⏱️ C.M.P 📑💰- 150
🟢 Target 🎯🏆 - 161
⚠️ Stoploss ☠️🚫 - 144
⚠️ Important: Always maintain your Risk & Reward Ratio.
✅Like and follow to never miss a new idea!✅
Disclaimer: I am not SEBI Registered Advisor. My posts are purely for training and educational purposes.
Eat🍜 Sleep😴 TradingView📈 Repeat 🔁
Happy learning with trading. Cheers!🥂

BANKINDIA - huge potential - swing trade + investmentThe analysis is done on Weekly TF hence price may take few weeks to few months in order to reach the targets. Trade setup is explained in image itself.
Price has come out of stage-1 accumulation. one can notice the high volume activity as well in recent months. Now it has been giving pullbacks as per market conditions and seems to be ready for further upside (refer zoomed in chart)
The above analysis is purely for educational purpose. Traders must do their own study & follow risk management before entering into any trade
Checkout my other ideas to understand how one can earn from stock markets with simple trade setups. Feel Free to comment below this or connect with me for any query or suggestion regarding this stock or Price Action Analysis.

Bank of India - Long Setup, Move is ON...#BANKINDIA trading above Resistance of 145
Next Resistance is at 202
Support is at 108
Here are previous charts:
Chart is self explanatory. Levels of breakout, possible up-moves (where stock may find resistances) and support (close below which, setup will be invalidated) are clearly defined.
Disclaimer: This is for demonstration and educational purpose only. This is not buying or selling recommendations. I am not SEBI registered. Please consult your financial advisor before taking any trade.

Bank of India - Long Setup, Move is ON...#BANKINDIA trading above Resistance of 123
Next Resistance is at 145
Support is at 101
Here are previous charts:
Chart is self explanatory. Levels of breakout, possible up-moves (where stock may find resistances) and support (close below which, setup will be invalidated) are clearly defined.
Disclaimer: This is for demonstration and educational purpose only. This is not buying or selling recommendations. I am not SEBI registered. Please consult your financial advisor before taking any trade.

BANKINDIA - Long Setup, Move is ON..NSE:BANKINDIA
✅ #BANKINDIA trading above Resistance of 133
✅ Next Resistance is at 215
Related charts:
Charts are self-explanatory. Levels of breakout, possible up-moves (where stock may find resistances) and support (close below which, setup will be invalidated) are clearly defined.
Disclaimer: This is for demonstration and educational purpose only. This is not buying or selling recommendations. I am not SEBI registered. Please consult your financial advisor before taking any trade.


Bank of India - Long Setup, Move is ON...#BANKINDIA trading above Resistance of 101
Next Resistance is at 123
Support is at 69
Here are previous charts:
Chart is self explanatory. Entry, Resistances and Support are mentioned on the chart.
Disclaimer: This is for demonstration and educational purpose only. This is not buying or selling recommendations. I am not SEBI registered. Please consult your financial advisor before taking any trade.

BANKINDIABANKINDIA:- If the stock sustains by giving a breakout of 76 level, then we can see an upside movement.
Hello traders,
As always, simple and neat charts so everyone can understand and not make it too complicated.
rest details mentioned in the chart.
will be posting more such ideas like this. Until that, like share and follow :)
check my other ideas to get to know about all the successful trades based on price action.
Thanks,
Ajay.
keep learning and keep earning.

BANKINDIA | 25-30% Targets | SwingAll information given is only for educational purposes. I am not a SEBI Registered analyst. Please consult your financial advisor before investing.

BANKINDIA - Long Setup, Move is ON..NSE:BANKINDIA
✅ #BANKINDIA trading above Resistance of 101
✅ Next Resistance is at 133
Related charts:
Charts are self-explanatory. Levels of breakout, possible up-moves (where stock may find resistances) and support (close below which, setup will be invalidated) are clearly defined.
Disclaimer: This is for demonstration and educational purpose only. This is not buying or selling recommendations. I am not SEBI registered. Please consult your financial advisor before taking any trade.


1D BANKINDIA (Bank Of India) - Short Position1. Pinbar formed at S/R level
2. Fibonacci Retracement 61.8% confirms that S/R level.
3. Trendline is in perfect position for the pinbar which acts as trendline.
4. Stop Loss and Take Profit levels are perfectly mentioned in the chart window.
5. Once Take profit level reached, try to sell half of your stocks position there and move your stop loss to breakeven and run another half stocks for freedom.
Thanks by
Pupathi Sadagopan
