DCBBANK: Strong Q2 FY26 Numbers, Triangle BO, Chart of the MonthNSE:DCBBANK This Banking Stock Just Broke Out After a Year of Consolidation - Is a 30% Rally Coming? Posted Strong Q2 FY26 Numbers, Let's Analyse in the Chart of the Month.
As per the Latest SEBI Mandate, this isn't a Trading/Investment RECOMMENDATION nor for Educational Purposes; it is just for Informational purposes only. The chart data used is 3 Months old, as Showing Live Chart Data is not allowed according to the New SEBI Mandate.
Disclaimer: "I am not a SEBI REGISTERED RESEARCH ANALYST AND INVESTMENT ADVISER."
This analysis is intended solely for informational purposes and should not be interpreted as financial advice. It is advisable to consult a qualified financial advisor or conduct thorough research before making investment decisions.
Price Action Analysis:
Overall Trend Structure:
- The stock demonstrates a year consolidation pattern from 2024 to mid-2025, creating a strong base for accumulation
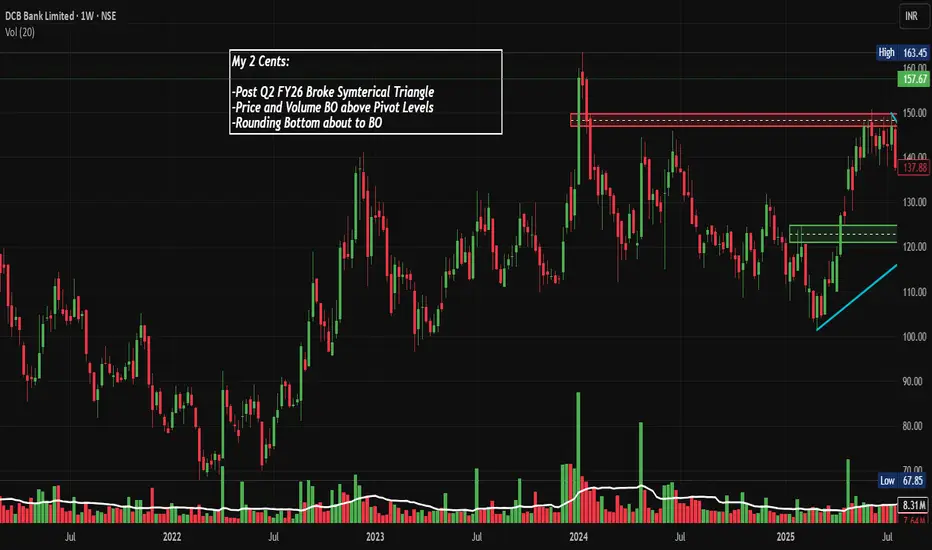
- Post-Q2 FY26 results, DCB Bank has broken out decisively from a symmetrical triangle pattern that formed during the consolidation phase
- The current price of ₹157.67 represents a significant move above the resistance zone of ₹150, which acted as a ceiling multiple times since early 2024
- A notable ascending trendline (marked in cyan) has been providing dynamic support from early 2024, suggesting sustained buying interest
Recent Price Movement:
- The stock witnessed a dramatic 23% surge in just two trading sessions (October 21-22, 2025) following the Q2 FY26 earnings release
- Current price of ₹157.67 is approaching the 52-week high of ₹163.70, demonstrating strong upward momentum
- The breakout candle shows strong conviction with increased volume participation, validating the move
- Price has successfully reclaimed and is sustaining above the critical ₹150 psychological and technical resistance level
- The stock is still 38% below its all-time high of ₹244.65, providing substantial room for upside potential
Historical Context:
- From 2021 lows around ₹70, the stock rallied to ₹150 levels by mid-2022
- A prolonged correction and consolidation phase lasted from mid-2022 through early 2024
- Multiple attempts to break the ₹150 resistance were rejected during 2024, creating a strong supply zone
- The recent breakout in October 2025 marks the first successful breach of this multi-year resistance with volume confirmation
Volume Action Analysis:
Volume Characteristics:
- Current daily volume stands at 98.79 million shares against an average of 11.07 million shares, representing an 8x surge
- Volume spike coincides perfectly with the breakout above ₹150 resistance, confirming institutional participation
- Consistent volume bars during the consolidation phase suggest steady accumulation by long-term investors
- Volume at key support levels during corrections has been relatively lower, indicating a lack of panic selling
- The volume profile shows the heaviest concentration between the ₹120-130 range, which now acts as a strong demand zone
Volume-Price Relationship:
- Breakout above resistance, accompanied by massive volume expansion, validates the bullish move
- Volume on up days significantly exceeds volume on down days during the recent rally, showing strong buying pressure
- Green volume bars dominating red volume bars in the recent price action indicate bullish accumulation
- Volume during the triangle formation was progressively declining, which is characteristic of a valid continuation pattern
- Post-breakout volume sustaining above average levels suggests continuation rather than exhaustion
Support and Resistance Levels:
Key Resistance Zones:
- Immediate Resistance (R1): ₹163.70 (52-week high and recent high)
- Medium-term Resistance (R2): ₹175-180 (Fibonacci extension level and psychological resistance)
- Major Resistance (R3): ₹200 (round number psychological barrier)
- Long-term Resistance (R4): ₹244.65 (all-time high)
Key Support Zones:
- Immediate Support (S1): ₹150 (previous resistance turned support, breakout level)
- Strong Support (S2): ₹138-140 (50% retracement of recent rally and pivot level marked on chart)
- Major Support (S3): ₹125 (ascending trendline support and breakout point from triangle)
- Critical Support (S4): ₹110-115 (bottom of recent consolidation range)
Support Strength Assessment:
- The ₹150 level has now transformed from a stubborn resistance to a new support base
- The ascending trendline from 2024 lows provides dynamic support that has been tested multiple times successfully
- The ₹125-130 zone represents a confluence of horizontal support, trendline support, and a high-volume node
- Gap support around ₹147 from the recent breakout provides a short-term cushion against minor corrections
Base Formation and Accumulation:
Base Characteristics:
- A well-defined multi-year base formation spanning approximately 2.5 years (mid-2022 to October 2025)
- The base exhibits characteristics of a symmetrical triangle consolidation pattern
- Lower highs and higher lows converging towards the apex created compression, leading to the explosive breakout
- This extended consolidation period allowed for the distribution of weak hands and accumulation by strong hands
- The base depth of approximately 35-40% from top to bottom indicates significant energy buildup
Accumulation Evidence:
- Declining volume during consolidation, followed by expansion on breakout, is a textbook accumulation pattern
- Multiple false breakouts were absorbed without panic selling, indicating patient accumulation
- Price holding above ascending trendline throughout 2024-2025 shows consistent buying support
- The rounding bottom formation visible from mid-2024 through September 2025 is a bullish accumulation pattern
- Improved fundamentals during the consolidation period attracted smart money accumulation
Technical Patterns:
Symmetrical Triangle Pattern:
- A clear symmetrical triangle pattern formed from June 2024 through October 2025
- The pattern shows converging trendlines with at least 4-5 touch points on each side
- Breakout occurred near the apex with strong volume, which is the ideal scenario for this pattern
- The pattern duration of approximately 16 months makes it a highly reliable formation
Ascending Triangle Elements:
- An ascending triangle component is visible in the chart with a flat top resistance at ₹150
- Rising lows forming the ascending trendline show progressive buying interest
- This bullish continuation pattern typically resolves to the upside, which has now been confirmed
- The pattern suggests strong demand overwhelming supply at higher levels
Breakout Pattern Validation:
- The breakout above ₹150 was accompanied by a large bullish engulfing candle
- Gap-up opening on breakout day shows urgency and conviction among buyers
- No immediate throwback to retest breakout level indicates strength
- The breakout occurred with 8x normal volume, validating the move
- Price sustaining above the breakout level for multiple sessions confirms pattern validity
Sectoral Backdrop - Private Banking Industry:
Sector Overview and Trends:
- The Indian banking sector has shown resilience with credit growth in the range of 15-17% year-on-year
- Private sector banks are gaining market share from PSU banks due to superior asset quality and technology adoption
- Small and mid-sized private banks like DCB Bank are carving niches in specific lending segments
- Net Interest Margins (NIMs) are stabilising after compression in 2023-2024, providing earnings visibility
- Asset quality metrics across the banking sector have improved, with Gross NPA levels at multi-year lows
Sector Valuations and Outlook:
- Banking sector trading at reasonable valuations with an average P/B ratio of 2-3x for private banks
- Small-cap private banks trading at a significant discount to large private banks, offering a value opportunity
- Sector outlook remains positive, driven by India's GDP growth trajectory of 6-7%
- Expected rate stability from the RBI in 2025 will help banks maintain margins
- Increasing digital adoption and financial inclusion are driving deposit and loan growth
Competitive Landscape:
- DCB Bank competes with peers like RBL Bank, South Indian Bank, Karur Vysya Bank, and CSB Bank
- Focus areas include retail lending, MSME lending, and specialised products like gold loans
- Technology adoption and digital banking are becoming key differentiators in the competitive landscape
- Consolidation trend in small banks may create M&A opportunities for well-positioned players
- Customer acquisition cost is declining with digital channels gaining prominence
Fundamental Backdrop:
Recent Financial Performance:
- Q2 FY26 results showed a robust 16.2% YoY growth in net profit to ₹184 crore
- Net Interest Income (NII) grew 17% YoY to ₹596 crore, indicating healthy core business growth
- Advances increased by 19% YoY, demonstrating strong loan book expansion
- Total operating income rose 16.22% to ₹1,822.75 crore in Q2 FY26
- Return on Assets (ROA) at 0.85% and Return on Equity (ROE) at 11.4% showing steady improvement
Asset Quality Metrics
- Gross NPA ratio improved to 2.91% as of September 30, 2025, down from 3.29% YoY
- Net NPA ratio at healthy 1.21%, indicating strong recovery and collection mechanisms
- Slippages are moderating sequentially, suggesting improved underwriting standards
- Provision coverage ratio remains adequate, providing a buffer against potential stress
- Management expects credit cost to remain below 45 basis points for the full year, indicating confidence in asset quality
Capital and Liquidity Position:
- Capital Adequacy Ratio (CAR) at strong 16.41% (Tier I: 13.97%, Tier II: 2.44%) as per Basel III norms
- Well-capitalised to support planned 20%+ loan growth without dilution
- CASA ratio at 23.52% as of September 2025, though lower than the desired 25%+
- Cost of deposits declining, helping NIM expansion despite a competitive deposit environment
- Liquidity coverage ratio and statutory ratios comfortably above regulatory requirements
Strategic Initiatives and Growth Drivers:
- Increased focus on gold loans and co-lending partnerships, driving fee income
- Emphasis on employee productivity and technology adoption, reducing Cost to Average Assets
- Digital transformation is improving customer experience and operational efficiency
- Targeting ROA of 1% and ROE of 14-15% by FY27 as per management guidance
- Niche focus areas like school finance, retail microfinance, and supply chain finance, providing growth levers
Valuation Metrics:
- Trading at P/E ratio of 7.30-7.58x, significantly below sector average of 15-20x
- Price to Book Value of 0.85x, below 1x, suggesting undervaluation
- PEG ratio of 0.51 indicates the stock is undervalued relative to the growth rate
- Dividend yield of 0.81-0.87% with a consistent dividend payout history
- Market capitalisation of approximately ₹5,065 crore classifies it as a small-cap bank
- Attractive valuation multiple offers significant re-rating potential as performance improves
Management and Governance:
- Leadership under MD & CEO Praveen Kutty is showing strong execution capabilities
- Management has consistently delivered on stated guidance parameters
- Board composition includes experienced banking professionals and independent directors
- No major governance concerns or regulatory issues flagged
- Transparent communication with stakeholders through regular investor calls and updates
Key Risks to Monitor:
- Small-cap bank status means higher vulnerability to market sentiment and liquidity shocks
- CASA ratio below peers indicates higher cost of funds and margin pressure risk
- Geographic concentration in certain states may lead to regional economic exposure
- Competition from larger banks and fintech players in key product segments
- Regulatory changes impacting small banks could affect operations
- Slower-than-expected economic growth could impact loan demand and asset quality
Technical Sentiment:
- Technical indicators, including MACD and Bollinger Bands, show bullish signals across timeframes
- Golden cross formation (50-day MA crossing above 200-day MA) has bullish implications
- Momentum indicators suggest the stock remains in a bullish zone with room to run
- Pattern completion targets align with brokerage fundamental price targets around ₹175-200
- Short-term overbought conditions may lead to consolidation, but don't negate the bullish thesis
Trade Monitoring and Review Framework:
Daily Monitoring Checklist:
- Check price action relative to key support and resistance levels identified
- Monitor volume patterns - declining volume on pullbacks is healthy, rising volume on breakdowns is concerning
- Track broader market indices (Nifty, Bank Nifty) for sector correlation
- Review any news flow specific to DCB Bank or the banking sector
- Ensure stop loss orders are active and properly placed in the system
Weekly Review Points:
- Assess whether the stock is respecting the ascending trendline support
- Compare DCB Bank's performance relative to the Bank Nifty index and peer banks
- Review any changes in FII/DII holdings or institutional activity
- Check for any upgrades/downgrades from research analysts
- Evaluate whether to book partial profits or adjust stop losses based on price movement
Quarterly Assessment:
- Deep dive into quarterly results when announced against expectations
- Review management commentary and guidance for any changes in outlook
- Assess asset quality trends, NIM trajectory, and expense management
- Compare performance metrics with peer group banks
- Re-evaluate position size and allocation based on updated fundamentals
Red Flags to Watch:
- Any close below the ascending trendline support on high volume
- Significant deterioration in asset quality (GNPAs rising above 3.5%)
- Margin compression beyond 10 basis points in a quarter
- Negative management commentary or guidance revision downwards
- Broader banking sector entering correction phase with systematic risks emerging
My 2 Cents:
- DCB Bank presents a compelling risk-reward opportunity at current levels following a clean technical breakout
- Multi-year base formation and pattern completion project has significant upside potential
- Strong fundamentals with improving profitability, asset quality, and capital ratios support the technical picture
- Attractive valuations at 0.85x P/B and 7.5x P/E provide substantial margin of safety
- Positive sectoral tailwinds and company-specific growth initiatives enhance medium-term outlook
Full Coverage on my Newsletter this Week
Keep in the Watchlist and DOYR.
NO RECO. For Buy/Sell.
📌Thank you for exploring my idea! I hope you found it valuable.
🙏FOLLOW for more
👍BOOST if you found it useful.
✍️COMMENT below with your views.
Meanwhile, check out my other stock ideas on the right side until this trade is activated. I would love your feedback.
As per the Latest SEBI Mandate, this isn't a Trading/Investment RECOMMENDATION nor for Educational Purposes; it is just for Informational purposes only. The chart data used is 3 Months old, as Showing Live Chart Data is not allowed according to the New SEBI Mandate.
Disclaimer: "I am not a SEBI REGISTERED RESEARCH ANALYST AND INVESTMENT ADVISER."
This analysis is intended solely for informational purposes and should not be interpreted as financial advice. It is advisable to consult a qualified financial advisor or conduct thorough research before making investment decisions.
Bankingsector
YES BANK BY KRS Charts2nd Sept 2025 / 10:01 AM
Why Yes Bank ?
1. last few years YES BANK is making HH & HLs in Monthly & Weekly TFs . It has potential technically, but will check our patience.
2. Above Chart it fills up all the FVGs - Fair Value Gaps and bounced back in Month of April. As we can see in Chart mentioned recently also same FVG reversal is visible.
3. Also Potential of Reversal chart pattern at bottom of trend is also visible.🤞
4. Less than 2 Rs Risk and Almost 5 Rs Reward is making this trade Safe 👍
5. Point to be noted 20.25 Rs is nearest Resistance and Pattern Target of 28 Rs unlock After breakout of neckline at 22 Rs.

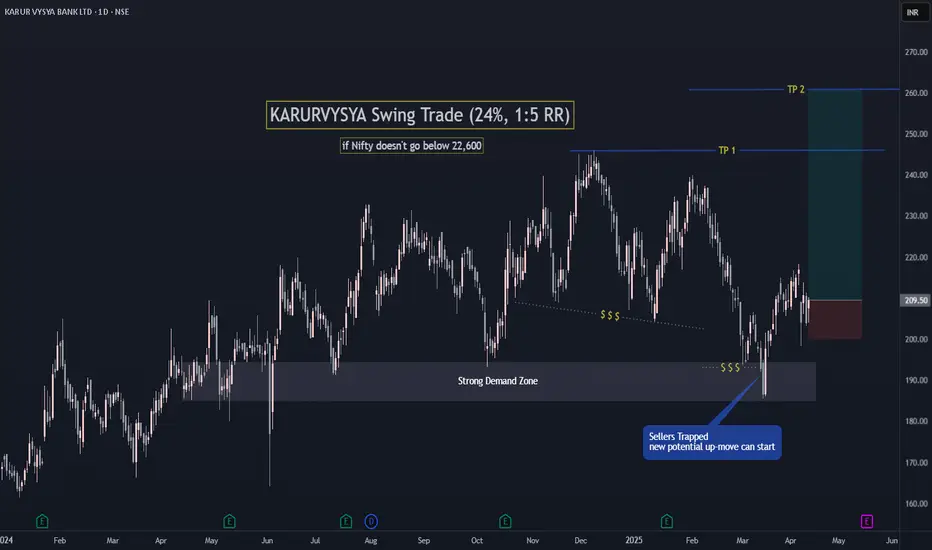
KARURVYSYA Swing Trade (24% potential, with 1:5 RR)Pretty much everything self explanatory in chart.
A very good potential trade if Nifty holds it current level ie 22,700.
Also a very good fundamental stock.
Follow for such good setups.
BANKINDIABANKINDIA is currently trading above resistance breakout and also recently has shown Inverted H&S breakout as well. Volume in recent session has been increased. If we check pattern target then it has a potential to go up to 160-70 level. I may change my view if it closes below 120. In recent time I have observed traction in all PSU banking stock. Is it something that we don't know!! Chart is indicating something to be watched very closely. Keep it on radar.

BANKNIFTYHello and welcome to this analysis
Bank Nifty appears to be in its Elliott Wave 5 that is likely headed for 57500-58000
Approximate date as per Ichimoku Time & Wave theory is around 18th June
This rally is most likely initially going to be lead by large PVT banks and towards its end by PSU Banks
Plan your trade, trade your plan

IDFC BANK LONG TERM VIEWPrice seen taking support from the key demand area of 52-58 zone
Points To Note
- EMA 10-20 Bullish Cross At Weekly TF
- Downward Trendline Breakout
- Price Is Consolidating After T-line Breakout
- Once It Gives Break Above 70.80 Then We Can See Further Upsides
Lets See What It Follows Next
Till Then , Keep Following Markets

BANK NIFTYHello & welcome to this analysis
The index is completing its pullback forming a falling trendline.
It has good support between 54500-54000 while the trendline breakout would happen above 55500.
The upside potential for this expected breakout is 57500-58000
One could either wait for the trend line breakout or buy this last leg of dip.
Whenever Bank Nifty rallies it accelerates the Nifty trend also along with other sectors. Rarely does the index move in isolation.
All the best

Big Bank BREAKOUT! Canara Bank Ready📉 Breakdown of the Setup:
✅ WTF CT (White Lines): 3+ confirmed touches → clean descending counter-trendline.
✅ Hidden Resistance (Dotted White Line): Clear breakout above key hidden level. Historic reaction zone.
✅ MTF Resistance (Yellow Line): Long-term resistance just above; nearing test zone (confluence resistance area ahead).
✅ Green Zone (Support/Resistance Flip):
Acted as strong support in 2024.
Fake breakdown trap ✔️
Price back above = bullish bias reinstated.
✅ Volume Surge: 124M+ on breakout candle ➕ major bullish close.

Smart money buying in YES BANK.YES Bank Breakout Alert
YES Bank has recently shown a strong breakout supported by high trading volume, following news that Japan's Sumitomo Mitsui Banking Corporation has received RBI approval to acquire a 51% stake in the bank.
From a technical standpoint, the chart structure indicates a bullish trend on higher time frames. If this breakout holds as genuine, the stock has the potential to test ₹22.50 and ₹28 levels in the near term — representing an upside of approximately 40% from current levels.

RBL BANKHello & welcome to this analysis
Stock has activated two bullish harmonic patterns within the same potential reversal zone - Deep Crab and Bat.
As long as it holds 135 it could retest 190-200 (gap area), above that 225-235 (area of distribution before breakdown)
Decent risk reward set up for medium term perspective

BANKNIFTYBank Nifty has taken support and shown a change of character on the daily timeframe. I’m now waiting for it to collect liquidity and retest the daily point of interest. Seeking confirmation on the one-hour timeframe would also be a prudent approach.

Is Nifty-Bank test 49700 ?Back-to-Back Evening star form on B-nifty chart weak sign, If it will give weekly closing below 52000. Deep correct may come up to 49700 again.

Bank Nifty - Triangle Pattern Alert! Big Move Ahead📈 Bank Nifty - Symmetrical Triangle in Play!
Hey Traders! 👋 Bank Nifty is forming a symmetrical triangle, indicating a potential breakout or breakdown is on the horizon. Let’s dive in:
📊 Chart Insights:
Triangle Pattern: The index is consolidating within a symmetrical triangle, with resistance around ₹51,723 and support near ₹51,063.
Key Levels:
Resistance: ₹51,723 → ₹52,004
Support: ₹51,063 → ₹50,681
Volume: Notice a decline in volume as the triangle progresses, which is typical before a breakout.
🎯 Possible Scenarios: 1️⃣ Bullish Breakout: A breakout above ₹51,723 could push Bank Nifty toward ₹52,004 and beyond.
2️⃣ Bearish Breakdown: A fall below ₹51,063 may drag it toward ₹50,681 or even ₹50,372.
💡 Trading Strategy:
For Buyers: Enter on a breakout above ₹51,723 with strong volume.
For Sellers: Look for a breakdown below ₹51,063 for shorting opportunities.
Stop Loss: Keep tight stop-loss levels depending on the breakout or breakdown direction.
⚠️ Outcome: Be patient and let the pattern resolve—this setup has the potential for a significant move in either direction.
What’s your take on this pattern? Share your views in the comments! 📩
Disclaimer:- Please always do your own analysis or consult with your financial advisor before taking any kind of trades.
Dear traders, If you like my work then do not forget to hit like and follow me, and guy's let me know what do you think about this idea in comment box, i would be love to reply all of you guy's.
Thankyou.

The CRR Cut Impact Unfolds: Banking Sector Ready for Liftoff◉ Abstract
The Reserve Bank of India's recent decision to lower the Cash Reserve Ratio (CRR) by 50 basis points to 4% is set to have a big impact on the banking sector. This change will free up about ₹1.16 lakh crore, giving banks more money to lend, especially in areas like real estate and infrastructure. As banks can now earn more from loans, their profits are likely to improve.
The stock market has responded positively, with financial stocks rising. Additionally, this CRR cut might lead to lower interest rates in the future, helping the economy grow even more. Key banking indices are showing strong upward trends, reflecting growing investor confidence.
Continue reading the full article:
The recent 50 basis points cut in the Cash Reserve Ratio (CRR) by the Reserve Bank of India (RBI) to 4% will have several key impacts on the banking sector:
1. Increased Liquidity: Approximately ₹1.16 lakh crore will be released into the banking system, enhancing banks' capacity to lend.
2. Higher Lending Potential: Banks can extend more loans, supporting economic growth, particularly in sectors like real estate and infrastructure.
3. Improved Profitability: Lower CRR can enhance banks' net interest margins as they can invest more in higher-yielding assets.
4. Positive Market Reaction: Financial stocks have shown gains, reflecting investor confidence in increased lending activities.
5. Future Rate Cuts: This move may lead to potential interest rate cuts in the near future, further stimulating economic activity.
◉ Technical Analysis
1. Nifty Bank NSE:BANKNIFTY
● The Nifty Bank index is experiencing a strong upward trend, marked by a series of higher highs and lows.
● After reaching a record peak near the 54,470 level, the index pulled back to the trendline support.
● However, following a recent bounce, it is approaching its prior high and is expected to keep rising.
2. Nifty PSU Bank NSE:CNXPSUBANK
● This index reached an all-time high around the 8,050 level before retreating to the trendline support.
● Following a bounce back, it has successfully broken through its trendline resistance and is now set for further upward movement.
◉ Stocks to Watch
1. HDFC Bank NSE:HDFCBANK
● The price has broken through its consolidation range and reached a new all-time high, with expectations of further gains.
2. State Bank of India NSE:SBIN
● The stock price has displayed a strong upward trend.
● After reaching a record high of 912, the price has entered a consolidation phase and is now trying to make a breakthrough.
◉ Overall Outlook
The CRR cut is expected to be a catalyst for market momentum. As banks capitalize on increased liquidity, the banking sector will experience growth, economic expansion will accelerate, and market sentiments will become increasingly positive.

Banknifty should fly from here! Due to rate cut expectation #NIFTYBANK action pack analysis on banking sector..are you ready??
Tomorrow is monetory policy, so there is higher probability we can see rate cut as minimum 25 basis points, so i am expecting this news is gonna to be positive specially for banking and nbfc sector, so chances are high banknifty can give solid move towards 54000, atleast 700-1000 points move possible from current level, other side 53000 is really strong support zone for intraday closing, right now price has came down, but it will surely give close above to 53000 levels. For downside we have very strong support zone at 52575-52650 which can act like strong support zone for intraday in case if we see more dip from here. Overall tomorrow mpc news is highly positive for market.
I have a trade for that
take banknifty 54000ce now at 445 you can add more in case if you get some lower levels till 390
keep strict stop loss at 300
so overall we will have 145 points stop loss
for Targets we will keep at 560/675/900++
Disclaimer:- Please always do your own analysis or consult with your financial advisor before taking any kind of trades.
Dear traders, If you like my work then do not forget to hit like and follow me, and guy's let me know what do you think about this idea in comment box, i would be love to reply all of you guy's.

Double Rounding Bottom | HDFC BANK1️⃣ News on HDFC Bank
📍IPO Launch: ₹12,500 crore IPO for its subsidiary, HDB Financial Services
📍Profit Growth: 5.3% increase in net profit for the last quarter
📍Stock Surge: HDFC Bank shares have risen nearly 20% in three months
📍Market Position: High market cap and favorable investor sentiment
2️⃣Technical Analysis
⭕️Support around ₹1,500; important for maintaining upward momentum.
⭕️Breakout above ₹1,700 for potential buy signals.
⭕️Moving averages indicate bullish momentum.
⭕️Overbought territory suggests potential short-term corrections.
⚠️Conclusion
Strong fundamentals, including solid revenue growth The merger with HDFC Ltd. enhances its market presence, but it faces some margin pressures. Overall, it’s a good time to buy HDFC Bank stocks for long-term stability and growth, while keeping an eye on potential short-term volatility.
✅Check out my TradingView profile to see how we analyze charts and execute trades.
🙋♀️🙋♂️If you have any questions about this stock, feel free to reach out to me.
📍📌Thank you for exploring our idea! We hope you found it valuable.
🙏FLLOW for more !
👍LIKE if useful !
✍️COMMENT Below your view !

Axis Bank Simple Trend Analysis!!AB can bounce from 1169 to 1189 in coming days and Ab has broken daily & weekily resistance trendline and also retested at the end on the day.
May a bounce can come if open above weekly trendline (1170) or gap up. if not another buying oppurtunity is will be at 1144 where both daily n weekly are intersecting.

HDFC Bank On the verge of Breakouthello Everyone HDFC bank about near lifetime high and resistance of trendline good Inverse head and shoulder pattern in making price is above 50 EMA RSI showing strength supported by volume.

"It’s been a year now—could this be the turning point?"❓What do you think about this merger and future growth of IDFC First Bank?
⭕️"Can IDFC First Bank still become the next HDFC Bank?"⭕️
📍An order block zone is a price range where large institutions have placed significant buy or sell orders, creating strong support or resistance. These zones often lead to price reversals or consolidations
📍It help traders identify where the "smart money" (institutional money) has previously influenced the market, giving insight into likely future price reactions around these levels.
✅Technical Analysis:-
"For now, there is a bearish trend with a strong sell sentiment. However, once the order block is confirmed, the price may shoot up like any other stock."
✅Fundamental Analysis:-
⚡️A rise in IDFC Ltd could enhance sentiment towards IDFC First Bank.
⚡️Increased stock may improve the combined entity's market valuation.
⚡️profit after tax of ₹201 crore for Q2 FY25, up 28% compared to last year
⚡️The merger aims to enhance operational efficiencies and align management practices with leading private sector banks
✍️Nifty50 is officially below the BUDGET2024 swing low as of today. The support level of 23900 was tested and sustained today. Considering the chart structure more weakness is expected.(Take this into consideration too, while investing or trading)
👀IDFC First Bank's stock has declined recently due to the following issues:
⭕️The bank experienced a 10% drop in net profit for Q4 FY24
⭕️Provisions increased to ₹722 crore, raising concerns about managing non-performing assets effectively
💡Conclusion🎯
IDFC First Bank has established itself as a significant player in the Indian banking sector, focusing on retail and corporate banking services. The recent merger with IDFC Ltd. is expected to enhance its growth trajectory and operational efficiency.
✅Check out my TradingView profile to see how we analyze charts and execute trades.
⭕️ Swing Trading opportunity: Price Action Analysis Alert !!!⭕️
🙋♀️🙋♂️If you have any questions about this stock, feel free to reach out to me.
📍📌Thank you for exploring our idea! We hope you found it valuable.
🙏FLLOW for more !
👍LIKE if useful !
✍️COMMENT Below your view !

STATE BANK OF INDIA by KRS Charts18th September 2024 / 11:11 AM
Why SBIN ❓
1. All Time Bullish Stock with Strong Fundamentals. 👌
2. Once a Resistance Now look like will worked as a Support . ✅
3. Further, Retested and made Bullish Hammer on support 🤩
Simple Bottom wick of Hammer will be SL on 1D TF closing basis 765 Rs.
Target is ATH for Now 900+

Bank Nifty ( Neowave Update)Hi everyone,
We made the last video of bank nifty past two weeks ago in which we cover from short term to long term scenerio. Here in this video we only discussed further about short term scenerio as long tem scenerio needs to updated in 4 to 6 month.
If you have any query related to this or any other stock you can leave a comment, we will surely get back to it in our next video.
Thank You.

Bank Nifty ( Long Term forecast)Hi
Everyone this is an long term forecast which is an direction movement for the next 6 month of Bank Nifity. These forecast will be updated once every month.
Thank You
Coding Details
## L stand for long Term Trend
## LA stand for correction cycle of long term trend
## M stand for Medium Term Trend
## MA stand for correction cycle of Medium term trend
## s stand for Short Term Trend
## SA stand for correction cycle of short term trend
______________________________________________ ___________
Medium & Short Term Forecast
# This forecast will be updated once a week and there will be an weekly analysis video for bank nifty.

Bank Nifty ( Neowave Forecast)Hello Everyone,
Here in this video we are discussing from long term to short term possiblities of bank nifty using Neowave.
If you have any query, you can leave a comment.
Thank You
