AXISBANK - STWP Equity Snapshot________________________________________
📊 STWP Equity Snapshot – AXISBANK
(Educational | Chart-Based Interpretation)
________________________________________
📌 Intraday Reference Levels (Structure-based)
Reference Price Zone: 1308
Risk Reference (If price weakens): 1231
Observed Upside Zones: 1401 → 1462
These levels show where price may pause, react, or move faster during short-term action.
________________________________________
📌 Swing Reference Levels
(Hybrid Model | 2–5 days | Observational)
Reference Price Zone: 1308
Risk Reference (If support fails): 1210
Higher Range Zones (If strength continues): 1503 → 1649
Swing levels help understand bigger price movement, not day-to-day noise.
________________________________________
🔑 Key Levels – Daily Timeframe
Support Areas: 1266 | 1232 | 1211
Resistance Areas: 1320 | 1341 | 1375
These are zones where price previously reacted, either by stopping, reversing, or moving faster.
________________________________________
📌 What the chart is showing (Simple view)
Trend is up
Price recently moved strongly with good volume
Earlier resistance was tested and crossed
Some resistance ahead is still weak
This means buyers are active, but price may pause at higher levels.
________________________________________
📊 Chart Structure & Indicator Summary
Structure: Higher highs and higher lows
Trend: Up
Momentum: Moderate
RSI: Around 61 – strong but not overbought
Volume: Above average – healthy participation
________________________________________
🔍 STWP Market Read
AXISBANK is showing positive price structure with improving momentum.
However, since price has already moved fast, risk remains high at higher levels.
Strength is visible — but patience and risk control matter here.
________________________________________
📈 Final Outlook (Condition-Based)
Momentum: Moderate
Trend: Up
Risk: High
Volume: Moderate
________________________________________
💡 STWP Learning Note
Strong charts do not mean easy trades.
Focus on structure, risk per trade, and review, not prediction.
________________________________________
⚠️ Disclaimer
This post is shared only for educational and informational purposes.
It is not a recommendation or investment advice.
Please consult a SEBI-registered financial advisor before making any trading or investment decision.
________________________________________
📘 STWP Approach
Observe price. Respect risk.
Let structure guide decisions — not emotions.
🚀 Stay Calm. Stay Clean. Trade With Patience.
________________________________________
💬 Did this snapshot help you understand the chart better?
🔼 Boost to support structured learning
✍️ Share your views in comments
🔁 Forward to someone learning price action
👉 Follow for simple, clean STWP insights
If you want, next I can:
Convert this into a TradingView-ready post
Or make a fixed simple template for all bank stocks
Bankingstocks

HDFC BANK LTD PARALLEL CHANNEL BREAKOUTHDFC BANK was traded in channel from past few years and made a breakout with good volume. Entry price at ₹990, with a STOPLOSS ₹940 and TARGET ₹1,190

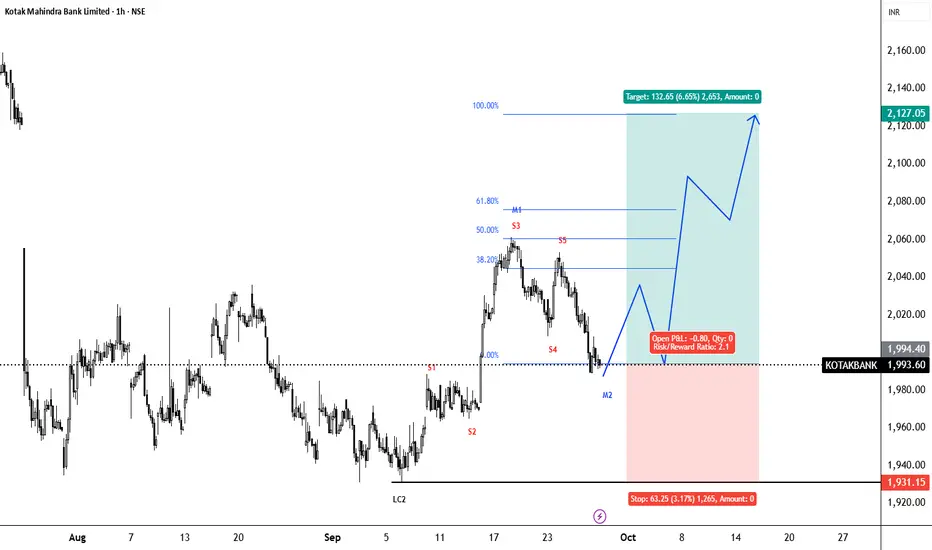
Kotak Mahindra Bank (Neowave Trading Idea)Namaskaram
Cycle - consolidated 5th up swing on Long Term Chart (Black Labelling).
Medium Cycle (Blue Labelling) giving an correction, which most likely completed.
Currently retraced 61 percent.
LTP = 2079.7
stoploss = 1,986
About Target- Well target should be above 2302.
But this price should reach before January. So if you see price is rising but not giving enough speed than exit where you get a good price.
I will also make a video on this one today and upload it here.
Thank You.

CANARA BANK ROUNDDING PATERN BREAKOUTCANARA BANK ( W )
ADD ON YOUR WATCHLIST
If you see in the chart, the rounding pattern has broken out and it is in the weekly time frame
You can buy at Rs 125 and go up to the target of 146 and 163. The stop loss can be kept at 117.50
Note: Our posts are posted for learning purposes. You are responsible for any profit or loss you make from the advice given in the channel. Before investing in the stock market, you must consult your financial advisor.
WE ARE NOT A SEBI REGISTERED

YES BANK BY KRS Charts2nd Sept 2025 / 10:01 AM
Why Yes Bank ?
1. last few years YES BANK is making HH & HLs in Monthly & Weekly TFs . It has potential technically, but will check our patience.
2. Above Chart it fills up all the FVGs - Fair Value Gaps and bounced back in Month of April. As we can see in Chart mentioned recently also same FVG reversal is visible.
3. Also Potential of Reversal chart pattern at bottom of trend is also visible.🤞
4. Less than 2 Rs Risk and Almost 5 Rs Reward is making this trade Safe 👍
5. Point to be noted 20.25 Rs is nearest Resistance and Pattern Target of 28 Rs unlock After breakout of neckline at 22 Rs.

Kotak Mahindra Bank Neowave Trading IdeaNamaskaram Everyone
I trade using Neowave and on that I have created an trading setup, which is kind of automatic entry and exit with Neowave.
Neowave is kind of a method in which you synchronize all the price action across all the time frames. It hides all the noise and tells you market is bullish or bearish.
About Stock Structure
Entry Type- Medium Term Forecast mean Entry will take 4 to 8 weeks and some times more.
Wave Structure- We are at starting point of wave, which kind of gives you an edge in riding the wave when you above your buying level
60 percent Retracement- Mean you will have easily 1:2 or 3 easy risk reward.
Doubts-If you are fearing in taking trades that mean you are taking stop loss amount more than you & your capital can handle.
Follow 1 percent rule and trail, that's it. Don't complicate life and trading.
Simply live and die. HaHA
Like and share is appreciated.
Thank You
To understand how our coding works read the below post-
NSE:KOTAKBANK NSE:KOTAKBANK1!
Smart Money Play: Watching HDFC Bank’s Bullish ZoneTrading Idea: HDFC Bank (NSE: HDFCBANK)
Price is currently trading around ₹976 after a recent pullback.
Key Observations:
Break of Structure (BOS) confirms bullish market structure.
Liquidity sweep around recent highs.
Daily Fair Value Gap (FVG) spotted between ₹910–₹930.
Bullish Order Block at ₹800–₹830 acting as strong higher timeframe support.
Plan:
Expecting a retracement into the Daily FVG zone (₹910–₹930).
If price reacts bullishly here, potential upside rally towards ₹1,040+.
Confirmation: Look for bullish reversal candles or demand zone rejections inside FVG.
Risk Management:
Aggressive entry: near FVG zone (₹910–₹930).
Conservative entry: only after bullish confirmation.
Stop-loss: below ₹890.
Targets: First TP at ₹990, extended TP at ₹1,040.
Bias: Bullish (after retracement).
Disclaimer: This is not financial advice. For educational purposes only. Please do your own research or consult with a financial advisor before making any investment decisions.

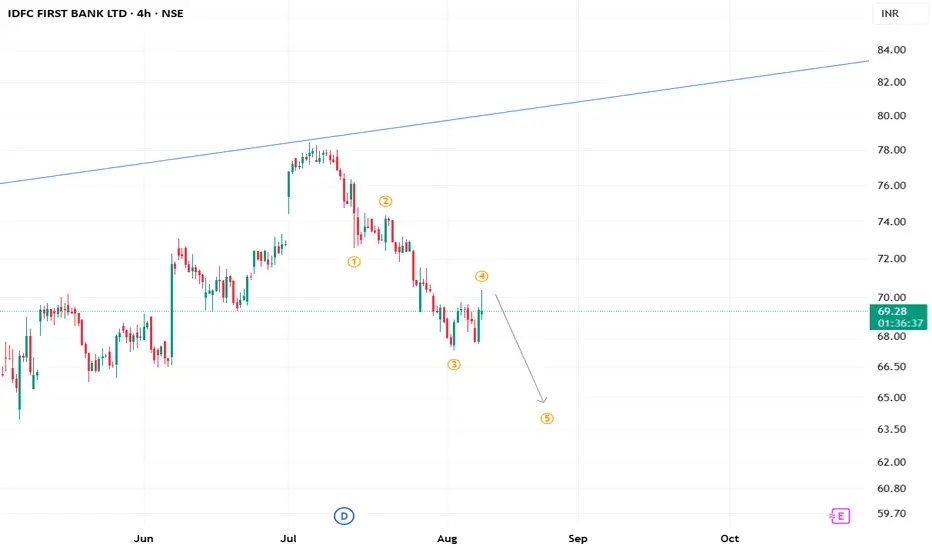
IDFC First Bank to make fresh lows?With intense pressure from the top, we may say a fresh low in IDFC First Bank. Currently looking to have completed its micro degree wave 4 in its downtrend
Keep an eye on #BandhanbankIt appears that Bandhan Bank is currently forming a corrective pattern, which may lead it to fall back to fresh lows.
Always trade with a protective stop.
**This is an educational market outlook, not investment advice. Please consult a SEBI-registered advisor before taking any investment decisions.**
Cheers,
PipVoyager

RBL BANKHello & welcome to this analysis
Stock has activated two bullish harmonic patterns within the same potential reversal zone - Deep Crab and Bat.
As long as it holds 135 it could retest 190-200 (gap area), above that 225-235 (area of distribution before breakdown)
Decent risk reward set up for medium term perspective

The CRR Cut Impact Unfolds: Banking Sector Ready for Liftoff◉ Abstract
The Reserve Bank of India's recent decision to lower the Cash Reserve Ratio (CRR) by 50 basis points to 4% is set to have a big impact on the banking sector. This change will free up about ₹1.16 lakh crore, giving banks more money to lend, especially in areas like real estate and infrastructure. As banks can now earn more from loans, their profits are likely to improve.
The stock market has responded positively, with financial stocks rising. Additionally, this CRR cut might lead to lower interest rates in the future, helping the economy grow even more. Key banking indices are showing strong upward trends, reflecting growing investor confidence.
Continue reading the full article:
The recent 50 basis points cut in the Cash Reserve Ratio (CRR) by the Reserve Bank of India (RBI) to 4% will have several key impacts on the banking sector:
1. Increased Liquidity: Approximately ₹1.16 lakh crore will be released into the banking system, enhancing banks' capacity to lend.
2. Higher Lending Potential: Banks can extend more loans, supporting economic growth, particularly in sectors like real estate and infrastructure.
3. Improved Profitability: Lower CRR can enhance banks' net interest margins as they can invest more in higher-yielding assets.
4. Positive Market Reaction: Financial stocks have shown gains, reflecting investor confidence in increased lending activities.
5. Future Rate Cuts: This move may lead to potential interest rate cuts in the near future, further stimulating economic activity.
◉ Technical Analysis
1. Nifty Bank NSE:BANKNIFTY
● The Nifty Bank index is experiencing a strong upward trend, marked by a series of higher highs and lows.
● After reaching a record peak near the 54,470 level, the index pulled back to the trendline support.
● However, following a recent bounce, it is approaching its prior high and is expected to keep rising.
2. Nifty PSU Bank NSE:CNXPSUBANK
● This index reached an all-time high around the 8,050 level before retreating to the trendline support.
● Following a bounce back, it has successfully broken through its trendline resistance and is now set for further upward movement.
◉ Stocks to Watch
1. HDFC Bank NSE:HDFCBANK
● The price has broken through its consolidation range and reached a new all-time high, with expectations of further gains.
2. State Bank of India NSE:SBIN
● The stock price has displayed a strong upward trend.
● After reaching a record high of 912, the price has entered a consolidation phase and is now trying to make a breakthrough.
◉ Overall Outlook
The CRR cut is expected to be a catalyst for market momentum. As banks capitalize on increased liquidity, the banking sector will experience growth, economic expansion will accelerate, and market sentiments will become increasingly positive.

Double Rounding Bottom | HDFC BANK1️⃣ News on HDFC Bank
📍IPO Launch: ₹12,500 crore IPO for its subsidiary, HDB Financial Services
📍Profit Growth: 5.3% increase in net profit for the last quarter
📍Stock Surge: HDFC Bank shares have risen nearly 20% in three months
📍Market Position: High market cap and favorable investor sentiment
2️⃣Technical Analysis
⭕️Support around ₹1,500; important for maintaining upward momentum.
⭕️Breakout above ₹1,700 for potential buy signals.
⭕️Moving averages indicate bullish momentum.
⭕️Overbought territory suggests potential short-term corrections.
⚠️Conclusion
Strong fundamentals, including solid revenue growth The merger with HDFC Ltd. enhances its market presence, but it faces some margin pressures. Overall, it’s a good time to buy HDFC Bank stocks for long-term stability and growth, while keeping an eye on potential short-term volatility.
✅Check out my TradingView profile to see how we analyze charts and execute trades.
🙋♀️🙋♂️If you have any questions about this stock, feel free to reach out to me.
📍📌Thank you for exploring our idea! We hope you found it valuable.
🙏FLLOW for more !
👍LIKE if useful !
✍️COMMENT Below your view !

Banknifty moments for intraday and option trading 22/Nov/2024Banknifty moments for intraday and option trading 22/Nov/2024
follow us for more updates and information.

IDFCfirst Bank CUP & Handle Breakout RetestHello Everyone,
HDFC First Bank making Retest from Cup & handle Chart pattern Breakout restest with trendline also taking Support of 200ema.
Fibbo 61% retracement completed and rsi oversold with making repeated pattern as earlier.Stock price cmp 66 is 34% down from lifetime high of 100.

FINO PAYMENTS BANK By KRSChartsDate: 5th Sept 2024
Time: 9:50 AM
WHY FINOPB?
1. As per Dow Theory, FINOPB making HHs and HLs recently which is Bullish Trade ⬆️
2. FINOPB is in Upside Channeling with Accumulations. ✅
3. Within upside channeling, Cup & Handle is also visible ☕
4. After Equal lows FINOPB has made new HH + Breakout of upside channeling or Cup & Handle Neckline ⚡
After lot of Bullish Traits in FINOPB,
Expected Targets ~521 Rs. and ~590 Rs. ❗❗❗

HDFC Bank Swing Long Setup- HDFC is currently trading at 1636
- HDFC is setting up and trying to build a base on a 4h TF
- HDFC is setting up a fair range for buyers and sellers according to this base that's what it signifies
- HDFC can take out Sell Side Liquidity before moving up to trap breakout buyers and fomo longs
- Manage risk total risk on this setup is 2% so just manage risk and look to shave 3-4% minimum

CSB BANK: Big institutions calling!CSBBANK is at strong support and currently picked by BIG FIIs. Targets are marked as per Fibo Retracement. Follow after studying the setup.
NOTE: I'm not a SEBI REG. Study before investing.

Bank Nifty for the week starting 29th july 2024.Bank Nifty on daily chart is Bearish. But on One hour chart it looks bullish. The last candle on formed on one hour chart being a Doji, we have to be very careful . Resistance is around 52000 to 52100 and if it breaks the support of 50940 then it will become bearish.
Ramakrishnan
I am not a SEBI Registered Analyst.

PNB, Intraday View for 10-JuneThe price is trading in the compression zone or in the neutral zone.
For intraday the levels of S1-122 and R1-130 are important to watch.
Above 130 - Uptrend
Below 122 - Downtrend.
Disclaimer : This is my pre market analysis and my trading journal. Not a suggestion to buy or sell.

Suryoday Bank- DO NOT MISS!Suryoday has given a good breakout of cup and handle pattern
A weekly closing above 200 can be a good signal that ATH levels can be seen soon.
Stock is available at a very good valuation.
I had seen such breakout in Spandana which had blasted after breakout.Expecting a similar move here.

HDFC Bank (Bearish Cycle started)Hi
This is an long term forecast of bank nifty, as per neowave cycles bank nifty is making bearish cycles. For complete understanding of price action do watch the video.

SBI: A Bullish TriangleUsually this wave structure forms in an impulsive sequence as wave 4 . It consists of 5 sub waves as wave-a , wave-b , wave-c, wave-d and a final setback wave-e . Each of these waves consists of three wave internal structure. Each of the waves should not break their extreme points. The final confirmation to enter the position comes when the price gets close above the level of wave-d. The minimum target of the pattern is just a poke above the level of wave-b and just above the level of wave-3 of the impulsive count. There is also a guideline to predict the target of this pattern which is known as triangular thrust. The triangular thrust is the measurement of the distance from the level of wave-a to the level of wave-b . This measured length should be kept at the point of completion of wave-e (conservative approach) or to the breakout level of wave-d to get the target of this pattern (aggressive approach).
Trading strategy: Buy on CMP 642, add on dips, keeping the SL of 627 look for the target of 660/680-85

INDUSIND BANKHello and welcome to this analysis
Bank appears to be in a lower time frame triangle suggesting the probability of a potential breakout.
Off late has been an underperformer compared to other large private banks in the recent run in the banking sector.
Extreme narrow range 1480-1540, broader range 1350-1775
Good opportunity to buy the dip and / or the breakout for probable decent upside in the medium to long term.
