Daily Nifty, smallcaps and Banknifty TalkI made educational content videos for trading, I am a Full time trade and My name is Apoorv .
General index chart and price action was discussed in this video - no bias or directions .
BANKNIFTY

#BANKNIFTY PE & CE Levels(30/01/2026)Bank Nifty is expected to open on a flat note, indicating a pause after the recent sharp upside move. The index is currently hovering near the 59950–60000 zone, which is acting as an important decision-making area. A flat opening around this range suggests that the market is digesting recent gains and waiting for confirmation before choosing the next direction. Early session price action may remain range-bound, with whipsaws possible near key intraday levels.
From a technical perspective, Bank Nifty has shown strong bullish momentum over the last few sessions, recovering sharply from lower support zones near 59000–59200. This bounce reflects aggressive buying interest and short covering, which has helped the index reclaim crucial resistance levels. However, the zone around 60000–60050 remains a major supply area. Unless the index sustains above this level with strong volumes, upside continuation may face temporary hurdles.
On the bullish side, if Bank Nifty manages to hold above 59550–59600 and shows strength above 60050, fresh long positions can be considered. A sustained move above 60050 may open the path for upside targets of 60250, 60350, and potentially 60450+ in extension. Traders should look for a strong 15-minute close above resistance to avoid false breakouts. Partial profit booking near each target is advisable, given the recent sharp rally.
On the bearish or corrective side, rejection near the 60000–60050 zone can lead to profit booking. If Bank Nifty slips below 59950–59900, short-term weakness may emerge, dragging the index toward 59750 and 59650. Further breakdown below 59450 would indicate a deeper correction, with downside targets around 59250, 59150, and 59050. The 59000–59050 zone remains a strong support area, where buyers are expected to re-enter if the decline is gradual.
Overall, the structure remains bullish as long as Bank Nifty holds above 59500, but the current flat opening hints at consolidation rather than an immediate trending move. Traders should remain patient in the opening hour, avoid chasing prices, and focus on clear break-and-sustain setups. Strict stop-loss management and disciplined execution will be crucial, as volatility may increase once the range resolves in either direction.

Bank Nifty spot 59610.45 by Daily Chart view - Weekly UpdateBank Nifty spot 59610.45 by Daily Chart view - Weekly Update
- Support Zone 58850 to 59350 for Bank Nifty
- Resistance Zone 59900 to ATH 60437.35 for Bank Nifty
- Bank Nifty seems more matured then Nifty to contain the unwarranted Geo-Political scenario and trending up for New ATH

#BANKNIFTY PE & CE Levels(29/01/2026)Bank Nifty is expected to open flat, indicating a pause in momentum after the recent sharp recovery from lower levels. Such flat openings generally signal indecision in the market, especially when the index is trading close to an important resistance zone. At present, Bank Nifty is hovering near the 59550–59600 area, which has acted as a strong supply zone in recent sessions. This makes today’s trade more level-driven, with higher chances of range-bound movement and sudden volatility around key levels.
From a broader structure perspective, the index has bounced strongly from the sub-58500 region, mainly due to short covering. However, as price approaches higher resistance zones, fresh buying strength needs confirmation. Until that happens, the market may either consolidate in a narrow range or show false breakouts followed by quick reversals. Traders should avoid anticipating moves and instead react to confirmed price action.
On the bullish side, if Bank Nifty manages to sustain above 59550 on a 15-minute closing basis, it would indicate that buyers are gaining control despite the overhead supply. In such a scenario, call options can be considered above 59550. The first upside target would be around 59750, which is a minor resistance and a good zone for partial profit booking. If momentum continues, the next levels to watch are 59850 and then 59950 or higher. Near the 60000 psychological level, strong profit booking is expected, so trailing stop-loss becomes crucial for long positions.
On the bearish side, failure to hold above 59550 followed by a breakdown below the 59450–59400 zone would indicate rejection from higher levels. This would open the door for a corrective move. In that case, put options can be considered around 59450–59400. The immediate downside targets would be 59250 and then 59150. If selling pressure increases, the index could drift toward the 59050–59000 support zone. A clear break below 59050 would weaken the structure further, though such a move would likely require negative global cues or heavy institutional selling.
For intraday traders, the zone between 59450 and 59550 should be treated as a no-trade area, as price action here can be choppy and misleading. The best trades are expected only after the market shows clear acceptance above resistance or below support. Partial profit booking at every target and strict risk management are essential due to the possibility of sudden spikes on either side.
Overall, Bank Nifty is at a crucial decision point. Sustained trade above 59550 favors bullish continuation, while rejection and breakdown below 59400 may lead to a pullback. The session is likely to be volatile but structured, rewarding traders who stick to levels, wait for confirmation, and avoid emotional or over-leveraged positions.

Bank Nifty spot 58473.10 by Daily Chart view - Weekly UpdateBank Nifty spot 58473.10 by Daily Chart view - Weekly Update
- Support Zone 57665 to 58250 for Bank Nifty
- Resistance Zone 58850 to 59350 for Bank Nifty
- Since a while the indicative Support and Resistance Zone are just an eyewash as they hardly sustain by the unprecedented Geo-Political happenings

Lets Talk about Nifty, Midcaps, Smallcaps and Banknifty A very general talk on the charts and where they are - more of a awareness sort of video- to exactly know where we are trading in terms of index . I make educational content videos for trading

Structural breakdown after a long uptrendBanknifty makes a Head & Shoulder pattern and confirms a clear breakdown below.
Expecting more selling to follow in coming months.
First target 57700.
Long term target is close to 54150. (Few months)

Intraday Institution Trading in Nifty and Banknifty BANKNIFTY Institutional Behavior
BANKNIFTY moves faster due to lower liquidity + banking stock hedging.
Institutions:
Accumulate ATM options early
Trigger stop hunts near high OI strikes
Expand range post 11:30 AM when gamma pressure builds
High-Probability Institutional Intraday Trades
VWAP Reclaim + OI Unwinding → Trend day setup
High OI Rejection + IV Drop → Mean reversion
Break of Call-Writer Zone with Volume → Momentum expansion
Institutional Rulebook
Trade levels, not emotions
Follow option writers, not candles
Price moves to hurt the maximum number of option holders

Advanced Intraday Institution Option TradingAdvanced Intraday Institutional Option Trading
Institutional intraday option trading focuses on order flow, volatility expansion, and hedging behavior, not prediction. Institutions deploy capital where liquidity, gamma, and vega sensitivity allow fast risk adjustment—usually in near-expiry (0DTE–3DTE) index options.
Institutional Interpretation
Max Call OI at 21,500 → Heavy call writing → Resistance
Rising Put OI at 21,400 → Strong downside hedge → Support
IV spike on Calls above 21,500 → Short covering risk → Breakout fuel
Balanced IV at ATM → Volatility expansion likely
High-Probability Intraday Trades
Gamma Scalping: Buy ATM options when IV expands + price holds VWAP
Directional Break: Long calls above call-writer resistance with OI unwinding
Volatility Fade: Sell options after IV spikes near key levels
Key Rule
Institutions trade structure, not direction.
Retail trades candles. Smart money trades the option chain.

Understanding Long-Term Breakouts: Lessons from JINDALSTEL📈 Understanding Long-Term Breakouts: Lessons from JINDALSTEL
1. Long-Term Breakout: Why It Matters
A long-term breakout occurs when a stock surpasses a major resistance level that has held for years.
In JINDALSTEL’s case, the August 2010 high of ₹796 was finally breached in March 2024, after nearly 14 years.
Such breakouts are significant because they often mark a shift in market perception—investors are willing to pay higher prices than ever before, signaling confidence in the company’s future.
Key Insight: The longer the resistance holds, the more powerful the breakout tends to be, as it represents years of accumulated supply being absorbed.
2. Resistance Turned Support: The Golden Rule
Once a resistance level is broken, it often becomes a new support level.
JINDALSTEL pulled back to this zone (around ₹796–₹800), tested it, and then reversed upward.
This behavior shows that buyers defended the level, confirming its importance.
Why It Matters:
Respecting resistance-turned-support validates the breakout.
It reassures traders that the move wasn’t a false breakout but a genuine shift in demand.
3. Latest High Breakout: Continuation of Buying Interest
After the pullback, the stock began breaching its latest weekly highs.
This indicates follow-up buying—new participants are entering, and existing holders are adding positions.
A breakout after a successful retest of support is often seen as a high-probability continuation pattern.
Takeaway:
Breakouts after pullbacks are stronger than straight-line moves because they show healthy consolidation and renewed demand.
4. Risk Management: The Unsung Hero
Even the strongest chart setups require disciplined risk management:
Stop-loss placement: Below the new support (₹796–₹800 zone in this case).
Position sizing: Avoid overexposure; allocate capital wisely.
Trend awareness: Long-term breakouts can be powerful, but corrections are inevitable.
Avoid chasing: Enter near support or on confirmed breakouts, not in the middle of volatile moves.
5. Investor & Trader Takeaways
For Investors:
Long-term breakouts often signal a new growth phase.
Sustaining above old highs shows structural strength in the company.
For Traders:
Respect resistance-turned-support zones—they are ideal entry points.
Breakouts after pullbacks are high conviction trades.
Always pair technical setups with risk management discipline.
✨ Final Thoughts
JINDALSTEL’s chart is a textbook example of how markets reward patience.
A 14-year breakout signals a major shift.
The pullback to support and reversal confirms strength.
The latest high breakout shows continued buying interest.
For both investors and traders, this case highlights the importance of respecting technical levels, waiting for confirmation, and managing risk effectively.

Long Term Investment What is Bank Nifty (for long-term view)
Nifty Bank tracks India’s top banking stocks (HDFC Bank, ICICI Bank, SBI, Axis, etc.).
It’s:
🚀 High growth–oriented
📉 More volatile than Nifty 50
💰 Strongly linked to credit growth, interest rates, and the economy
Long-term verdict:
Great for growth if you can tolerate volatility.
Best ways to invest in Bank Nifty for the long term
1️⃣ Bank Nifty Index Mutual Funds (BEST for most people)
Passive funds that track Bank Nifty
Ideal for SIP + long horizon (7–10+ years)
Why this works
No stock picking risk
Lower expense ratio
Automatic rebalancing
👉 Suitable if you want set it and forget it

BANKNIFTY : Intraday Trading levels and Plan for 23-Jan-2026📘 BANK NIFTY Trading Plan – 23 Jan 2026
Timeframe: 15-Minute
Gap Consideration: 100+ points
Market Structure: Short-term pullback within a volatile range, key decision zones clearly defined
🔼 SCENARIO 1: GAP UP OPENING (100+ points) 🚀
If Bank Nifty opens above the previous close with a strong gap-up, price action near resistance becomes crucial.
Opening Resistance / Consolidation Zone: 59,635 – 59,765
This zone may act as supply as it aligns with prior rejection and intraday selling pressure.
Bullish Continuation:
Sustained 15-min close above 59,765 signals strength → upside extension towards 60,000.
Rejection Setup:
Failure to hold above 59,635 may lead to pullback towards the flat opening range.
Options Strategy:
Bull Call Spread (Buy ATM CE + Sell OTM CE) to reduce theta risk.
➡️ SCENARIO 2: FLAT / RANGE OPENING ⚖️
A flat open indicates indecision; patience is key.
No-Trade / Chop Zone: 59,197 – 59,412
Expect whipsaws and option premium decay.
Bullish Bias:
Acceptance above 59,412 → targets 59,635 → 59,765.
Bearish Bias:
Breakdown below 59,197 → drift towards 58,923.
Options Strategy:
Short Strangle / Iron Condor only if price remains inside range with strict SL.
🔽 SCENARIO 3: GAP DOWN OPENING (100+ points) 📉
A gap-down open tests buyer strength immediately.
Opening Support (Gap Down Case): 58,923
First reaction zone for buyers.
Intraday Support Breakdown:
Below 58,923 → increased probability of move towards 58,501 – 58,577.
Pullback Short Setup:
If price retests 59,197 and rejects, short continuation trades are favored.
Options Strategy:
Bear Put Spread (Buy ATM PE + Sell lower strike PE) to cap risk.
🛡️ OPTIONS RISK MANAGEMENT TIPS 🧠
Avoid naked option buying near no-trade zones.
Use spreads to control theta decay.
Risk only 1–2% of capital per trade.
Book partial profits quickly in volatile markets.
No revenge trades after SL hit.
📌 SUMMARY & CONCLUSION ✨
59,197 – 59,412 remains the key decision zone.
Directional trades only after clear acceptance or rejection.
Gap days demand discipline, not aggression.
Let price confirm, then execute with defined risk.
⚠️ DISCLAIMER
This analysis is for educational purposes only. I am not a SEBI registered analyst. Markets are risky, and trades can go wrong. Please consult your financial advisor before trading. 🙏

CONSOLIDATION IN STOCKS ? Lets Elobrate Base Chart ADANIENSOLConsolidation in technical analysis refers to a period when a stock trades within a tight range, showing indecision between buyers and sellers. It’s important because breakouts from consolidation often signal strong moves. Traders typically enter after a confirmed breakout, manage risk with stop-losses, and remember that patience and discipline are key takeaways.
📊 What is Consolidation in Technical Analysis?
Definition: Consolidation occurs when a stock’s price moves sideways within a defined range of support and resistance, reflecting market indecision.
Visual Pattern: Prices form horizontal channels, triangles, or rectangles.
Market Psychology: Buyers and sellers are balanced, waiting for new information or momentum before committing.
🌟 Importance of Consolidation
Signals Pause Before Trend Continuation or Reversal: Consolidation often precedes major moves.
Helps Identify Breakout Opportunities: Traders watch for volume spikes and price moves beyond support/resistance.
Reduces Noise: It filters out random fluctuations, giving clearer entry signals.
🎯 When to Enter Stocks
Breakout Entry: Enter after price breaks above resistance (bullish) or below support (bearish).
Confirmation Needed: Look for increased trading volume to validate the breakout.
Avoid Premature Entry: Entering inside the consolidation range can lead to false signals.
⚖️ Risk Management After Entry
Stop-Loss Placement:
For long trades: just below support.
For short trades: just above resistance.
Position Sizing: Risk only a small percentage of capital per trade (commonly 1–2%).
Trailing Stops: Adjust stops as the trend develops to lock in profits.
Avoid Overtrading: Consolidation can last longer than expected; patience is crucial.
🧠 Investor/Trader Key Takeaways
Patience Pays: Consolidation is a waiting game; don’t rush entries.
Volume is Critical: Breakouts without volume often fail.
Discipline in Risk Management: Always define risk before entering.
Adaptability: Consolidation can lead to continuation or reversal—be prepared for both.
Mindset: Treat consolidation as preparation, not stagnation.
👉 The essence: Consolidation is the calm before the storm. Smart traders wait for the breakout, confirm with volume, and manage risk tightly. Different consolidation patterns are like triangles, flags, rectangles

#BANKNIFTY PE & CE Levels(22/01/2026)A slightly gap-up opening is expected in Bank Nifty, indicating a mild positive sentiment after the recent sharp sell-off and recovery from lower levels. However, despite the gap-up bias, the broader structure still reflects high volatility and a weak-to-range-bound trend, so traders should avoid aggressive directional bets at the open and wait for price confirmation around key levels.
Market Structure & Price Context
Bank Nifty has witnessed a strong bearish impulse in the previous sessions, followed by a sharp bounce from the lower demand zone near 58,550–58,450. This bounce looks more like a technical pullback rather than a confirmed trend reversal. The index is now trading below major resistance zones, suggesting that upside may remain capped unless key levels are decisively reclaimed.
The slightly gap-up opening is likely to test nearby resistance areas quickly. If the gap sustains with follow-through buying, short-term upside moves are possible; otherwise, selling pressure may re-emerge from higher levels.
Key Resistance Zones (Sell on Rise / Short Bias Areas)
- 59,450–59,500: This is a crucial supply zone and previous breakdown area. Any move towards this level without strong volume confirmation may face selling pressure.
- Above 59,450, if price shows rejection or bearish candles, PE buying / short trades can be considered with targets around 59,250 → 59,150 → 59,050.
- A decisive breakout and sustain above 59,500 would weaken the bearish bias and open the door for a larger pullback.
Reversal Buy Zone (Intraday / Short-term Bounce Setup)
- 59,050–59,100 is an important reversal demand zone.
- If Bank Nifty holds above this zone and shows bullish confirmation (strong candles, higher low formation), a reversal Buy CE setup is possible.
- Upside targets for this move are 59,250 → 59,350 → 59,450+.
- This trade should be treated as a counter-trend or pullback trade, so strict stop-loss discipline is essential.
Breakdown & Bearish Continuation Levels
- Below 58,950–58,900, selling pressure may increase again.
- PE buying below 58,950–58,900 can be planned with targets at 58,750 → 58,650 → 58,550.
- A further breakdown below 58,450 would confirm bearish continuation and may drag the index towards 58,250 → 58,150 → 58,050 in the coming sessions.
Trading Approach for the Day
- Expect initial volatility due to the slightly gap-up opening.
- Avoid trading immediately at the open; let the first 15–30 minutes define direction.
- Focus on level-based trades, not emotional entries.
- Prefer sell-on-rise strategy near resistance unless the index shows strong acceptance above 59,500.
- Keep position sizes light and trail profits aggressively due to fast intraday swings.
Overall View
The broader trend remains bearish to sideways, with the current gap-up likely to be a relief move rather than a trend change. Clear directional strength will only emerge if Bank Nifty sustains above major resistance or breaks decisively below key supports. Until then, disciplined, level-driven trading with strict risk management is the best approach.

Option TradingRetail and Institutional Option Trading
Retail traders usually focus on buying options, hoping for fast price movement. Institutions, on the other hand, mostly sell options because time decay (Theta) works in their favor.
Key differences:
Retail traders chase momentum and news
Institutions focus on probability, statistics, and data
Retail uses indicators
Institutions use Option Chain, OI, volume, and volatility
Retail looks for big wins
Institutions look for consistent returns
Institutions understand that 90% of options expire worthless, which is why option writing dominates institutional strategies.

Hindustan Copper Limited – A Case in Point📊 Understanding the Rounding Bottom Pattern in Long-Term Charts
Hindustan Copper Limited, currently trading near ₹538, has displayed a rounding bottom formation since its listing in 2010. After years of decline and consolidation, the stock is now approaching its listing highs, reflecting a long-term structural recovery. This setup highlights how patience in long-term charts can reward investors, while disciplined risk management ensures traders don’t get caught in false moves.
Understanding the Rounding Bottom Pattern in Long-Term Charts
📈 What is a Rounding Bottom Pattern?
A rounding bottom pattern (also called a saucer bottom) is a long-term technical chart formation that signals a gradual shift from a bearish phase to a bullish one. It typically develops over months or years, showing a slow decline in price, stabilization at the bottom, and then a gradual recovery. The shape resembles a "U" or a bowl, reflecting investor sentiment moving from pessimism to optimism.
Key characteristics:
Extended duration: Often spans several years.
Gradual transition: No sharp reversals; instead, a slow and steady change in trend.
Volume behavior: Declines during the downtrend, stabilizes at the bottom, and rises as the breakout nears.
🌍 Importance on Long-Term Charts
Signals structural reversal: Especially powerful when seen on monthly or weekly charts, as it suggests a fundamental change in market perception.
Applicable to newly listed stocks: For companies that fell after listing, a rounding bottom can mark the end of long-term underperformance.
Investor confidence: Breakouts from such patterns often attract institutional interest, as they indicate sustained demand.
⚖️ Risk Management in Such Criteria
Even though rounding bottoms are strong reversal signals, risk management is crucial:
False breakouts: Prices may test resistance multiple times before a clean breakout.
Stop-loss placement: Traders should place stops below the midpoint of the pattern or recent support.
Position sizing: Avoid overexposure; long-term setups require patience and capital discipline.
Macro factors: Always consider industry cycles, commodity prices, and broader market sentiment.
💡 Traders’ & Investors’ Takeaways
For traders: The breakout above the neckline (previous highs) is the key entry point. Momentum traders often ride the rally post-breakout.
For investors: The pattern reflects a fundamental turnaround. Long-term investors may accumulate during the consolidation phase, anticipating sustained growth.
Psychological shift: The pattern embodies a transition from despair to renewed optimism, making it a powerful sentiment indicator.

Sbicards looks bullish?!!!yes!!!
Sbicards has been travelling inside a expanding channel pattern making successive highs and higher highs and lows and higher lows.
In daily time frame too stock is seen bullish
View changes to bearish on making the lower low(sl level- 829.65)
better to enter after 15 min Volume breakout out as shown
Nothing much more to explain as everything seems clear on looking @ chart!!!
Just my view...not a tip nor advice!!!!
Thank you,
mmjimm

Understanding Trend Breakouts, RSI Signals and Risk Management📈 Understanding Trend Breakouts, RSI Signals, and Risk Management in Trading : Base Chart UNION BANK OF INDIA
Union Bank of India’s stock currently presents a compelling opportunity as it has successfully broken out of its long-term downtrend and is sustaining above the trendline, signaling a confirmed reversal in sentiment. The price action is now forming higher highs and higher lows, a classic bullish structure that often precedes further upward momentum. With the RSI holding above 50 and now approaching the 70 zone, momentum indicators are aligning with price strength, suggesting strong buying interest. For investors and traders, this setup highlights a favorable risk-reward scenario, where disciplined risk management—such as using stop-losses and position sizing—can help capitalize on the breakout while safeguarding against volatility.
Lets elobrate the study....
🔹 The Significance of Long-Term Downtrends
Definition: A long-term downtrend occurs when a stock consistently makes lower highs and lower lows over an extended period.
Investor Psychology: It reflects persistent bearish sentiment, where sellers dominate buyers.
Why It Matters: Recognizing a downtrend helps traders avoid premature entries and understand the broader market context.
✅ Breakout Above the Downtrend Line
Trendline Break: When a stock sustains above its long-term downtrend line, it signals a potential trend reversal.
Confirmation: Sustained price action above the line, supported by volume, indicates that buyers are gaining control.
Implication: This often marks the beginning of a new bullish phase, where higher highs and higher lows start forming.
🔹 RSI (Relative Strength Index) as a Momentum Indicator
RSI Basics: RSI measures momentum on a scale of 0–100.
Below 30 → Oversold (potential reversal upward).
Above 70 → Overbought (potential reversal downward).
Importance of RSI Above 50:
RSI consistently above 50 suggests bullish momentum.
It indicates that average gains outweigh average losses.
RSI Moving Toward 70:
Crossing into the 70+ zone reflects strong buying strength.
While it can signal overbought conditions, in trending markets it often supports continued bullishness.
🔹 Risk Management Principles
Even with strong technical signals, risk management is essential:
Position Sizing: Never allocate more capital than you can afford to lose.
Stop-Loss Orders: Protect against sudden reversals by setting predefined exit points.
Diversification: Avoid concentrating all investments in one stock or sector.
Avoid Emotional Trading: Stick to your plan; don’t chase prices or panic sell.
🔹 Key Takeaways for Investors & Traders
Trend Reversal: Sustained breakout above a long-term downtrend line is a powerful bullish signal.
Momentum Confirmation: RSI above 50, moving toward 70, strengthens confidence in the trend.
Breakout Opportunities: Higher highs and higher lows formation confirms the stock’s bullish structure.
Risk Discipline: Technical signals are valuable, but risk management ensures long-term survival in markets.
Balanced Approach: Combine technical analysis with sound trading psychology and portfolio management.
📌 Final Thought: Technical indicators like trendlines and RSI provide valuable insights, but they are not foolproof. The most successful traders blend technical signals with disciplined risk management, ensuring they ride profitable trends while protecting themselves from unexpected market shifts.

[INTRADAY] #BANKNIFTY PE & CE Levels(20/01/2026)A flat opening is expected in Bank Nifty, indicating indecision after the recent volatile moves. The index is opening near the 59,800–59,900 zone, which continues to act as a short-term balance area where buyers and sellers are actively competing. This suggests that the market is still in a consolidation phase and is waiting for a clear trigger to decide the next directional move. Early price action is likely to remain choppy, with whipsaws possible near key intraday levels.
On the upside, the crucial level to watch remains 60,050–60,100. A sustained move and acceptance above this zone will indicate renewed buying strength. If Bank Nifty manages to hold above 60,050, bullish momentum can gradually build, opening the path for CE buying opportunities. In such a scenario, upside targets are placed at 60,250, followed by 60,350, and 60,450+, where strong supply zones are expected. A breakout above these levels may also invite short covering, accelerating the move higher.
On the downside, the 59,950–59,900 area is acting as immediate intraday support. Any rejection or failure to sustain above this zone may increase selling pressure. A breakdown below 59,900 can trigger PE buying, with downside targets at 59,750, 59,650, and 59,550. If weakness extends further and the index slips below 59,450, it would confirm bearish dominance, opening deeper downside levels toward 59,250, 59,150, and 59,050.
Overall, the structure suggests a range-bound and level-based trading session unless a decisive breakout or breakdown occurs. Traders should avoid aggressive early entries and focus on confirmation-based trades near the mentioned levels. Scalping and short-term positional trades with strict stop-loss and disciplined risk management will be more effective than directional bets until the market clearly breaks out of this consolidation range.

BANK NIFTY - Technical Analysis Bank Nifty is showing an interesting setup on the weekly chart.
After breaking out above its previous all-time high, the index has started contracting in a tight range, indicating healthy consolidation.
On the daily timeframe, it continues to take support near the 9 EMA, and during minor dips, it has also reversed from the 20 EMA, reflecting strong buying interest.
If Bank Nifty breaks out of this range with momentum, the upside potential remains open, sky’s the limit.
In case of a pullback, watch these key support zones:
🟩 57,500 – first immediate support
🟩 57,160 – secondary support
🟩 56,600 – third support
🟩 56,000 – major support zone if deeper retracement occurs
Overall market structure is Bullish, and a bit more consolidation or a short pullback will only strengthen the base for a sustained breakout.
✅ If you like my analysis, please follow me here as a token of appreciation :)
in.tradingview.com/u/SatpalS/
📌 For learning and educational purposes only, not a recommendation. Please consult your financial advisor before investing.

Banknifty 15min TrendlineOn the 15-minute timeframe, Bank Nifty is forming a rising support trend line. Price is repeatedly taking support near this line, showing buying interest at lower levels. As long as this support holds, the short-term structure remains positive. A break below this support line may lead to quick downside, while holding above it can support a bounce or continuation move.

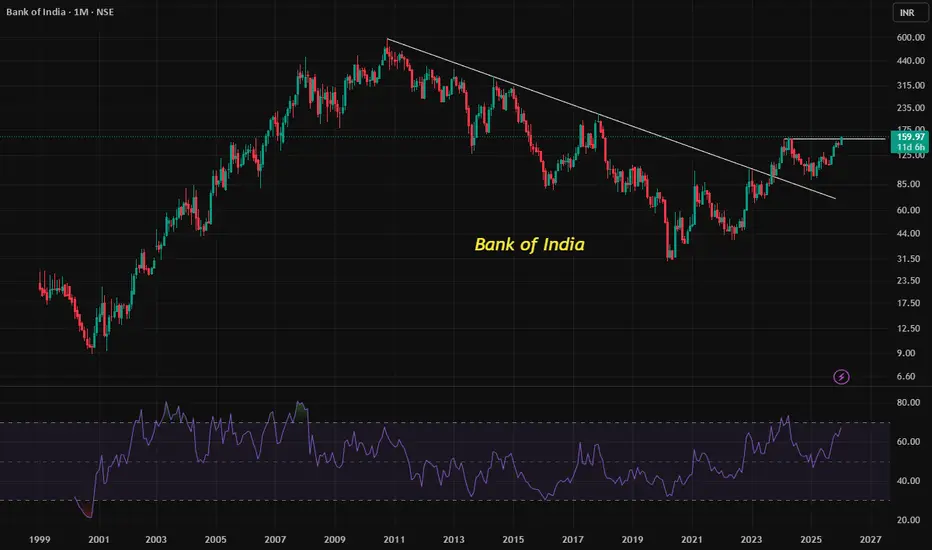
Understanding Long-Term Breakouts & RSI Strength in Stock TrendUnderstanding Long-Term Breakouts and RSI Strength in Stock Trends : Base Chart BANK OF INDIA (BANKINDIA)
📈 Long-Term Downtrend Breakout
A long-term downtrend line represents a period where a stock has consistently moved lower, connecting its major peaks over months or years.
When a stock breaks above this line, it signals a potential end to prolonged weakness.
This breakout often attracts new buyers, as it suggests the stock may be entering a fresh bullish phase.
Importantly, the breakout is not just about crossing the line—it must be sustained above it to confirm strength. Temporary moves above the line without follow-through are often false signals.
🔑 Importance of Sustaining Above the Breakout
Sustaining above the breakout level shows follow-up buying interest:
It means investors are not just reacting to the breakout but are continuing to accumulate the stock.
This sustained action builds confidence that the breakout is genuine and not a short-lived spike.
In technical analysis, this is often referred to as confirmation of breakout strength.
📊 Uptrend Formation in Interim Trends
After a breakout, the stock’s behavior in shorter-term trends (weekly or monthly swings) becomes crucial.
Formation of higher highs and higher lows in interim trends is a classic sign of an uptrend.
This pattern reflects consistent demand, where buyers step in at higher levels each time.
For traders, this is a positive sign that the stock is not just stabilizing but actively building momentum.
💡 RSI as a Strength Indicator
The Relative Strength Index (RSI) is a momentum oscillator that measures the speed and change of price movements.
RSI above 50 generally indicates bullish momentum, while below 50 suggests bearishness.
In this case, RSI has stayed above 50 since 2022, showing persistent strength.
Recently, RSI moving above 60 adds further conviction, signaling additional buying interest and stronger momentum.
Sustained RSI levels above 60 often align with healthy uptrends, reinforcing the bullish outlook.
📝 Key Takeaways
Breakout of a long-term downtrend marks a potential shift from weakness to strength.
Sustaining above breakout levels confirms genuine buying interest and reduces the risk of false signals.
Higher highs in interim trends reflect continued demand and a strong uptrend formation.
RSI above 50 and rising above 60 highlights persistent and growing buyer enthusiasm.
Together, these factors suggest that the stock is not only recovering but also building a strong foundation for continued upward movement.
[INTRADAY] #BANKNIFTY PE & CE Levels(19/01/2026)Based on the current chart structure, Bank Nifty is indicating a gap-down opening below the 59,950 level, which is an important short-term pivot zone. This gap-down suggests early weakness and cautious sentiment at the opening, especially after the index failed to sustain above the previous resistance band. However, the broader structure still shows that the market is trading within a well-defined range, and the day’s direction will largely depend on how price behaves around the marked support and resistance levels.
Intraday Structure & Key Observations
- The 59,950–60,050 zone has acted as a crucial decision-making area in recent sessions. A gap-down below this zone indicates that sellers are active, but confirmation will only come if price sustains below this level after the first 15–30 minutes.
- The 60,050–60,110 region now becomes an immediate resistance. Any pullback towards this zone should be closely watched for rejection or acceptance.
- The upper resistance near 60,450 remains a major supply zone. Only a strong breakout and sustained move above this level would shift the intraday bias clearly towards bullish continuation.
Bullish Scenario (CE Side)
- If Bank Nifty manages to recover and sustain above 60,050, it may indicate that the gap-down was a false breakdown or an opening trap. In such a case:
- Buying opportunities can be considered above 60,050–60,100 with confirmation.
- Upside targets would be 60,250, 60,350, and 60,450+.
- Price acceptance above 60,110 with strong candles would strengthen the bullish case.
This scenario would reflect strong buying interest at lower levels and could lead to a short-covering move.
Bearish Scenario (PE Side)
- If the index fails to reclaim 59,950 and continues to trade below it:
- Selling pressure is likely to dominate.
- Below 59,950–59,900, downside targets open up at 59,750, 59,650, and 59,550.
- A deeper breakdown below 59,450 can accelerate the fall towards 59,250, 59,150, and 59,050.
- This would confirm that the gap-down opening is being accepted by the market, indicating a bearish continuation day.
Trading Approach & Risk Management
- Expect initial volatility due to the gap-down opening; avoid aggressive trades in the first few minutes.
- Wait for price confirmation near key levels rather than predicting direction.
- Trade with strict stop-losses and consider partial profit booking at intermediate targets.
- If price remains stuck between 59,950 and 60,050, the session may turn into a range-bound or whipsaw day.
Overall View
The immediate bias remains cautious to bearish due to the gap-down opening below 59,950. However, a quick recovery above 60,050 can neutralize this weakness. Today’s trade will be purely level-based, and discipline will be key. Let the market confirm direction before committing to larger positions.
