BANKNIFTY - Trading levels and Plan for 13-Nov-2025📊 BANK NIFTY TRADING PLAN — 13 NOV 2025
(Timeframe Reference: 15-Min Chart)
Chart Summary:
Bank Nifty closed near 58,211 , maintaining a balanced posture after strong intraday volatility. The index is hovering around the Opening Support / Resistance Zone (58,136 – 58,250) , indicating consolidation before the next directional move. Above this range lies Opening Resistance at 58,381 and Last Intraday Resistance at 58,611 , which will be key upside checkpoints for bullish continuation.
On the downside, 57,927 serves as the Last Intraday Support , and a breach below this could invite fresh short-term weakness. Traders should monitor how the market reacts around 58,136–58,250 in the initial phase to plan directional entries.
Key Levels to Watch:
🟩 Supports: 58,136 / 57,927
🟥 Resistances: 58,381 / 58,611 / 58,718
⚖️ Neutral Zone: 58,136 – 58,250 (No clear bias zone)
🟢 Scenario 1: GAP-UP Opening (200+ Points)
If Bank Nifty opens above 58,400 – 58,450 , it will enter the Opening Resistance zone right from the start. Bulls will need strong volume confirmation to sustain this breakout.
If price sustains above 58,381 for 15–20 minutes with strong bullish candles, expect a move toward 58,611 – 58,718 .
However, if price rejects near 58,611 , profit booking may push it back toward 58,381 – 58,250 .
For aggressive traders — wait for a retest of 58,381 post-breakout before entering long positions for better confirmation.
For positional bias, a daily close above 58,611 would strengthen bullish continuation for the next sessions.
💡 Educational Note:
A gap-up near resistance often traps impulsive buyers. Always wait for confirmation — a retest and hold above resistance signals genuine breakout strength, while a quick rejection hints at a bull trap. The key is patience, not prediction.
🟧 Scenario 2: FLAT Opening (Within 58,136 – 58,250 Zone)
If Bank Nifty opens flat within this tight range, the initial candles may show sideways movement or low volatility before a breakout defines direction.
Avoid trading inside this zone initially — the first 15 minutes are crucial to identify market intent.
If the index breaks and sustains above 58,250 , bulls can target 58,381 – 58,611 .
If it breaks below 58,136 , weakness may extend toward 57,927 .
Always track volume — low-volume breakouts are unreliable and prone to reversals.
🧠 Educational Tip:
Flat openings are tests of patience. Traders who rush into early trades often get caught in false breakouts. The key to success in range-bound zones is to wait for confirmation with volume and momentum alignment. Remember — no trade is better than a bad trade.
🔴 Scenario 3: GAP-DOWN Opening (200+ Points)
If Bank Nifty opens around 57,950 – 57,900 , it will test the Last Intraday Support (57,927) . Bulls will need to defend this zone to prevent a deeper correction.
If price forms bullish reversal candles (hammer, bullish engulfing) near 57,927 , a short-covering rally toward 58,136 – 58,250 can occur.
If the index fails to hold 57,927 , expect further downside toward 57,700 – 57,550 .
Avoid panic shorting after a big gap-down — instead, wait for pullbacks to 58,000 – 58,136 for higher probability entries.
Falling volume on red candles at support suggests exhaustion, hinting at a potential reversal setup.
📘 Educational Insight:
Gap-downs tend to trigger emotional decisions. Smart traders use the panic phase to identify exhaustion points. Watch for long wicks or failed breakdowns near major supports — these are often signs of institutional buying or short-covering.
💼 RISK MANAGEMENT TIPS FOR OPTIONS TRADERS:
Avoid trading options during the first 15 minutes — initial IV spikes can distort premium values.
Never risk more than 1–2% of total capital per trade.
Use ATM or ITM options for cleaner movement and lower theta decay. Avoid deep OTM options unless a breakout is confirmed.
Trail stop-losses aggressively once your trade moves 30–40 points in your favor.
Always book partial profits near key support/resistance zones.
Avoid averaging into losing positions — cut losses quickly and preserve capital for the next opportunity.
📈 SUMMARY:
🟧 Neutral Zone: 58,136 – 58,250
🟥 Resistance Zones: 58,381 / 58,611 / 58,718
🟩 Support Zones: 58,136 / 57,927
⚖️ Bias: Bullish above 58,250 | Bearish below 58,136
📚 CONCLUSION:
Bank Nifty’s movement for 13 Nov will depend on how it reacts around the 58,136 – 58,250 consolidation zone. A breakout above 58,250 can trigger bullish continuation toward 58,611 – 58,718 , while a breakdown below 58,136 could drag it back to 57,927 .
Traders should focus on confirmation over anticipation. Avoid overtrading during indecisive price action, and let volume and momentum guide entries.
📊 Remember: Trading is not about catching every move — it’s about catching the right move with controlled risk.
⚠️ DISCLAIMER:
I am not a SEBI-registered analyst . The above analysis is purely for educational and informational purposes . Please do your own research or consult a certified financial advisor before taking any trading or investment decisions.
Bankniftyanalysis

BANKNIFTY : Trading levels and plan for 12-Nov-2025📊 BANK NIFTY TRADING PLAN — 12 NOV 2025
(Timeframe Reference: 15-Min Chart)
Chart Summary:
Bank Nifty closed near 58,148 , showing strong recovery momentum after multiple sessions of consolidation. The index is now trading near the Opening Resistance / Support Zone (58,158 – 58,258) and just below a crucial supply zone between 58,520 – 58,614 , which is marked as the Opening / Last Intraday Resistance Zone .
The market structure indicates that a breakout above 58,258 could invite strong buying momentum, while rejection from higher levels may trigger intraday profit booking. Bulls will aim to sustain above 58,258 to maintain upward strength, while bears may defend the 58,520–58,614 zone aggressively.
Key Zones to Watch:
🟩 Supports: 58,011 / 57,888
🟥 Resistances: 58,258 / 58,520 – 58,614
⚖️ Neutral Zone: 58,158 – 58,258
🟢 Scenario 1: GAP-UP Opening (200+ Points)
If Bank Nifty opens near or above 58,350 – 58,400 , it will immediately test the upper resistance area. Sustaining above 58,520 will be the key to continuing the bullish trend.
If the index sustains above 58,520 with strong bullish candles and high volume, it can target the next resistance near 58,614 , followed by 58,750 .
However, if rejection occurs near 58,520 – 58,614 , expect a pullback toward 58,258 – 58,158 .
Traders should wait for a retest of 58,520 post-breakout before entering long positions for confirmation and better risk control.
If prices show exhaustion or wicks near 58,614 , book profits partially — the zone has historically triggered intraday reversals.
💡 Educational Note:
Gap-up openings around key resistance levels often create excitement but also carry the highest risk of false breakouts. Wait for confirmation — a solid candle close above resistance on good volume indicates institutional buying. Without this, early entries can lead to quick reversals.
🟧 Scenario 2: FLAT Opening (Within 58,158 – 58,258 Zone)
If Bank Nifty opens flat within this range, early consolidation is likely. The first 15–30 minutes may witness sideways price action before a breakout establishes direction.
Avoid taking fresh trades inside this zone initially — this is the indecision band.
If price breaks above 58,258 and sustains, expect upward momentum toward 58,520 – 58,614 .
If price breaks below 58,158 , weakness may emerge, pulling the index back toward 58,011 – 57,888 .
Watch volume confirmation before entering — low-volume moves inside this zone are prone to reversal.
🧠 Educational Tip:
Flat openings favor patient traders. The key is to wait for market structure confirmation. The breakout from the first range usually defines the day’s dominant move. Most false trades occur when traders act before confirmation — staying observant pays more than staying active.
🔴 Scenario 3: GAP-DOWN Opening (200+ Points)
If Bank Nifty opens near 57,950 – 57,900 , the index will test the Opening Support Zone (58,011 – 57,888) . This area is vital for bulls to defend in order to sustain short-term uptrend structure.
If bullish reversal candles form near 57,888 (hammer or bullish engulfing), buyers may attempt to push the index back toward 58,158 – 58,258 .
However, if price breaks below 57,888 decisively with strong red candles and high volume, further weakness can extend toward 57,700 – 57,520 .
Avoid shorting immediately after a gap-down; instead, wait for a pullback toward resistance zones like 58,011 – 58,158 for higher probability trades.
Volume near support is key — declining volume on red candles indicates potential exhaustion and an upcoming reversal setup.
📘 Educational Insight:
Gap-downs are emotionally charged opens — many traders panic-sell into support zones. Experienced traders watch for exhaustion or reversal patterns to catch short-covering bounces. The best opportunities arise when the crowd reacts emotionally and you act logically.
💼 RISK MANAGEMENT TIPS FOR OPTIONS TRADERS:
Avoid trading options during the first 15 minutes after open — IV spikes can inflate premiums and result in quick time decay.
Always risk a maximum of 1–2% of total capital on any single trade.
Prefer ITM options for directional moves; they carry less decay and provide better correlation with the underlying index.
Trail stop-loss after 30–40 points of favorable movement to lock in profits.
Book partial profits near resistance or support zones — consistent small wins compound faster than rare big wins.
Avoid averaging down on losing positions — capital protection is priority number one.
📈 SUMMARY:
🟧 Key Neutral Zone: 58,158 – 58,258
🟥 Resistance Zones: 58,520 – 58,614
🟩 Support Zones: 58,011 / 57,888
⚖️ Bias: Bullish above 58,258 | Weakness below 58,158
📚 CONCLUSION:
Bank Nifty is approaching a critical juncture near 58,258 , where a decisive breakout can fuel continuation toward 58,614 , while rejection may trigger a healthy correction toward 58,011 – 57,888 .
The day’s success will depend on trader patience and ability to react to confirmation rather than anticipation. Respect the levels, avoid chasing moves, and focus on disciplined execution.
📊 Remember: In trading, the calmest mind often makes the clearest decisions. Let the price lead; your analysis should follow.
⚠️ DISCLAIMER:
I am not a SEBI-registered analyst . The analysis shared here is purely for educational and informational purposes . Please conduct your own research or consult a certified financial advisor before making any trading or investment decisions.

Banknifty facing strong hurdleBanknifty is facing a strong hurdle at 58,000 and is quoting below the pink hurdle trendline. Further downside could be seen in the coming weeks till 56,700. If breaks then a major fall till 54,000 till december won't be surprising given the fact that FIIs usually exit the markets in december leading to a temporary correction.

BANKNIFTY : Trading levels and plan for 11-Nov-2025📊 BANK NIFTY TRADING PLAN — 11 NOV 2025
(Timeframe Reference: 15-Min Chart)
Chart Summary:
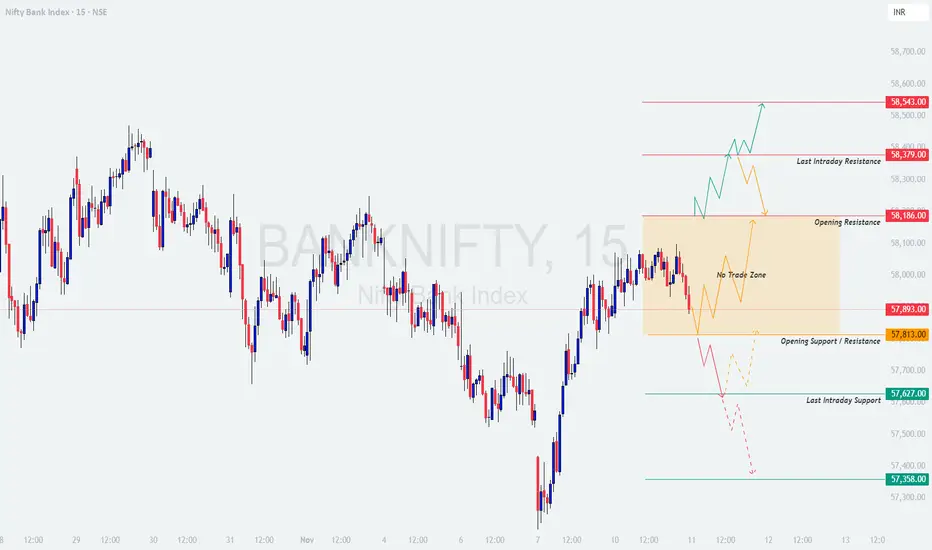
Bank Nifty closed near 57,893 , sitting right in the middle of a No-Trade Zone (57,813 – 58,186) . This range highlights a zone of indecision where both bulls and bears are currently fighting for control.
The price structure shows a potential breakout setup: a move beyond this zone could lead to a sharp intraday trend, while remaining within it may result in choppy sideways action. Key levels to track include Opening Resistance at 58,186 and Opening Support at 57,813 .
Major resistance lies around 58,379 – 58,543 , while supports are placed near 57,627 – 57,358 . Tomorrow’s action will depend heavily on how price behaves around these breakout levels.
🟢 Scenario 1: GAP-UP Opening (200+ Points)
If Bank Nifty opens around or above 58,100 – 58,200 , it will directly enter the upper part of the No-Trade Zone near the Opening Resistance . Bulls need a strong follow-through above 58,186 to confirm an upside continuation.
If price sustains above 58,186 with bullish candle closings and volume expansion, an upward move toward 58,379 and 58,543 is likely.
However, if the index opens higher but faces rejection near 58,186 , expect a pullback toward 57,893 – 57,813 .
Ideal strategy: Wait for the first 15–30 minutes to settle. Enter only after a clear breakout retest above 58,186 to minimize risk of false moves.
Aggressive traders can trail stop-loss below 58,000 once the breakout sustains.
💡 Educational Note:
Gap-up openings near resistance often trap early buyers. Professionals wait for retests or volume confirmation before committing capital. A breakout that holds with clean price structure and rising volumes indicates institutional strength — that’s the kind of move worth trading.
🟧 Scenario 2: FLAT Opening (Within 57,813 – 58,186)
If Bank Nifty opens flat within this No-Trade Zone , expect early volatility and whipsaws. This range is not ideal for fresh entries until the index breaks out decisively on either side.
Avoid taking trades between 57,813 – 58,186 as price may fluctuate without direction.
If price breaks above 58,186 decisively with follow-through volume, targets open toward 58,379 – 58,543 .
If price breaks below 57,813 , expect weakness to extend toward 57,627 and possibly 57,358 .
Wait for confirmation candles and volume expansion — sideways markets are known for fake breakouts and false triggers.
🧠 Educational Tip:
Flat openings demand patience. When markets open inside a range, both buyers and sellers test control before a trend emerges. Most early losses occur because traders act before confirmation. The best opportunities form after the market “shows its hand” — not before.
🔴 Scenario 3: GAP-DOWN Opening (200+ Points)
If Bank Nifty opens below 57,700 , it will move near the lower boundary of the Opening Support Zone (57,813 – 57,627) . This will be the key area to watch for buyer reactions.
If reversal patterns (like hammer, bullish engulfing, or double bottom) appear near 57,627 – 57,358 , traders can look for a short-covering move toward 57,813 – 57,893 .
If price breaks and sustains below 57,627 with heavy selling, weakness may extend toward 57,358 and possibly 57,200 .
Avoid shorting immediately after a deep gap-down — wait for a pullback toward resistance for better entries and safer risk-reward setups.
Always observe how volume behaves near support — declining volume signals seller exhaustion, while strong red candles confirm continuation.
📘 Educational Insight:
Gap-downs often test emotional control. While they can look bearish initially, many turn into reversal days once the selling pressure fades. The key is to avoid emotional reactions and let the first few candles reveal intent. A stable base near major support often becomes a turning point.
💼 RISK MANAGEMENT TIPS FOR OPTIONS TRADERS:
Avoid buying options in the first 15 minutes — IV spikes post-open inflate premiums and cause quick time decay once volatility stabilizes.
Never risk more than 1–2% of your total capital on a single trade — survival in trading is about capital preservation.
Prefer ITM options for directional clarity; they offer smoother price behavior and less decay.
Trail stop-losses as soon as trades move 40–50 points in favor; protect profits without overexposure.
Avoid holding weekly options overnight unless you have a confirmed trend or hedge.
Always journal your trades — patterns of discipline are built from reflection, not reaction.
📈 SUMMARY:
🟧 No-Trade Zone: 57,813 – 58,186
🟥 Resistance Zones: 58,379 / 58,543
🟩 Support Zones: 57,627 / 57,358
⚖️ Bias: Neutral-to-Bullish above 58,186 | Weakness below 57,813
📚 CONCLUSION:
Bank Nifty is at a key decision zone — 57,813 – 58,186 acts as the battleground between bulls and bears. A sustained breakout above 58,186 can trigger a strong momentum rally toward 58,543 , while slipping below 57,813 could lead to a test of 57,627 – 57,358 .
The first 30 minutes of price action will set the tone — respect those levels, trade with confirmation, and avoid emotional impulses.
📊 Remember: Great traders don’t predict the market; they prepare for every scenario.
⚠️ DISCLAIMER:
I am not a SEBI-registered analyst . The views and levels shared here are purely for educational purposes . Please do your own research or consult a certified financial advisor before making any trading or investment decisions.
Titan Company Limited: Poised for a BreakoutTitan Company Limited, currently trading at ₹3798, is showing strong signs of an uptrend continuation on its daily chart. The price structure suggests a potential breakout to new all-time highs, supported by a well-defined trend pattern.
🔺 Uptrend Continuation Pattern
The stock has been forming higher lows, indicating consistent buying interest at increasingly elevated levels.
This structure reflects a healthy uptrend, where each pullback finds support above the previous one.
🚀 Breakout Setup
Price action is now approaching a critical resistance zone, where previous highs capped upward movement.
A breakout above this level would signal renewed bullish momentum and open the path for further upside.
🎯 Target Projection
Based on the depth of recent pullbacks and the strength of the trend, the stock shows potential to move toward the ₹4800 mark.
This target aligns with the measured move from the base of the pattern to the anticipated breakout point.
✅ Confirmation Matters
While the setup is promising, confirmation of the breakout—preferably with strong volume and sustained price action—is essential.
Traders should watch for a decisive close above resistance to validate the move and reduce the risk of a false breakout.

BANKNIFTY : Trading levels and plan for 10-Nov-2025📊 BANK NIFTY TRADING PLAN — 10 NOV 2025
(Timeframe Reference: 15-Min Chart)
Chart Summary:
Bank Nifty closed near 57,903 , resting just below its Opening Resistance / Support zone (58,013) . The market has shown a recovery from its recent dip and is now approaching a key decision point. The structure suggests a potential continuation if momentum builds above resistance, while the zone between 57,699 – 57,579 acts as an immediate support base for the bulls.
Key zones to note:
🟢 Supports: 57,699 / 57,579 / 57,337
🟥 Resistances: 58,013 / 58,382 / 58,541 (Profit Booking Zone)
Tomorrow’s session could open with a gap of 200+ points, and the opening structure will determine whether momentum sustains or fades.
🟢 Scenario 1: GAP-UP Opening (200+ Points)
If Bank Nifty opens above 58,100 , bulls will be eyeing continuation towards 58,382 and the Profit Booking Zone (58,382 – 58,541) .
If price sustains above 58,013 and holds the gap with strong volume, momentum buying can continue toward 58,382 . A breakout beyond that could push to 58,541 , where profit booking is expected.
However, if the index opens higher but fails to hold above 58,013 after the first 15–20 minutes, expect a pullback toward 57,903 – 57,699 .
Avoid chasing long positions at open — instead, wait for a retest of 58,013 as support before entering.
Short-term traders can look for intraday reversals if price shows rejection candles (shooting star or bearish engulfing) near 58,382 – 58,541 .
💡 Educational Note:
Gap-ups often attract emotional entries. The trick is to differentiate between genuine continuation and exhaustion. A strong follow-through candle with volume confirmation is essential — otherwise, what appears to be strength could turn into a bull trap.
🟧 Scenario 2: FLAT Opening (Between 57,699 – 58,013)
A flat opening near Opening Resistance / Support zone will make the early session tricky, as both sides will try to gain control. Expect tight consolidation before a breakout.
If price breaks and sustains above 58,013 , momentum can quickly shift toward 58,382 . Look for a solid bullish candle with volume before confirming breakout entries.
If price fails to break 58,013 and starts forming lower highs, it can retest the Opening Support (57,699 – 57,579) .
In case of sustained weakness below 57,579 , the structure turns bearish toward 57,337 .
Avoid entering within the tight zone of 57,699 – 58,013 ; this is a potential whipsaw area where stop-loss hits are frequent.
🧠 Educational Tip:
Flat openings are traps for impatient traders. Always let the first 3–4 candles define the direction. The best trades often come after false moves are flushed out and genuine volume-backed breakouts occur.
🔴 Scenario 3: GAP-DOWN Opening (200+ Points)
If Bank Nifty opens below 57,600 , the bias will turn cautious. Bears may test the Opening Support Zone (57,699 – 57,579) or even the Last Intraday Support (57,337) .
If price stabilizes around 57,579 – 57,337 and forms bullish reversal candles (hammer, engulfing), short-covering could lift price back toward 57,903 – 58,013 .
However, if price fails to recover above 57,579 and breaks below 57,337 decisively, weakness may extend further toward 57,100 – 56,950 .
Avoid panic shorting directly on the gap-down. Wait for a pullback to resistance areas for better entries and defined risk.
Watch for volume drop near support zones — this often signals exhaustion of selling pressure.
📘 Educational Insight:
Gap-downs usually cause emotional selling early in the session. Smart traders wait for confirmation of follow-through before acting. Price stability and volume divergence near major supports often provide the best risk-reward setups.
💼 RISK MANAGEMENT TIPS FOR OPTIONS TRADERS:
Avoid buying options during the first 15 minutes after open — high IV can inflate premiums and reduce returns once volatility cools.
Always define your stop-loss before taking a trade; risk no more than 1–2% of your total capital per setup.
Prefer ITM options for better delta and stability when directional bias is clear. Avoid far OTM strikes unless expecting sharp moves.
Trail your stop-loss after a 30–40 point favorable move — this locks in profits and reduces emotional exits.
Never revenge trade after losses — your capital is your ammunition. Protect it.
📈 SUMMARY:
🟧 Key Resistance Zone: 58,013 / 58,382 / 58,541
🟩 Support Zones: 57,699 / 57,579 / 57,337
⚖️ Bias: Neutral-to-Bullish above 58,013 | Weakness below 57,579
🎯 Profit Booking Area: 58,382 – 58,541
📚 CONCLUSION:
Bank Nifty is positioned at a critical inflection level — a breakout above 58,013 can open the path toward 58,382 – 58,541 , while losing 57,579 can tilt the momentum back toward the bears.
The day will favor traders who respect the first 15–30 minutes of price discovery and align trades only after volume-backed confirmation. Remember, in volatile markets, patience equals profits .
📊 Trade with logic, not emotion — the market rewards discipline, not impulse.
⚠️ DISCLAIMER:
I am not a SEBI-registered analyst . The above analysis is shared purely for educational purposes and should not be considered financial advice. Please do your own research or consult a certified financial advisor before making any trading or investment decisions.

BANKNIFTY : Trading levels and Plan for 07-Nov-2025📊 BANK NIFTY TRADING PLAN — 07 NOV 2025
(Timeframe Reference: 15-Min Chart)
Chart Summary:
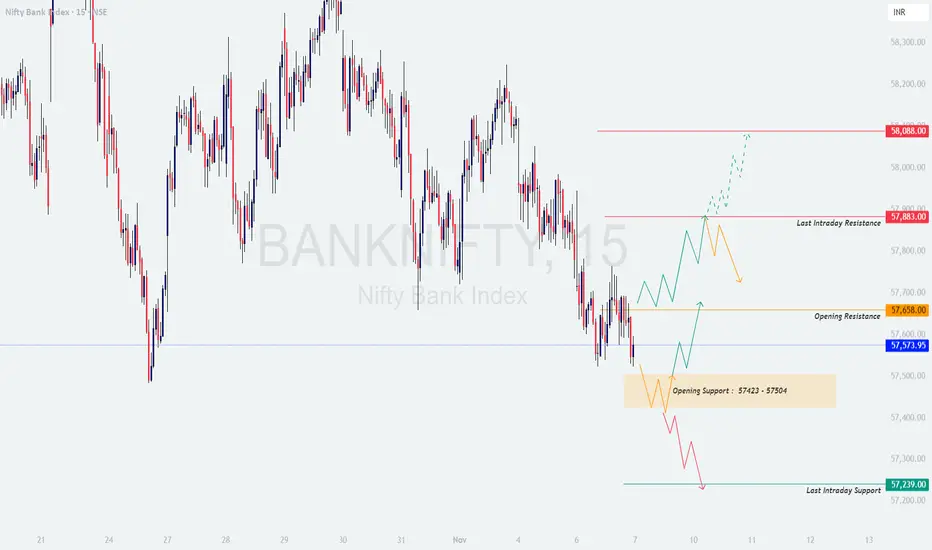
Bank Nifty is currently trading near 57,574 , hovering just above its key Opening Support zone (57,423 – 57,504) . The index has been consolidating after recent declines and is now positioned between two crucial areas — Opening Resistance at 57,658 and Last Intraday Resistance at 57,883 .
A strong move beyond either side of this range is likely to set the tone for the day. Intraday volatility may rise around the open, so confirmation and patience will be key.
🟢 Scenario 1: GAP-UP Opening (200+ Points)
If Bank Nifty opens around or above 57,750 – 57,800 , it will directly approach the Opening Resistance zone. This area will act as the first major test for bulls.
If price sustains above 57,883 (Last Intraday Resistance), expect bullish continuation towards 58,088 , where profit booking may emerge.
Look for strong bullish candles with rising volume before taking long positions — avoid chasing the first candle of the day.
If price fails to sustain above 57,883 and shows rejection wicks or bearish engulfing patterns, it may retrace back to 57,658 – 57,574 .
Ideal strategy: Wait for a retest of 57,658 with support confirmation before entering fresh longs. This provides a safer risk-reward setup.
💡 Educational Note:
Gap-up openings often cause over-enthusiasm. Let the market show its intent. Sustained strength with high volume near resistance confirms that institutional buyers are active. A fake breakout without volume can lead to sharp intraday reversals.
🟧 Scenario 2: FLAT Opening (Within 57,504 – 57,658)
A flat opening near the Opening Resistance and Opening Support zones may keep the index choppy in the first 30 minutes. Both buyers and sellers are likely to test strength before committing directionally.
Avoid early trades within this band ( 57,504 – 57,658 ) — it’s a neutral range with limited edge.
If price breaks above 57,658 decisively, watch for momentum toward 57,883 and 58,088 .
If price breaks below 57,504 , expect weakness towards 57,423 , followed by 57,239 (Last Intraday Support).
Breakouts supported by volume expansion are more reliable — low-volume moves near these zones often trap traders.
🧠 Educational Tip:
Flat openings are ideal for breakout traders. Always react to confirmed breakouts rather than anticipating them. False moves during consolidation phases are the number one reason for premature losses.
🔴 Scenario 3: GAP-DOWN Opening (200+ Points)
If Bank Nifty opens below 57,350 , it enters the weak zone near the Opening Support (57,423 – 57,504) .
If price forms a reversal pattern (hammer, bullish engulfing, or double bottom) near 57,239 – 57,300 , traders can look for a short-covering opportunity toward 57,574 – 57,658 .
However, a sustained break below 57,239 with heavy selling volume could accelerate downside momentum toward 57,100 – 57,000 .
Avoid aggressive shorts on deep gap-downs; instead, wait for a pullback toward resistance for better entries.
📘 Educational Insight:
Gap-downs often begin with emotional selling. Most profitable trades form when you identify where sellers exhaust. Watch for signs like declining volume on down candles or sharp rejections near support zones — these often hint at reversals.
💼 RISK MANAGEMENT TIPS FOR OPTIONS TRADERS:
Avoid buying options in the first 15–20 minutes — early IV spikes make premiums expensive and often lead to time decay once volatility cools.
Define your stop-loss clearly before entering; never risk more than 1–2% of your total trading capital per trade.
If you’re directional, prefer ITM options for stability and avoid far OTM strikes on range-bound or flat days.
Trail your stop-loss as soon as you capture a 30–40 point favorable move — this locks in profits while reducing downside risk.
Remember: Protecting your capital during uncertain sessions matters more than catching every move.
📈 SUMMARY:
🟧 Opening Support Zone: 57,423 – 57,504
🟥 Resistance Zones: 57,658 / 57,883 / 58,088
🟩 Support Zones: 57,239 / 57,100
⚖️ Bias: Neutral-to-Bullish above 57,658 | Weakness below 57,504
📚 CONCLUSION:
Bank Nifty is trading at a crucial inflection point, where 57,658 acts as a key breakout level and 57,423 serves as an immediate defense for bulls. A breakout beyond these levels will dictate intraday direction.
The best trades tomorrow will come from waiting for confirmation — not prediction. Respect price structure, stay disciplined, and always trade based on technical evidence rather than emotion.
📊 Patience + Planning = Profitable Trading.
⚠️ DISCLAIMER:
I am not a SEBI-registered analyst . The analysis shared above is purely for educational purposes and to promote informed trading practices. Please consult a certified financial advisor before making any trading or investment decisions.
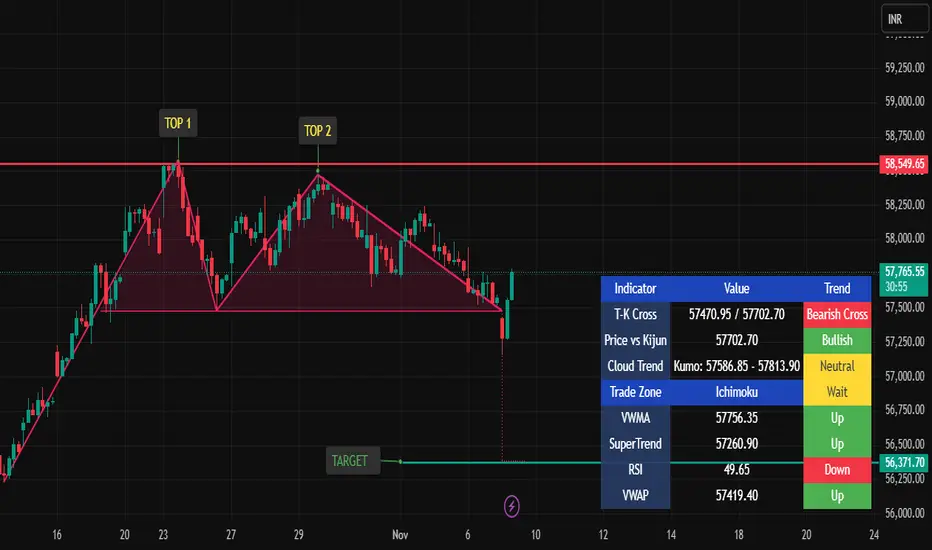
Bank Nifty – Double Top Pattern Analysis📉 Bank Nifty – Double Top Breakdown: Initiate Sell Signal
The chart confirms a Double Top pattern on Bank Nifty, signaling a bearish reversal from the recent highs near ₹58,550. Both peaks faced strong rejection at this resistance, reflecting weakening bullish momentum.
🔹 Sell Signal Trigger:
Initiate short positions once Bank Nifty breaks and closes below ₹57,480 (neckline support).
This breakdown confirms pattern completion and potential start of a downward move.
📊 Trade Setup
Stop Loss: ₹58,550 (above recent highs / resistance)
Target : ₹56,370
🧭 Technical Rationale
Pattern: Double Top – Bearish reversal confirmation
Structure: Two failed attempts to cross ₹58,550 indicate selling dominance.
Momentum: Weakening buying strength visible; a neckline breakdown often triggers a short-term trend reversal.
Volume Confirmation: Look for increased selling volume on the breakdown to validate the move.
⚠️ Disclaimer
This analysis is purely for educational purposes and not a recommendation to buy or sell.
Trading involves substantial risk — always conduct your own research or consult a financial advisor before taking any trade.
BANKNIFTY : Trading levels and Plan for 05-Nov-2025📊 BANK NIFTY TRADING PLAN — 05 NOV 2025
(Timeframe Reference: 15-min Chart)
Chart Summary:
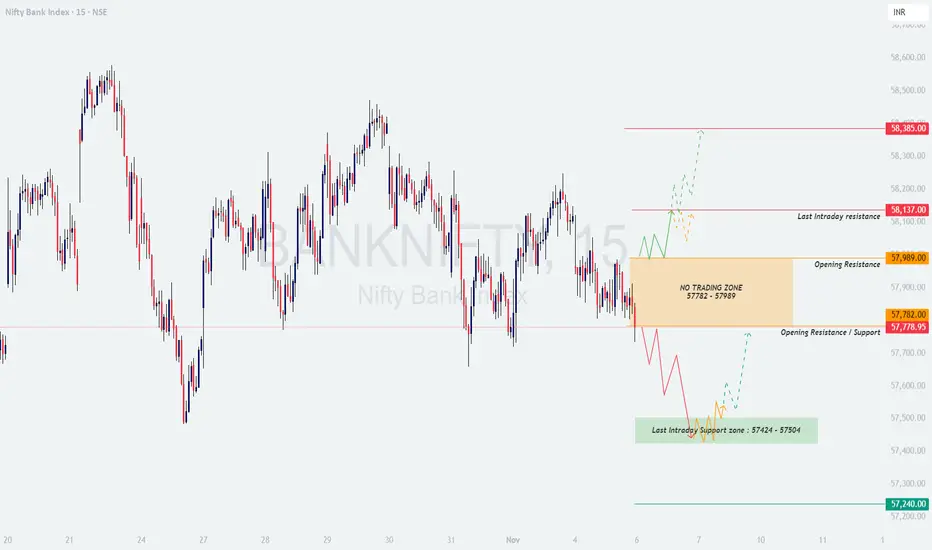
Bank Nifty is currently trading near the 57,780 zone, which lies just below the key Opening Resistance area (57,782 – 57,989). A clear No Trading Zone has been identified between these levels, suggesting indecision at the open. A strong directional move is expected once the index breaks out of this band.
🟢 Scenario 1: GAP-UP Opening (200+ points)
If Bank Nifty opens above 58,000, it will likely test the immediate resistance near 58,137. A sustained move above this could invite momentum buying towards 58,385 — the next intraday resistance.
If price sustains above 58,137 with strong candle close, traders may consider long positions with a target towards 58,385.
Stop-loss can be maintained just below 57,980, as falling below this zone may trigger a pullback back into the range.
If price fails to sustain above 58,137 and shows rejection candles, short traders can look for a retracement back toward 57,989 – 57,780 zone.
🧠 Educational Note: Gap-up openings often trigger emotional entries. Always let the first 15–30 minutes settle before committing to a direction. Breakout confirmation through strong volume is essential to avoid traps.
🟧 Scenario 2: FLAT Opening (Within 57,782 – 57,989)
This range represents a No Trading Zone. Price is likely to remain volatile and whipsaw both sides before confirming direction. Patience is key here.
Avoid initiating fresh positions within the zone (57,782 – 57,989).
If price breaks above 57,989 decisively, expect a potential rise toward 58,137, followed by 58,385.
If price breaks below 57,782, it may drag the index towards the lower intraday support near 57,504 – 57,424.
💡 Educational Tip: Flat openings are ideal for breakout traders. Wait for clear directional volume confirmation before entering. Most false moves happen when traders anticipate instead of reacting.
🔴 Scenario 3: GAP-DOWN Opening (200+ points)
If the index opens below 57,600, weakness may extend towards the Last Intraday Support zone (57,424 – 57,504). This zone is critical for bulls to defend.
If a reversal candle forms near 57,424 – 57,504, buyers may attempt a short-covering move back toward 57,780.
However, a sustained move below 57,400 can extend the fall toward 57,240, which acts as the final intraday support.
Traders should avoid shorting deep gap-downs immediately — instead, wait for a pullback to the nearest resistance (57,700–57,780) for better risk-reward.
📘 Educational Insight: Gap-downs often lead to panic selling in the first 10–15 minutes. Always wait for the price to form a base before anticipating reversals. Intraday traders should track if volume drops near key support levels — it often hints at exhaustion of selling.
💼 RISK MANAGEMENT TIPS FOR OPTIONS TRADERS:
Avoid buying options during the first 15 minutes of volatile openings — IV (Implied Volatility) spikes can inflate premium costs.
Always define your risk before entering. Limit your exposure to 1–2% of total capital per trade.
If trading intraday options, trail your stop-loss after a 30–40 point favorable move in Bank Nifty.
Use ITM options for directional confidence and avoid far OTM strikes on non-trending days.
Stay disciplined — remember, missing a trade is better than being trapped in a false breakout.
📈 SUMMARY:
🟧 No Trading Zone: 57,782 – 57,989
🟥 Resistance Zones: 58,137 / 58,385
🟩 Support Zones: 57,504 – 57,424 / 57,240
⚖️ Bias: Neutral-to-Bullish above 57,989 | Weakness below 57,782
📚 CONCLUSION:
The structure suggests Bank Nifty is at a crucial decision point. Bulls must reclaim 58,000+ to re-establish control, while bears will try to push it below 57,780. Staying patient during the opening volatility and respecting breakout levels can make the difference between profit and emotional trades.
⚠️ DISCLAIMER:
I am not a SEBI-registered analyst . The views expressed here are for educational purposes only. Please conduct your own research or consult a financial advisor before making trading decisions.
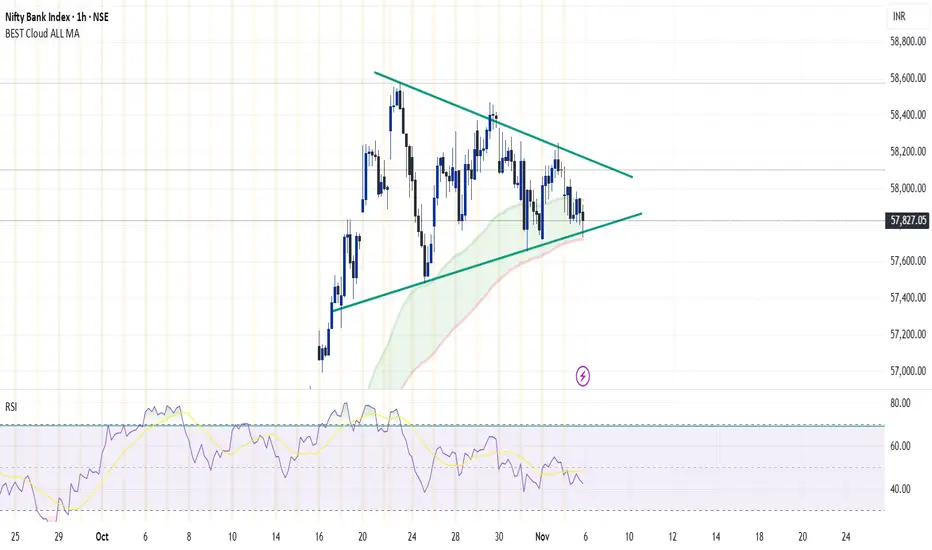
BANKNIFTY - 1 Hour Chart AnalysisBANKNIFTY 1-hour chart details:
Last Close: 57,827.05 (down 0.47%)
Range: Open 57,871.10, High 57,911.90, Low 57,732.95, Close 57,827.05
RSI: Shows recent values of 42.49 and 48.35 (indicative of mild bearish-bias, not oversold or overbought)
Trade Setup Suggestion
Bias: Slight weakness, as RSI drifts toward but does not reach oversold, and price closed just above the session low after a down move.
Levels:
Immediate Resistance: 57,871–57,911
Support: 57,732
Setup:
If BANKNIFTY breaks below 57,732 with volume, consider a short trade, targeting 57,500, with a stop above 57,900.
If BANKNIFTY reclaims 57,900+ and sustains, you may see a bullish reversal toward 58,100; keep stop below 57,700 for long trades.
RSI Context: Below 50 but above 40—wait for a clear break in either direction. Conservative traders may wait for RSI to touch 40 (oversold) for a quick bounce, or cross 50 for bullish confirmation.
Risk Note: Volatility may be expected as the 1-hour structure is near range support.
Follow for More Updates
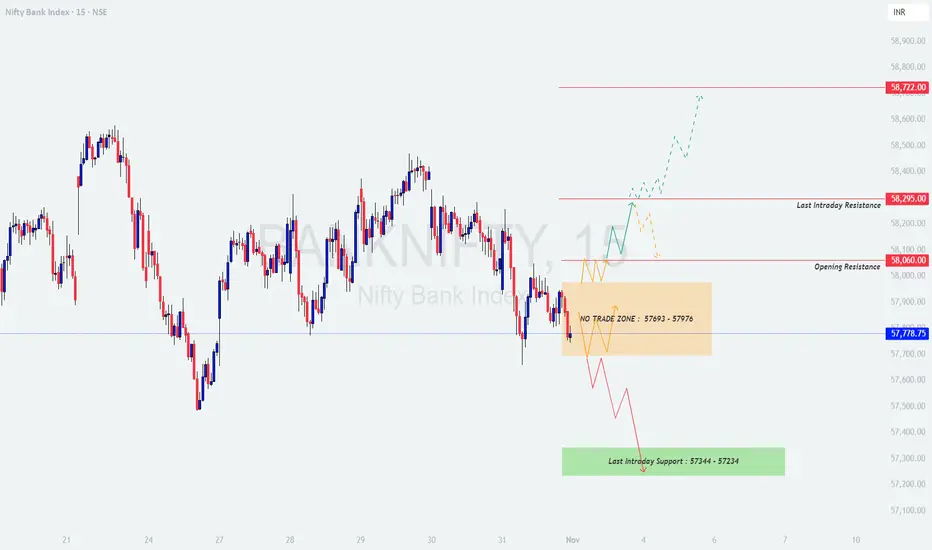
BANKNIFTY : Trading levels and plan for 03-Nov-2025BANKNIFTY TRADING PLAN – 03-Nov-2025
📊 Prepared by LiveTradingBox | Based on 15-min chart structure & psychological correction theory
🔍 Key Reference Levels:
🟩 Last Intraday Support: 57,344 – 57,234
🟧 No Trade Zone: 57,693 – 57,976
🟨 Opening Resistance: 58,060
🟥 Last Intraday Resistance: 58,295
🔺 Profit Booking Zone: 58,722
🟢 1. Gap-Up Opening (Above 58,060 – 200+ points)
If Bank Nifty opens above 58,060, it reflects a bullish sentiment driven by overnight momentum or positive global cues. However, the key test will be whether the index can sustain above this breakout zone or not.
Plan of Action:
Wait for the first 15–20 minutes to let early volatility settle.
A retest and strong candle close above 58,060 can trigger fresh buying opportunities.
Initial targets will be 58,295 (last intraday resistance) and then 58,722 (profit booking zone).
Maintain a stop loss below 57,950 on an hourly close basis for positional trades.
If Bank Nifty rejects from 58,295 with heavy volume, consider partial profit booking or a light counter short scalp targeting 58,000 – 57,900.
📘 Educational Insight:
Chasing a gap-up is one of the most common retail trader mistakes. Professionals wait for confirmation near resistance retests or structure validation to ensure they’re aligning with institutional flow rather than speculative enthusiasm.
🟦 2. Flat Opening (Around 57,750 ±100 points)
A flat start near the midpoint of the No Trade Zone (57,693 – 57,976) indicates indecision and balance between buyers and sellers. Patience is crucial here, as this range acts as a neutral ground where false signals can easily trap traders.
Plan of Action:
Avoid entering immediately after the open — the market needs time to reveal direction.
Wait for a breakout above 57,976 for potential upside movement toward 58,060 – 58,295.
A breakdown below 57,693 may trigger weakness toward 57,344 – 57,234.
Do not trade within the No Trade Zone to avoid choppy moves and unnecessary losses.
Focus on candle confirmations — avoid pre-empting breakouts or breakdowns.
📘 Educational Insight:
Flat openings are where discipline and patience pay off. Avoid trading “inside noise” — wait for price to leave the neutral range with conviction before joining the move.
🔻 3. Gap-Down Opening (Below 57,600 – 200+ points)
A gap-down below 57,600 signals weakness or profit booking, especially if it’s accompanied by negative global cues. The support zone of 57,344 – 57,234 becomes the key area to watch for buyer reactions.
Plan of Action:
Monitor price behavior near 57,344 – 57,234. If Bank Nifty forms a strong bullish reversal candle (hammer or engulfing), it can offer a potential intraday long setup.
Targets for such a bounce can be 57,600 – 57,800, but avoid overextending trades unless strong momentum follows.
Keep a strict stop loss below 57,200 to protect from deeper slides.
If the support fails to hold and price sustains below 57,234, expect continued weakness toward 57,000 – 56,850 levels.
Avoid aggressive averaging — trend continuation can accelerate in such cases.
📘 Educational Insight:
Gap-downs often trigger emotional selling among retail participants. However, observing price reactions at support zones helps identify whether the move is panic-driven or part of a larger corrective phase.
🧠 Risk Management Tips for Options Traders:
Never enter trades based on emotions — use defined entry and exit levels.
Avoid buying options during the first 15 minutes of the session; volatility premium is highest then.
Prefer ATM or slightly ITM options for directional trades — they offer better delta control.
Stick to a maximum risk limit of 2–3% per trade .
If you hit your daily loss limit, step aside and protect your capital — survival > prediction.
Keep monitoring time decay, especially post 2 PM — theta accelerates rapidly.
📈 Summary & Conclusion:
Above 58,060, trend bias is bullish toward 58,295 – 58,722, provided the level sustains.
Between 57,693 – 57,976, stay neutral — it’s a No Trade Zone; let direction confirm.
Below 57,600, expect weakness until support near 57,344 – 57,234 reacts.
Patience, observation, and disciplined execution are key to consistent results.
⚠️ Disclaimer:
I am not a SEBI-registered analyst . This analysis is intended purely for educational and informational purposes . Traders and investors should perform their own research or consult with a financial advisor before taking any trading or investment decisions.
BANKNIFTY : Trading levels and Plan for 31-Oct-2025BANK NIFTY TRADING PLAN – 31-Oct-2025
📊 Prepared by LiveTradingBox | Based on 15-min structure and psychological correction theory
🔍 Key Reference Levels:
🟥 Profit Booking Zone: 58,368 – 58,594
🟧 Opening Resistance: 58,236
🟦 Current Reference Level: 58,067
🟩 Opening Support Zone: 57,856 – 57,896
🟢 Late Support Range: 57,580 – 57,692
🟢 1. Gap-Up Opening (Above 58,236 – 200+ points)
If Bank Nifty opens above 58,236, it indicates bullish enthusiasm and possible continuation momentum toward 58,368 – 58,594. However, chasing a strong gap-up is risky unless the index sustains above the breakout level after the first 15–20 minutes of opening.
Plan of Action:
Wait for price stability for at least the first 15 minutes — avoid impulsive entries.
If price retests and sustains above 58,236, consider a long entry aiming for 58,368 – 58,594.
Maintain a stop loss below 58,100** on an hourly close basis.
Partial profit booking near 58,368 is advised, trail remaining position for extended upside.
If price rejects from 58,368 – 58,594, expect a short-term pullback toward 58,100 – 57,900.
📘 Educational Insight:
Gap-ups near resistance zones often trigger emotional buying by retail traders. Smart traders wait for a retest near the breakout area to enter with a controlled risk–reward setup rather than chasing candles at open.
🟦 2. Flat Opening (Around 58,050 ±100 points)
A flat start near 58,050 suggests market indecision or neutral sentiment. This is the most crucial zone where both bulls and bears will attempt to take control. Price action near 58,236 or 57,896 will guide the day’s direction.
Plan of Action:
Let the market form its initial range within 30 minutes before reacting.
A breakout and sustain above 58,236 can trigger bullish momentum toward 58,368 – 58,594.
A breakdown below 57,896 can invite short trades targeting 57,692 – 57,580.
Avoid taking trades in between 58,050 – 57,896 range as it may cause false signals.
Wait for a confirmed candle close beyond these levels for a directional entry.
📘 Educational Insight:
Flat openings are generally setup builders. Let the structure develop — acting too early may lead to whipsaws. Always trade the breakout, not the anticipation.
🔻 3. Gap-Down Opening (Below 57,856 – 200+ points)
If Bank Nifty opens below 57,856, it signals weakness or bearish sentiment influenced by overnight global cues or profit booking. The next crucial zone is 57,580 – 57,692, which is expected to act as a strong support region.
Plan of Action:
Observe the first 15 minutes of market reaction near 57,580 – 57,692.
If buyers defend this zone with strong reversal candles, consider a reversal long entry targeting 57,856 – 58,000.
Keep a stop loss below 57,550** (psychological round level).
If price fails to hold above 57,580, avoid long positions — it can slide further to 57,400 – 57,300.
For bearish continuation trades, wait for sustained weakness below 57,580 to avoid traps.
📘 Educational Insight:
Gap-downs create panic among participants, but patient observation often reveals strong buying near support zones. Reaction at support matters more than prediction — trade what you see, not what you fear.
🧠 Risk Management Tips for Options Traders:
Use strict stop losses and avoid averaging losing trades.
Trade only after the first 15–20 minutes to avoid early volatility traps.
Prefer ATM or slightly ITM options to balance delta and time decay.
Always define risk per trade — never risk more than 2–3% of total capital.
Avoid emotional revenge trades; protect profits with trailing stops.
Record your trades daily to refine future decision-making.
📈 Summary & Conclusion:
Above 58,236, bias remains bullish toward 58,368 – 58,594.
Between 58,050 – 57,896, expect consolidation; avoid impulsive trading.
Below 57,856, weakness may extend toward 57,692 – 57,580; observe reactions here for reversals.
Trade levels, not emotions — patience and timing matter more than predictions.
⚠️ Disclaimer:
I am not a SEBI-registered analyst . The above analysis is purely for educational and informational purposes only . Traders should perform their own research or consult a financial advisor before making any trading or investment decisions.

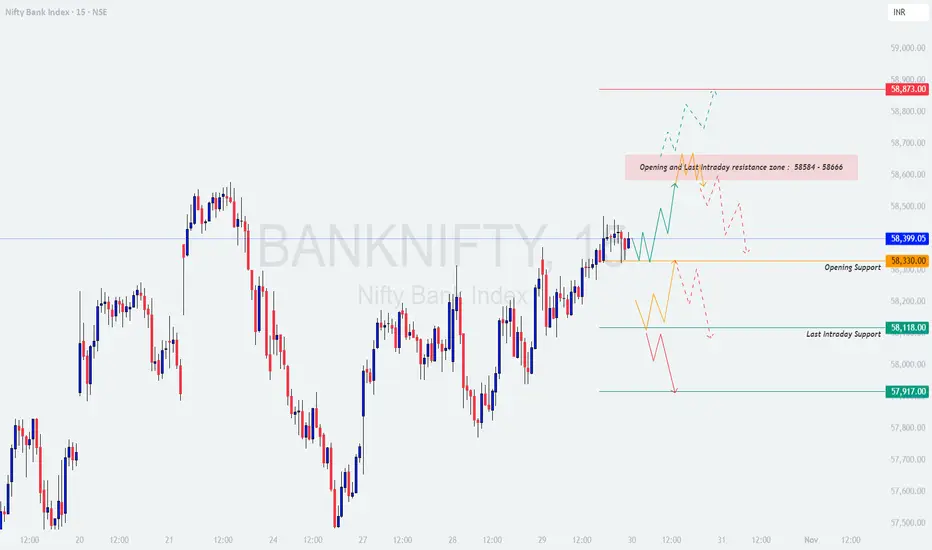
BANKNIFTY : Trading levels and Plan for 30-Oct-2025BANK NIFTY TRADING PLAN – 30-Oct-2025
📊 Bank Nifty closed around 58,399, forming a near-term consolidation after a steady up-move. The index currently faces a key Opening & Last Intraday Resistance Zone at 58,584 – 58,666, while 58,330 acts as immediate opening support. The structure suggests a potential trending move once the index breaks out of this narrow consolidation.
🟩 SCENARIO 1: GAP-UP OPENING (200+ Points Above 58,666)
If Bank Nifty opens above 58,666, it will indicate strong bullish sentiment with a possible extension toward the upper resistance levels.
A gap-up opening above 58,666 may push the index toward 58,873, which is the next projected resistance.
Sustaining above 58,666 with volume confirmation will invite momentum buying.
However, if the price fails to hold above this zone and forms rejection wicks, expect intraday profit booking or a pullback toward 58,399 – 58,330.
Avoid chasing longs immediately at open; instead, let the price settle for the first 15–30 minutes and wait for consolidation or breakout retest.
🧠 Educational Insight:
Gap-ups often attract impulsive buying, but smart traders wait for confirmation candles and sustained volume. A minor retracement after a gap-up can offer a low-risk entry with better R:R.
⚙️ Plan of Action:
→ Go long only if price sustains above 58,666 with confirmation.
→ Maintain stop-loss below 58,399 (hourly close basis).
→ Profit targets: 58,873, followed by 58,950.
🟨 SCENARIO 2: FLAT OPENING (Between 58,330 – 58,399)
A flat opening near the current close suggests an indecisive tone. Both bulls and bears will test each other near the resistance and support zones before a directional move develops.
If the price holds above 58,399, expect a gradual test of 58,584 – 58,666 resistance.
Sustained trade above 58,666 may invite intraday longs, targeting 58,873.
Conversely, if Bank Nifty slips below 58,330, it may trigger mild selling pressure toward 58,118.
Traders should focus on breakout confirmation candles rather than anticipating direction.
🧠 Educational Insight:
A flat opening inside the previous day's range is often a setup for fake breakouts. Traders should remain neutral until a strong directional move appears beyond the identified levels.
⚙️ Plan of Action:
→ Avoid early entries; let the first 30 minutes define intraday bias.
→ Long bias only above 58,666; short bias below 58,330.
→ Respect intraday structure and avoid counter-trading against the prevailing move.
🟥 SCENARIO 3: GAP-DOWN OPENING (200+ Points Below 58,118)
If Bank Nifty opens below 58,118, the sentiment may turn mildly bearish with scope for deeper retracement toward 57,917 or lower levels.
Early buyers may attempt to defend 57,917 – 58,118, leading to a short-covering bounce.
A sharp rejection from 57,917 can trigger a technical rebound toward 58,330.
However, if the index fails to sustain above 58,118, fresh short positions may build up.
Avoid catching falling knives; instead, wait for a reversal pattern or a reclaim of 58,118 before going long.
🧠 Educational Insight:
Gap-downs near support zones often produce false panic. Patience and waiting for a proper reversal structure (like a double bottom or bullish engulfing) can give high-probability trades.
⚙️ Plan of Action:
→ Go short only if Bank Nifty fails to reclaim 58,118 post-gap-down.
→ Maintain stop-loss above 58,330.
→ Targets: 57,917 → 57,750 → 57,600.
→ For bullish reversal trades, wait for confirmation candle above 58,118 before entry.
💡 RISK MANAGEMENT TIPS FOR OPTIONS TRADERS
Always wait for 15–30 minutes post-opening to avoid volatility traps.
Focus on ATM or slightly ITM options for intraday momentum trades.
Never risk more than 1–2% of trading capital per trade.
Use trailing stop-loss after your trade moves in profit.
Avoid over-leveraging—protecting capital ensures longevity in markets.
Always mark your key levels on chart before market opens; it builds discipline.
📘 SUMMARY & CONCLUSION
Key Resistance Levels: 58,584 → 58,666 → 58,873
Key Support Levels: 58,330 → 58,118 → 57,917
Trend Bias: Neutral-to-Positive, unless 58,118 breaks decisively
🔹 Bank Nifty is currently at a critical decision zone, with clear reaction levels identified.
🔹 A breakout above 58,666 will confirm bullish continuation, while a breach below 58,118 can trigger short-term weakness.
🔹 Focus on price action, volume, and breakout confirmations for high-probability setups.
🔹 Remember — the best traders don’t predict, they react intelligently.
⚠️ Disclaimer: I am not a SEBI-registered analyst. This analysis is purely for educational and informational purposes. Please perform your own research or consult a certified financial advisor before taking any trading decisions.
[INTRADAY] #BANKNIFTY PE & CE Levels(29/10/2025)Bank Nifty is likely to open with a gap up near the 58,250–58,300 zone, indicating continued strength from the previous session’s close. The index has broken out of a short-term consolidation zone, showing signs of bullish momentum building up once again.
If Bank Nifty sustains above 58,300, we can expect a move toward 58,450, 58,550, and 58,750+ levels. A breakout above 58,850–58,950 will further strengthen the trend and open the path toward the 59,100–59,250 zone.
On the downside, immediate support lies near 58,050–57,950. A fall below 57,950 may trigger mild profit booking, dragging the index toward 57,750 and 57,600 zones.
Overall, with a gap up opening, the sentiment remains positive and bullish. Traders should look for buying opportunities on dips above 58,100 while keeping a trailing stop loss near 57,950 to protect profits in case of volatility.

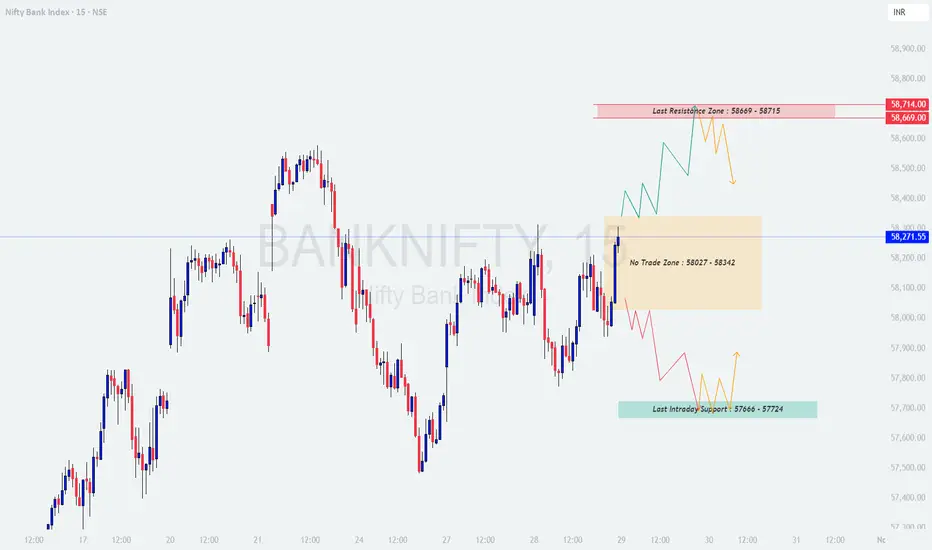
BANKNIFTY : Trading levels and Plan for 29-Oct-2025BANK NIFTY TRADING PLAN – 29-Oct-2025
📊 Bank Nifty closed around 58,272, forming a narrow consolidation inside the No-Trade Zone (58,027 – 58,342). This range reflects a tug-of-war between buyers and sellers, with both waiting for a breakout confirmation. The upcoming session’s direction will depend on how price reacts around the breakout and support levels.
🟩 SCENARIO 1: GAP-UP OPENING (200+ Points Above 58,342)
If Bank Nifty opens above 58,342, it will immediately face the Last Resistance Zone (58,669 – 58,715).
A strong gap-up above 58,342 will attract momentum buyers, aiming for 58,669 – 58,715 as intraday resistance targets.
Sustaining above 58,715 could open the door for a move toward 58,850 – 58,950, supported by short covering.
However, if rejection appears near 58,669 – 58,715, expect profit booking that may drag prices back to 58,342.
Avoid chasing long entries if prices struggle to hold above 58,669 after the first 15–30 minutes.
🧠 Educational Insight:
A gap-up opening near resistance zones often traps impatient buyers. Wait for a confirmation candle (preferably on the 15-min chart) before entering long positions. Sustained volume above resistance gives the best signal of strength.
⚙️ Plan of Action:
→ Go long only if Bank Nifty holds above 58,669 with strength and volume confirmation.
→ Keep a stop-loss below 58,342 on an hourly closing basis.
→ Book partial profits near 58,715, and trail the rest for potential continuation.
🟨 SCENARIO 2: FLAT OPENING (Between 58,027 – 58,342)
A flat opening inside the No-Trade Zone generally signals indecision and range-bound behavior during early hours.
Prices may oscillate between 58,027 and 58,342, offering limited risk-reward trades.
Breakout above 58,342 could invite intraday bullish momentum, while breakdown below 58,027 may tilt bias negative.
Both levels should be watched carefully for volume-backed confirmation before taking directional exposure.
🧠 Educational Insight:
“No-Trade Zones” exist to remind traders that capital preservation is more important than participation. Trading inside them often leads to false signals and emotional decisions.
⚙️ Plan of Action:
→ Stay patient and avoid trading inside the range.
→ Wait for an hourly close above 58,342 to go long or below 58,027 to go short.
→ Respect the breakout confirmation and avoid pre-emptive entries.
🟥 SCENARIO 3: GAP-DOWN OPENING (200+ Points Below 58,027)
If Bank Nifty opens below 58,027, it will test the Last Intraday Support Zone (57,666 – 57,724).
Buyers may attempt a pullback from this support zone in the early session.
If support holds and a reversal pattern forms, a bounce back toward 58,027 is likely.
A sustained fall below 57,666 will confirm weakness, potentially extending the decline toward 57,450 – 57,300.
🧠 Educational Insight:
Gap-downs trigger panic, but experienced traders look for reaction candles near support before acting. Sharp recoveries often begin when retail traders panic-sell near strong supports.
⚙️ Plan of Action:
→ For aggressive traders: Short below 57,666 with a stop-loss above 58,027, targeting 57,450 – 57,300.
→ For conservative traders: Wait for a rejection or reversal candle near 57,666 – 57,724 before considering long opportunities.
💡 RISK MANAGEMENT TIPS FOR OPTIONS TRADERS
Always wait for the first 15–30 minutes before entering, allowing volatility to stabilize.
Prefer ITM options for directional trades to minimize time decay.
Maintain a strict stop-loss (not exceeding 1–2% of capital).
Book partial profits once you achieve a 1:1 R:R to secure gains.
Avoid overtrading in the No-Trade Zone—discipline ensures consistency.
📘 SUMMARY & CONCLUSION
Key Resistance Levels: 58,342 → 58,669 → 58,715
Key Support Levels: 58,027 → 57,724 → 57,666
No-Trade Zone: 58,027 – 58,342
🔹 Bank Nifty remains in a neutral phase, awaiting a decisive breakout from its No-Trade Zone.
🔹 A move above 58,342 will shift bias bullish, while a fall below 58,027 may confirm weakness.
🔹 Traders should focus on reaction candles and volume confirmation for higher accuracy.
🔹 Remember — missing a trade is better than entering without a setup.
⚠️ Disclaimer: I am not a SEBI-registered analyst. This analysis is purely for educational and informational purposes. Please do your own research or consult a certified financial advisor before taking any trading decision.
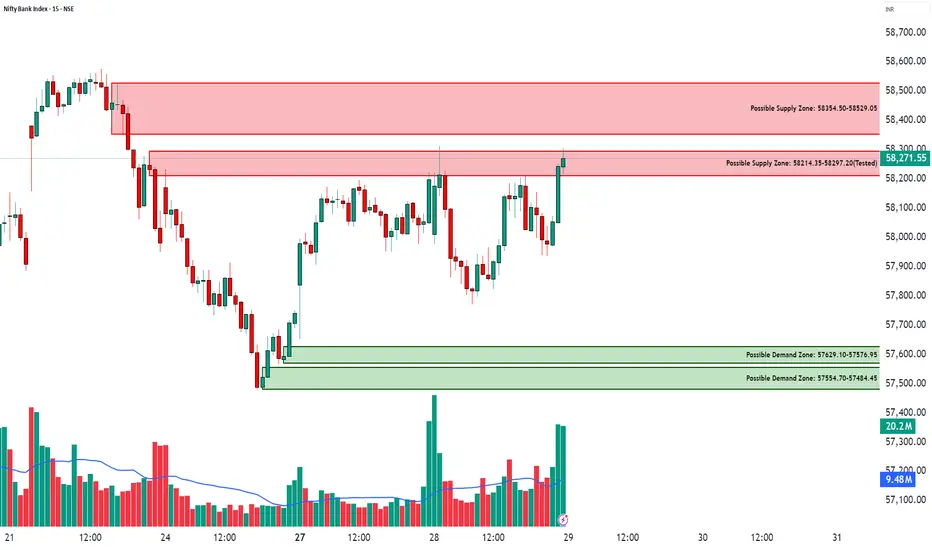
BANKNIFTY - Testing the Supply Zone After Strong Reversal📊 BANK NIFTY – Testing the Supply Zone After Strong Reversal ⚔️
Date: 28th Oct 2025
Spot Price: ₹58,271
🔹 Supports: 57,885 / 57,555 / 57,341
🔹 Resistances: 58,428 / 58,642 / 58,871
🔹 Intraday Demand Zones:
1️⃣ 57,629 – 57,576
2️⃣ 57,555 – 57,484
3️⃣ 57,341 – 57,300
🔹 Supply Zones:
1️⃣ 58,214 – 58,297 (Tested)
2️⃣ 58,354 – 58,529
🔑 Key Highlights
Bank Nifty rebounded strongly from multiple demand zones near 57,600 with a clear volume spike.
Price has now reached the tested supply zone around 58,214–58,297, where profit booking or short build-up could appear.
ATR Dashboard (STWP Edition) shows volatility expansion — suggesting the next move will likely be decisive.
The upper supply belt (58,350–58,530) remains a crucial resistance for trend confirmation.
🎯 STWP Trade View
Bank Nifty is currently trapped between strong demand below and supply overhead, indicating a range setup.
Keep a close watch on dips back into the 57,600–57,800 demand pocket — those zones remain key buyer territories.
If the index breaks and sustains above 58,530, expect a momentum push toward 58,870+.
Conversely, rejection from the current supply could bring a short-term pullback.
💡 Learning Note
When price revisits a tested supply zone after a strong recovery, volume behavior becomes the key —
Declining volume = exhaustion
Expanding volume = breakout potential
Observing this shift early helps traders position themselves smartly before the move unfolds.
Final Outlook:
Momentum: Recovering, but supply pressure visible | Trend: Range-bound between 57,600–8,500|Risk: Neutral within range; breakout may shift bias | Volume: High during reversal — watch behavior at supply
________________________________________
________________________________________
⚠️ Disclosure & Disclaimer – Please Read Carefully
The information shared here is meant purely for learning and awareness. It is not a buy or sell recommendation and should not be taken as investment advice. I am not a SEBI-registered investment adviser, and all views expressed are based on personal study, chart patterns, and publicly available market data.
Trading—whether in stocks or options—carries risk. Markets can move unexpectedly, and losses can sometimes exceed the money you have invested. Past performance or past setups do not guarantee future results.
If you are a beginner, treat this as a guide to understand how the market works and practice on paper trades before risking real money. If you are experienced, always assess your own risk, position sizing, and strategy suitability before entering trades.
Consult a SEBI-registered financial adviser before making any real trading decision. By engaging with this content, you acknowledge full responsibility for your trades and investments.
Position Status: No active position in BANKNIFTY at the time of analysis.
Data Source: TradingView & NSE India (Past Chart Reference) (Historical levels)
💬 Found this useful?
🔼 Give this post a Boost to help more traders discover clean, structured learning.
✍️ Drop your thoughts, questions, or setups in the comments — let’s grow together!
🔁 Share with fellow traders and beginners to spread awareness.
👉 “If you liked this breakdown, follow for more clean, structured setups with discipline at the core.”
🚀 Stay Calm. Stay Clean. Trade With Patience.
Trade Smart | Learn Zones | Be Self-Reliant 📊
BANKNIFTY : Trading levels and plan for 28-Oct-2025 (Educational💼 BANK NIFTY TRADING PLAN – 28-Oct-2025
📊 Based on current price behavior, Bank Nifty closed around 58,198, forming a neutral-to-mildly bullish tone while staying within the “No Trade Zone” between 58,030 – 58,343. The market is showing a tug of war between bulls defending the 57,800–57,600 range and bears maintaining pressure below 58,683. Tomorrow’s movement will depend on the opening behavior relative to these crucial levels.
🟩 SCENARIO 1: GAP-UP OPENING (200+ Points Above 58,343)
If Bank Nifty opens with a strong gap-up above 58,343, it will likely test the Late Intraday Resistance Zone (58,614 – 58,683) early in the session.
Watch for a quick move toward 58,683, where sellers are expected to emerge initially.
Only if the index sustains above 58,683 with an hourly close, fresh buying may continue toward 58,877.
If rejection occurs at the resistance zone, expect a pullback toward the 58,343 level — this will act as an intraday pivot.
A sustained break below 58,343 can drag prices toward 58,030, signaling exhaustion in the gap-up rally.
🧠 Educational Insight:
Gap-up openings often invite profit booking as traders square off early gains. Always allow the first 30 minutes for price stabilization before entering directional trades.
⚙️ Plan of Action:
→ Wait for either a breakout above 58,683 or a retest near 58,343 for better risk/reward setups. Avoid chasing prices during the first candle.
🟨 SCENARIO 2: FLAT OPENING (Near 58,100 – 58,200)
A flat start within the “No Trade Zone” (58,030 – 58,343) may lead to a sideways consolidation early on.
Bulls need a breakout above 58,343 to regain short-term momentum toward 58,614 – 58,683.
Bears, on the other hand, will try to push below 58,030 to extend weakness toward 57,838.
Until the index decisively breaks out of this range, stay patient and avoid impulsive entries.
🧠 Educational Insight:
Flat openings are ideal for range traders — let the market show its hand before committing. Remember, trading within a “no trade” range can lead to false breakouts.
⚙️ Plan of Action:
→ Wait for a directional confirmation candle beyond 58,343 or below 58,030 with volume support before taking any directional position. Use tight stop-losses and book partial profits quickly.
🟥 SCENARIO 3: GAP-DOWN OPENING (200+ Points Below 58,030)
A gap-down below 58,030 may shift control to the bears, especially if the opening is near 57,800 or lower.
Immediate support lies at 57,838, followed by 57,633 — expect temporary pullbacks from these zones.
If the index sustains below 57,633, downside extension toward 57,124 cannot be ruled out.
For a reversal, bulls need to reclaim 58,030 on an hourly closing basis.
🧠 Educational Insight:
Gap-downs often trigger panic selling, but sharp intraday reversals are also common when supports hold. Observe candle patterns near 57,633 for potential traps.
⚙️ Plan of Action:
→ Aggressive shorts can be considered below 57,633 with a stop-loss above 57,838. For safer entries, wait for a closing confirmation under key support zones.
💡 RISK MANAGEMENT TIPS FOR OPTIONS TRADERS
Avoid trading immediately after the opening bell — wait 15–30 minutes for clarity.
Always define your risk: Do not risk more than 1–2% of your capital per trade.
Use deep ITM options for directional plays to reduce theta decay impact.
If the index trades inside the No Trade Zone, stay out — sometimes no trade is the best trade.
Scale out profits — book half at 1:1 risk-reward, trail stop for remaining position.
📘 SUMMARY & CONCLUSION
Upside Resistance Zones: 58,343 → 58,614 → 58,683 → 58,877
Downside Supports: 58,030 → 57,838 → 57,633 → 57,124
No Trade Zone: 58,030 – 58,343
🔹 Expect volatility near resistance zones, while dips toward 57,838 – 57,633 may attract short-term buyers.
🔹 Trend confirmation will come only after a sustained breakout beyond the No Trade Zone range.
🔹 Focus on discipline and patience rather than chasing momentum.
⚠️ Disclaimer: I am not a SEBI-registered analyst. This analysis is shared for educational purposes only. Traders are advised to perform their own research or consult a financial advisor before taking any position.

BANKNIFTY : Trading plan and levels for 27-Oct-2025 (Educational💼 BANK NIFTY TRADING PLAN – 27-Oct-2025
📊 Timeframe: 15-Min | Analysis by LiveTradingBox
📈 Index Close: 57,741.50 (+0.06%)
🧭 Key Reference Levels
🟥 Last Intraday Resistance: 58,025
🟧 Opening Resistance: 57,887
🟨 Opening Support: 57,593
🟩 Last Intraday Support: 57,401
🟢 Major Support Zone: 57,141
🚀 Scenario 1: Gap-Up Opening (200+ Points Above Previous Close)
If Bank Nifty opens near or above 57,950–58,000, the index will directly enter the resistance zone. This region has previously acted as a short-term supply pocket, where sellers typically attempt to fade early rallies.
Watch for early volatility. If prices sustain above 58,025 with strong volume and a 15-minute candle close, we can expect momentum expansion towards 58,340–58,400.
However, if the index struggles to stay above 58,000 and fails to sustain beyond the first few candles, a pullback toward 57,740–57,590 is likely.
Avoid immediate buying in the first 15–30 minutes post gap-up; instead, wait for a retest near Opening Resistance (57,887) to check whether buyers defend the level.
Any rejection candle near 58,000 can be used for short opportunities, targeting 57,740 initially.
🟢 Educational Note: Gap-up openings often trap late buyers. Professional traders let early emotional reactions settle before confirming whether the move is genuine or corrective.
⚖️ Scenario 2: Flat Opening Around 57,700–57,750
A flat start around the current closing levels shows market indecision after a small recovery from recent lows. The Opening Support (57,593) and Opening Resistance (57,887) will define the first half of the day’s trading range.
If the index sustains above 57,740 and crosses 57,887, an upward push toward 58,025 could emerge.
Conversely, a rejection from 57,887 and breakdown below 57,593 can trigger a quick sell-off toward 57,401 and possibly 57,141.
Intraday traders should avoid overtrading within the range and wait for a clear direction to emerge.
Watch for bullish candle patterns near 57,590 or bearish reversals near 57,880 for directional cues.
🟠 Educational Insight: Flat openings require structured patience. The best intraday setups appear when price breaks the initial range with decisive volume. Let the market prove direction before you participate.
🔻 Scenario 3: Gap-Down Opening (200+ Points Below Previous Close)
If Bank Nifty opens near 57,500–57,400, it will test the Last Intraday Support Zone immediately. This zone marks a critical area where previous buyers attempted to defend the fall.
If prices hold above 57,400–57,450, expect a technical bounce toward 57,740, which can offer a short-covering opportunity.
A recovery above 57,593 can signal strength, potentially leading back to 57,887.
However, if the index breaks below 57,401 decisively, expect extended weakness toward the 57,141 major support.
Traders should be cautious not to short at the open; wait for confirmation that the support zone has been decisively broken.
🔴 Educational Note: Gap-downs often test traders’ discipline. Smart traders wait for reaction candles near key supports before deciding — either to catch a reversal or confirm a breakdown.
💡 Risk Management Tips for Options Traders
🎯 Define your risk before entry: Risk only a small fixed percentage of your capital (ideally below 2%).
💰 Avoid over-leverage: Even accurate analysis can fail under high position sizing.
🛑 Use stop loss strictly: Always place stop losses based on an hourly close, not emotional bias.
⌛ Wait for first 30 minutes: Avoid trading during initial volatility; let institutional direction reveal itself.
📊 Trail profits smartly: When you gain 30–40% on option premiums, book partial profits and trail the rest to breakeven.
🧘♂️ Avoid revenge trading: Every missed setup is a learning, not a loss. Protect your capital — opportunities are endless.
📈 Summary & Conclusion
Bank Nifty stands at a crucial consolidation stage between 57,400–58,000.
A breakout above 58,025 can invite strong bullish momentum toward 58,340–58,400, while a breakdown below 57,400 may extend weakness to 57,141.
The bias remains neutral-to-bullish as long as Bank Nifty holds above 57,590. The best approach is to trade reactively — not predictively — allowing price action confirmation to lead your decisions.
Stay disciplined, respect your stop losses, and remember: capital preservation is the first step to profitability. 💪📊
⚠️ Disclaimer:
I am not a SEBI-registered analyst. This analysis is purely for educational and informational purposes. Please conduct your own research or consult a certified financial advisor before taking any trading or investment decision.

BANK NIFTY – Professional Trading Plan for 23-Oct-2025Market context and key levels
Reference from your map: Opening Resistance 58,118; Opening Support 57,908; Last Intraday Support 57,723 and deeper 57,539; overhead resistance band 58,368 (last intraday) and 58,609. Bias is neutral-to-positive while above 57,908; momentum continuation requires acceptance above 58,118, whereas sustained loss of 57,723 flips control to bears. 🚦
GAP UP OPEN (≥ +200 pts)
Educational logic: Strong positive gaps often trap shorts; wait for acceptance above resistance (time + volume) before continuation. 📈
If open lands around 58,080–58,150 and first 5–15 min hold above VWAP/first high, consider a momentum long toward 58,250–58,320; partials there, then trail for 58,368 and 58,500–58,609. Stop below the retest low near 58,040–58,060.
If open jumps near 58,350–58,420, avoid chasing into resistance. Prefer a pullback to 58,220–58,180; go long only on a higher low and reclaim of 58,250 with a tight stop under the pullback low; targets 58,368 → 58,500–58,609.
Failure short: Rejection wicks from 58,350–58,420 followed by a 15‑min close back below 58,200. Tactical short to 58,118 → 58,020–57,980; cover if 58,250 is reclaimed decisively.
FLAT OPEN (±0–75 pts)
Educational logic: Neutral opens favor range trades near pivots until a breakout confirms with acceptance. ⚖️
Range buy: Look for reversal signals near 57,930–57,908 with risk below the session swing; targets 58,020 → 58,118.
Breakout buy: A 15‑min close and successful retest above 58,118 opens 58,200–58,250; scale out into 58,368 and, if momentum broadens, 58,500–58,609.
Breakdown short: Acceptance below 57,908 on retest targets 57,820–57,760; if sellers maintain control, extend to 57,723 and 57,650–57,600. Trail using successive lower highs.
GAP DOWN OPEN (≤ −200 pts)
Educational logic: Negative gaps near support can lead to “gap‑and‑go” trend days if acceptance stays below, or sharp reversals if buyers defend key zones. 📉
Gap‑and‑go short: Open around 57,760–57,730 and failure to reclaim 57,908 on retest → short to 57,723; take partials, then trail for 57,650–57,600 and 57,539 if momentum persists.
Reversal long: Strong rejection from 57,723–57,650 (long lower wicks/engulfing) → long back to 57,820 then 57,908; move stop to breakeven once 57,908 holds.
Bias flip: If price re-enters above 58,020 and sustains, switch to long setups for 58,118 → 58,250; avoid fighting a reclaim day.
Execution checklist
Predefine scenario, trigger (acceptance or clean retest), invalidation (where the idea is wrong), and first target.
Key decision areas: 57,908 pivot support, 58,118 resistance to beat, 58,368/58,609 overhead resistances; 57,723 and 57,539 supports. Trade the reaction to zones, not exact ticks.
Use structure-based stops beyond the opposite side of the zone; scale out at the next pivot and trail to protect gains.
Options risk management tips
Define risk : Prefer debit spreads near zones (bull call above 58,118; bear put below 57,908/57,723) to cap tail risk on volatile gap opens.
Size by volatility: Wider expected range → smaller size; avoid oversizing because options “look cheap.”
Liquidity first: Use near‑ATM, current‑week Bank Nifty options with tight spreads; avoid illiquid deep OTMs that decay fast in chop.
Confirm before entry: Wait for 5–15 min acceptance or a clean retest hold; be cautious in the first 1–3 minutes unless trading a planned opening drive.
Manage winners: Take partials at first pivot; if IV expands, consider converting naked calls/puts into verticals to lock risk while keeping upside.
Avoid overlap: If structure flips (e.g., reclaim above 58,020 after breakdown), exit losers decisively instead of hedging passively.
Summary
Core map: 57,908 is the intraday pivot; 58,118 is the gate to upside continuation; 58,368–58,609 is upper resistance; 57,723 then 57,539 are key buyer defenses. Upside opens on acceptance above 58,118 toward 58,368/58,609, while downside strengthens below 57,908/57,723 toward 57,650–57,539. 🙂
Conclusion
Prepare three plays: continuation long above 58,118, responsive range trades around 57,908/58,020 with clear triggers, and momentum shorts below 57,908/57,723 targeting 57,650–57,539. Execute with strict invalidations, scale responsibly, and adapt quickly if pivots are reclaimed. 📊
Disclaimer: This is an educational plan, not investment advice or a trade recommendation; I am not a SEBI registered analyst .

BANKNIFTY – Professional Trading Plan for 20-Oct-2025 BANK NIFTY – Professional Trading Plan for 20-Oct-2025 (educational)
Market context and key levels
Reference from your map: Opening Resistance 57,877; Opening Support 57,539; Opening Support box 57,291–57,334; Last Intraday Support 57,022; Last Intraday Resistance 58,118. A wide No‑Trading Zone is marked around 57,600–57,820 where chop risk is high. Bias is constructive above 57,539 with momentum only on acceptance beyond 57,877; sustained loss of 57,334/57,291 hands control to bears. 🚦
GAP UP OPEN (≥ +200 pts)
Educational logic: Strong positive gaps can trap late shorts; wait for acceptance above resistance (time + volume) instead of chasing the first spike. 📈
If open prints around 57,820–57,900 and first 5–15 minutes hold above VWAP/first high, consider a momentum long toward 58,000–58,050; scale partials, then trail for 58,118 (last intraday resistance). Stop below the retest low near 57,780–57,800.
If open jumps near 58,050–58,120, avoid impulsive buys into resistance. Prefer a pullback to 57,930–57,880; go long only on a higher low and reclaim of 57,980 with stop under pullback low; targets 58,050 → 58,118 and extension if breadth improves.
Failure short: Rejection wicks from 58,050–58,118 followed by a 15‑min close back below 57,900. Tactical short to 57,877 → 57,780 → 57,700; cover if 57,980 is reclaimed decisively.
FLAT OPEN (±0–75 pts)
Educational logic: Neutral opens favor range trades around nearby pivots until a breakout confirms with acceptance; avoid chop inside the No‑Trading Zone . ⚖️
Avoid initiating inside 57,600–57,820 unless taking planned scalps; wait for a break and retest.
Breakout long: A 15‑min close and successful retest above 57,877 opens 57,950–58,000; scale out into 58,050–58,118 if momentum broadens.
Breakdown short: Acceptance below 57,539 on retest targets 57,420–57,360; if sellers keep control, extend to the 57,334–57,291 support box. Trail using lower‑highs.
GAP DOWN OPEN (≤ −200 pts)
Educational logic: Negative gaps near support can either trend down (“gap‑and‑go”) or reverse sharply if buyers defend key areas. 📉
Gap‑and‑go short: Open around 57,360–57,320 and failure to reclaim 57,539 on retest → short to 57,334–57,291; take partials in the box; extend to 57,150–57,050 and 57,022 if acceptance stays below 57,291.
Reversal long: Strong rejection from 57,291–57,334 (long lower wicks/engulfing) → long back to 57,480 then 57,539; move stop to breakeven once 57,539 holds.
Bias flip: If price re-enters above 57,700 and sustains, shift to long setups for 57,820 → 57,877; avoid fighting a reclaim day.
Execution checklist
Predefine scenario, trigger (acceptance/retest), invalidation (where the idea is wrong), and first target.
Key decision zones: 57,291–57,334 buyers’ box, 57,539 pivot support, 57,877 resistance, 58,118 major resistance. Trade reactions to zones, not exact ticks.
Use structure-based stops beyond the far side of each zone; scale out at the next pivot and trail to protect gains.
Options risk management tips
Define risk : Prefer debit spreads near decision areas (bull call above 57,877; bear put below 57,539/57,334) to cap tail risk on volatile gap opens.
Size by volatility: Wider expected range → smaller size; don’t oversize because premiums “look cheap.”
Liquidity first: Use near‑ATM, current‑week Bank Nifty options with tight spreads; avoid illiquid deep OTMs that decay quickly in chop.
Confirm before entry: Wait for 5–15 min acceptance or a clean retest hold; be cautious in the first 1–3 minutes unless trading a planned opening drive.
Manage winners: Take partials at first pivot; if IV expands, consider converting naked calls/puts into verticals to lock risk while keeping upside.
Avoid overlap: If structure flips (e.g., reclaim above 57,700 after breakdown), exit losers decisively rather than hedging passively.
Summary
Core map: 57,291–57,334 is buyer defense; 57,539 is the intraday pivot; 57,877 is the gate to upside continuation; 58,118 is the upper resistance. Upside opens on acceptance above 57,877 toward 58,000–58,118, while downside strengthens below 57,539/57,334 toward 57,150–57,022. 🙂
Conclusion
Prepare three plays: continuation long above 57,877, responsive range trades around 57,539/57,700 only with clear edges, and momentum shorts below 57,539/57,334 aiming 57,150–57,022. Execute with strict invalidations, scale responsibly, and adapt quickly if pivots are reclaimed. 📊
Disclaimer: This is an educational plan, not investment advice or a trade recommendation; I am not a SEBI registered analyst .

BANKNIFTY : Professional Trading Plan for 17-Oct-2025BANK NIFTY – Professional Trading Plan for 17-Oct-2025 (educational)
Market context and key levels
Reference map from your chart: Opening Support/Resistance 57,535; Opening Support 57,257; Last Intraday Support 57,175; Buyer’s Support box 57,023–56,957; Overhead resistance 57,887. Trend remains constructive while above 57,175–57,257; momentum continuation requires acceptance over 57,535. 🚦
GAP UP OPEN (≥ +200 pts)
Educational logic: Positive gaps can trap late shorts; the edge is to wait for acceptance above resistance (time + volume) before continuation. 📈
If open lands around or just above 57,535 and first 5–15 minutes hold above VWAP/first high, consider a momentum long toward 57,650–57,720; partial profit there, then trail for 57,820–57,887. Stop below the retest low of 57,500 zone.
If open jumps near 57,800–57,880, avoid chasing into resistance. Prefer a pullback to 57,600–57,535; go long only on a higher low and reclaim of 57,650 with stop below the pullback low; targets 57,820 → 57,887.
Failure short: Rejection wicks from 57,800–57,887 followed by a 15‑min close back below 57,600. Tactical short to 57,535 → 57,400–57,257. Exit if 57,650 is reclaimed decisively.
FLAT OPEN (±0–75 pts)
Educational logic: Neutral opens favor range trades between nearby pivots until a breakout confirms with acceptance. ⚖️
Range buy: Look for reversal signals near 57,300–57,257 with risk below session swing; targets 57,450 → 57,535. Tight risk because mid-range chop is common.
Breakout buy: A 15‑min close and successful retest above 57,535 opens 57,650–57,720; scale out into 57,820–57,887 if momentum broadens.
Breakdown short: Acceptance below 57,257 on retest aims 57,200–57,175; if sellers maintain control, extend to 57,080 then the Buyer’s box 57,023–56,957. Trail using lower‑highs.
GAP DOWN OPEN (≤ −200 pts)
Educational logic: Negative gaps near support can either trend down (“gap‑and‑go”) or reverse sharply if buyers defend key zones. 📉
Gap‑and‑go short: Open around 57,150–57,120 and failure to reclaim 57,175 on retest → short to 57,080 then 57,023–56,957. Book partials into the box; hold a runner only if acceptance stays below 57,023.
Reversal long: Strong rejection from 57,023–56,957 (long lower wicks/engulfing) → long back to 57,175 then 57,257; move stop to breakeven once 57,175 holds.
Bias flip: If price re-enters above 57,257 and sustains, shift to long setups for 57,450 → 57,535. Avoid fighting a reclaim day.
Execution checklist
Predefine scenario, trigger (acceptance/retest), invalidation (where idea is wrong), and first target.
Key decision zones: 57,175–57,257 supports; 57,535 resistance/pivot; 57,887 resistance. Trade reactions to zones, not exact ticks.
Use structure-based stops beyond the opposite side of the zone; scale out at the next pivot and trail to protect gains.
Options risk management tips
Define risk : Prefer debit spreads near zones (bull call above 57,535; bear put below 57,257) to cap tail risk on volatile gap opens.
Size by volatility: Wider expected range → smaller size; avoid oversizing because premiums “look cheap.”
Liquidity first: Stick to near‑ATM, current‑week Bank Nifty options with tight spreads; avoid illiquid deep OTMs that decay fast if rangebound.
Enter on confirmation: Use 5–15 min acceptance or clean retest holds; avoid impulsive trades in the first 1–3 minutes unless pre‑planned opening drive.
Manage winners: Take partials at first pivot; if IV expands, consider converting naked calls/puts to verticals to lock risk while keeping upside.
Event awareness: Watch for midday global cues or bank stock news; if structure flips (e.g., reclaim of 57,257 after breakdown), exit losers decisively rather than hedging passively.
Summary
Core map: 57,175–57,257 is buyer defense; 57,535 is the gate to upside continuation; 57,887 is upper resistance. Upside opens on acceptance above 57,535 toward 57,720–57,887, while downside strengthens below 57,257 toward 57,175 and 57,023–56,957. 🙂
Conclusion
Prepare three plays: continuation long above 57,535, responsive range trades around 57,257/57,535, and momentum shorts below 57,257 with extensions to 57,023–56,957. Execute with clear invalidations, scale responsibly, and adapt quickly if pivots are reclaimed. 📊
Disclaimer: This is an educational plan, not investment advice or a trade recommendation; I am not a SEBI registered analyst .

#BankNifty Update: Ready for a Breakout to New All-Time HighsAs per the updates shared on March 17 and May 15, 2025 , #BankNifty continued to hold firmly above the 100-week SMA , confirming its position in the #TrendReversalZone . The index decisively broke above previous swing highs and surged to a new all-time high of 57,628 .
Following this, it has once again retested the breakout zone (green zone) , a classic resistance-turned-support area, and is now bouncing higher. This successful retest, signals strength for the next leg up.
Looking ahead, #BankNifty appears ready to surpass its previous ATH, with key support zones at 56,250 – 56,283 and 55,527 – 55,459 . As long as the green zone levels hold, the bullish structure remains intact, with potential upside targets at 58,900 and 62,400 .
📌 Disclaimer: This analysis is shared for educational purposes only. It is not a buy/sell recommendation. Please do your own research before making any trading decisions.
#BankNifty | #BullishTrend | #AllTimeHigh | #TechnicalAnalysis | #PriceAction
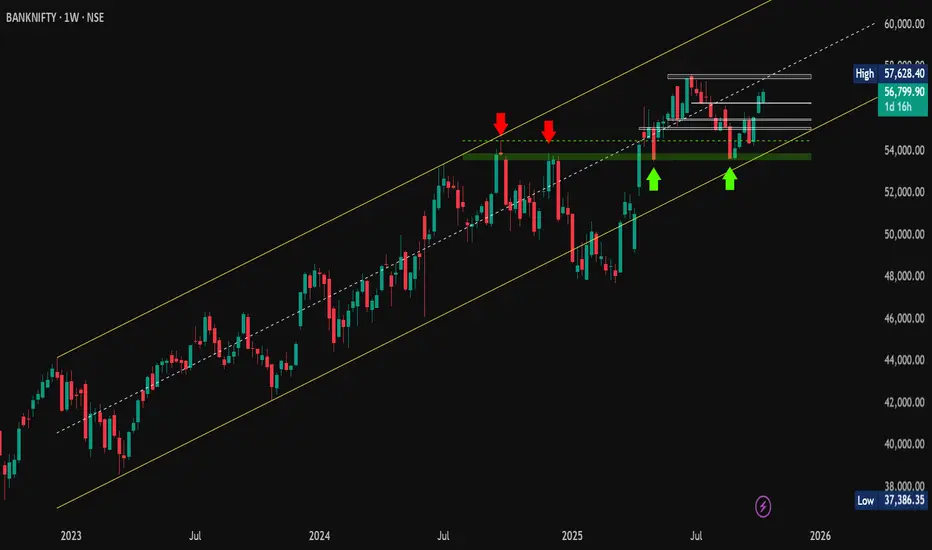
BANKNIFTY : Professional Trading Plan for 16-Oct-2025BANK NIFTY – Professional Trading Plan for 16-Oct-2025 (educational)
Market context and key levels
Reference map: price closed around 56,820 with an opening resistance/support band at 56,806–56,903, opening support near 56,745/56,800 zone, last intraday support at 56,574–56,633, and deeper support at 56,377. Overhead reference resistance stands near 57,174. Trend bias is constructive while above 56,745–56,800; momentum unlocks only on acceptance above 56,903, while sustained loss of 56,574–56,633 hands control to bears. 🚦
GAP UP OPEN (≥ +200 pts)
Educational logic: A strong positive gap can trap late shorts; edge comes from confirming “acceptance” above resistance, then riding continuation rather
If open lands inside/just above 56,900–57,000 and first 5–15 minutes hold above VWAP, consider a momentum long targeting 57,050–57,100; partial profits there, then trail for 57,174. Stop below the retest low of 56,900 zone.
If open jumps near 57,150–57,200, avoid impulsive buys into resistance. Prefer a pullback to 56,980–56,900; go long only on a higher low and reclaim of 57,000–57,050, with stop below pullback low; targets 57,174 then 57,250 if extension.
Failure short: Rejection wicks from 57,120–57,200 followed by a 15‑min close back below 56,980. Enter tactical short toward 56,903 → 56,820–56,745; cover if 57,000 is reclaimed with strength.
FLAT OPEN (±0–75 pts)
Educational logic: Neutral opens favor range trades around nearby pivots until a confirmed breakout
Range buy: Look for reversal signals near 56,780–56,745 with risk beneath the session swing; targets 56,903 then 56,980–57,000.
Breakout buy: A 15‑min close and successful retest above 56,903 opens 56,980–57,050, scaling out into 57,100–57,174 if momentum broadens.
Breakdown short: Acceptance below 56,745 on retest aims 56,633–56,574; extension possible to 56,450–56,377 if sellers maintain control. Stops trail above the last lower high.
GAP DOWN OPEN (≤ −200 pts)
Educational logic: Negative gaps near support often lead to “gap‑and‑go” trend days if acceptance stays below, or fast revers
Gap‑and‑go short: Open around 56,600–56,580 and failure to reclaim 56,633 on retest → short to 56,520 then 56,450–56,377. Take partials at each target; trail using 5–15 min lower highs.
Reversal long: Strong rejection from 56,377 (long lower wicks/engulfing) → long back to 56,520 then 56,574–56,633; move stop to breakeven once 56,633 is accepted.
Bias flip: If price re-enters above 56,745 and sustains, abandon shorts and prepare for rotation to 56,900–56,980. Don’t fight a reclaim day—trade with acceptance, not with opinion.
Execution checklist
Predefine your scenario, entry trigger (acceptance/retest), invalidation (where the idea is wrong), and first target.
Treat 56,745, 56,806–56,903, and 57,174 as decision areas. Act on the reaction to these zones, not on the exact number.
Use structure-based stops: beyond the last swing or far side of the zone. Scale out at each next pivot and trail to protect gains.
Options risk management tips
Define risk : Prefer debit spreads around decision areas (bull call above 56,903; bear put below 56,745) to cap tail risk on volatile gap opens.
Size by volatility: Wider expected ranges require smaller position size; don’t oversize because premiums “look cheap.”
Liquidity first: Stick to near‑ATM, current‑week Bank Nifty options with tight spreads; avoid illiquid deep OTMs that decay rapidly if rangebound.
Enter on confirmation: Use 5–15 min acceptance or clean retest holds to avoid false breakouts; be cautious in the first 1–3 minutes unless trading a planned opening drive.
Manage winners: Take partials at the first pivot; if IV expands in your favor, consider converting naked calls/puts into vertical spreads to lock risk while keeping upside.
Event awareness: Watch for midday global cues and financial stock news; if structure flips (e.g., reclaim of 56,745 after breakdown), exit losers decisively rather than hedging passively.
Summary
Core range: 56,745 support to 56,903 resistance. Upside requires acceptance above 56,903 to target 56,980–57,050 and possibly 57,174; downside gains traction below 56,745 toward 56,633–56,574 and 56,377. Trade level‑to‑level with defined risk. 🙂
Conclusion
Prepare three plays: continuation long above 56,903, responsive range trades around 56,745/56,900, and momentum shorts below 56,745 with extensions to 56,574–56,377. Execute with clear invalidations, scale responsibly, and adapt quickly if key pivots are reclaimed. 📊
Disclaimer: This is an educational plan, not investment advice or a trade recommendation; I am not a SEBI registered analyst .
