BANKNIFTY : Trading levels and Plan for 14-Oct-2025BANK NIFTY TRADING PLAN – 14-Oct-2025
📊 Chart Timeframe: 15-Min | Analysis by LiveTradingBox
📈 Index Close: 56,633.10 (+0.04%)
🔹 Key Zones to Watch:
🟥 Last Intraday Resistance: 56,876 – 57,284
🟧 Opening Resistance / Support: 56,743
🟨 Opening Support: 56,586
🟩 Last Intraday Support: 56,209 – 56,275
🟦 Major Support: 56,018
🚀 Scenario 1: Gap-Up Opening (200+ Points Above Previous Close)
If Bank Nifty opens near or above the 56,876 – 57,000 zone, traders should be alert for potential profit booking or consolidation in the higher zone. The index has already witnessed a short-term rally, so immediate breakout trades may not sustain.
Wait for the first 15–30 minutes for price stability and observe if the index can sustain above 56,876.
If it sustains and closes a strong candle above 56,900, the next short-term upside target could be 57,150 – 57,284.
However, if Bank Nifty fails to sustain above 56,876, expect a pullback toward 56,743 or even 56,586, which can act as re-entry zones for buyers.
Avoid aggressive call buying immediately after a gap-up; wait for retracement confirmation with a bullish candle.
🟢 Educational Note: After a large gap-up, institutions often book partial profits to test liquidity below. Smart traders wait for these dips rather than chasing early candles.
⚖️ Scenario 2: Flat Opening Near 56,600 – 56,650
A flat start near the Opening Resistance/Support (56,743) suggests market indecision. This level is a pivotal area where both bulls and bears will try to dominate early moves.
If Bank Nifty sustains above 56,743, it may attempt a breakout toward 56,876, and a close above that level could open the path for 57,100–57,284.
Failure to hold 56,586 may invite short-term selling pressure toward 56,400, and deeper correction toward 56,275.
Sideways or range-bound action is possible initially between 56,586–56,743. Avoid trading within this band to prevent getting caught in false moves.
Trade breakouts only with volume confirmation and follow-through candles.
🟠 Educational Tip: In flat openings, it’s vital to identify the intraday range early. Let the market show direction rather than assuming it — disciplined patience avoids emotional trades.
🔻 Scenario 3: Gap-Down Opening (200+ Points Below Previous Close)
If Bank Nifty opens near 56,250 – 56,200, the focus shifts to the Last Intraday Support Zone (56,209–56,275). This region is crucial where bargain hunters may enter, but a failure to hold can lead to further weakness.
Watch for bullish reversal patterns like a hammer candle or higher low around 56,209–56,275 for potential long entries.
A rebound from this zone could retest 56,586 and later 56,743 if momentum supports.
If the index breaks below 56,209, next immediate support lies near 56,018, where strong buyers could reappear.
Traders should avoid panic shorting at open; instead, wait for a pullback to enter with a controlled stop loss.
🔴 Educational Note: Gap-downs often trigger emotional trades, but professional traders wait for confirmation of whether support holds before acting. The best entries happen when emotion fades and structure forms.
💡 Risk Management Tips for Options Traders
Trade only one side of the market — avoid holding both CE and PE simultaneously.
Define your maximum risk per trade (1–2% of total capital).
Avoid trading during high volatility spikes post 9:15; wait for price confirmation after 9:45 AM.
Use stop-loss orders on every trade and respect them — never average losing positions.
Book partial profits when premiums rise 30–40%, and trail your stop loss to breakeven.
For intraday trades, avoid holding positions post 3:15 PM to reduce theta decay and overnight risk.
📘 Summary & Conclusion
Bank Nifty remains in a neutral to mildly bullish phase as long as 56,586 holds on an hourly closing basis. The upper resistance zone of 56,876–57,284 will be the deciding region for further bullish continuation. Meanwhile, the 56,209–56,275 area remains the key defensive zone where buyers could regain control.
Traders should maintain discipline, avoid emotional trading around volatility zones, and prioritize setups that align with price confirmation. Consistency comes not from prediction — but from execution with control and patience. 🧘♂️
⚠️ Disclaimer:
I am not a SEBI-registered analyst. The above analysis is purely for educational and informational purposes. Please perform your own research or consult a registered financial advisor before trading or investing.
Bankniftyanalysis

BANKNIFTY : Trading levels and plan for 13-Oct-2025BANK NIFTY TRADING PLAN – 13-Oct-2025
📊 Chart Timeframe: 15-min
📍 Last Close: 56,620.95 | 🔼 +17.70 pts (+0.03%)
📅 Analysis Type: Psychological + Technical Level-based Strategy
🔍 Key Technical Levels to Watch
🟥 Last Intraday Resistance: 57,068
🟧 Opening Resistance / Support: 56,743
🟠 Opening Support: 56,499
🟩 Last Intraday Support: 56,265
🟢 Lower Support Zone: 56,031
🚀 Scenario 1 – Gap Up Opening (200+ pts above 56,800)
If Bank Nifty opens above 56,800, it will be entering a resistance-heavy zone between 56,743 – 57,068.
Initially, allow prices to stabilize for the first 15–30 minutes — a close above 57,068 on the 15-min chart can open the gates toward 57,200+ levels.
Aggressive buying at open should be avoided; instead, look for a controlled pullback near 56,743–56,780, which can act as a potential retest entry zone for a long setup.
If the index fails to sustain above 56,743, short-term profit booking may drag prices back toward 56,499, providing another reaction zone for intraday reversal trades.
Traders should track the price structure — any rejection candles near 57,000–57,068 may indicate exhaustion of buying momentum.]
💡 Educational Note:
Gap-up openings near a resistance zone are often traps for impatient buyers. A retest and confirmation close are essential to validate trend continuation. Let volume support your bias.
⚖️ Scenario 2 – Flat Opening (Around 56,550 ± 100 pts)
A flat opening around the previous close keeps Bank Nifty within the decision zone between 56,499 – 56,743.
Sustained move above 56,743 will likely invite bullish momentum toward 57,068; this level can act as a short-term target zone for intraday buyers.
If prices fail to hold above 56,499, weakness may creep in, exposing the index toward 56,265 — the last intraday support.
A bounce from 56,265 can provide a good low-risk buying opportunity, but any close below it will open the downside toward 56,031.
Flat openings often lead to range-bound sessions initially; hence, let the direction develop through price confirmation rather than anticipation.]
🧠 Educational Tip:
Flat openings are ideal for breakout traders — the first breakout candle from the mid-range (above 56,743 or below 56,499) generally defines the day’s directional move. Patience is key.
📉 Scenario 3 – Gap Down Opening (200+ pts below 56,400)
If Bank Nifty opens below 56,400, the tone turns slightly bearish as the index approaches the support reaction zone near 56,265–56,031.
Observe how the price behaves near 56,265 — if a strong reversal candle appears with volume, it can trigger a short-covering bounce toward 56,499.
Failure to defend 56,265 may lead to a deeper test of 56,031, where aggressive shorting should be avoided as it’s a probable buyer’s reaction area.
A 15-min close below 56,031 could accelerate downside momentum, exposing the index to 55,800–55,750 levels.
In a gap-down scenario, wait for the initial panic to settle before initiating trades — reversals tend to occur swiftly after the first 30 minutes.]
💬 Educational Insight:
Gap-down openings near major supports often trigger emotion-driven trades. Wait for confirmation before entering. Avoid fighting momentum — trade with trend, not against it.
🛡️ Risk Management Tips for Options Traders
Never risk more than 2%–3% of your trading capital on a single position.
Use hourly or 15-min candle close to confirm stop losses — avoid impulsive exits on noise.
Prefer ATM or slightly ITM options to minimize time decay impact.
In volatile conditions, use Bull Call or Bear Put spreads to control premium erosion.
Always maintain a defined exit plan; book partial profits once your trade achieves 1:1 risk/reward ratio.
Avoid holding losing trades beyond 2:45 PM, as time decay accelerates sharply. 💎]
📊 Summary & Conclusion
Bank Nifty remains in a broad consolidation phase, with critical resistance at 57,068 and major support at 56,031.
Above 56,743, the structure favors buyers aiming for 57,068+, while below 56,265, weakness can extend toward 56,031.
Traders should focus on price confirmation, not prediction — react to levels, don’t pre-empt them.
Maintaining discipline, risk control, and emotional balance remains the foundation of consistent trading.]
🎯 Focus Levels for 13-Oct-2025:
🟩 Buyers’ Defensive Zone: 56,265 → 56,031
🟥 Sellers’ Control Zone: 56,743 → 57,068
📢 Disclaimer:
I am not a SEBI-registered analyst . The above analysis is purely for educational and informational purposes. Traders should perform their own analysis or consult a registered financial advisor before taking any trading decisions.

BANKNIFTY : Trading levels and plan for 10-Oct-2025BANK NIFTY TRADING PLAN – 10-Oct-2025
📊 Chart Timeframe: 15-min
📍 Last Close: 56,143.15 | 🔻 Change: -27.40 pts (-0.05%)
📅 Analysis Based on Psychological & Technical Structure
🔍 Key Technical Zones
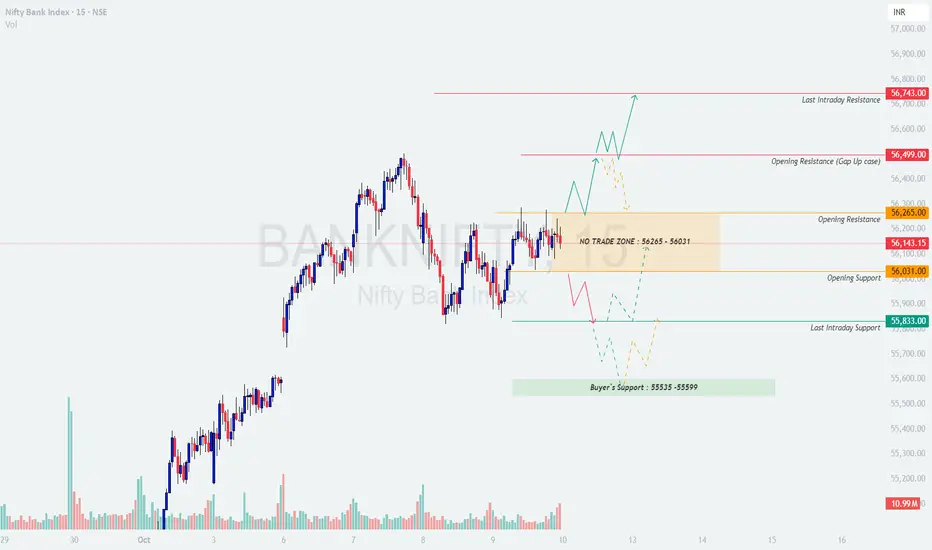
🟧 No Trade Zone: 56,265 – 56,031
🟥 Last Intraday Resistance: 56,743
🟠 Opening Resistance (Gap-Up Case): 56,499
🟩 Opening Support: 56,031
🟢 Last Intraday Support: 55,833
💚 Buyer’s Support Zone: 55,535 – 55,599
🚀 Scenario 1 – Gap Up Opening (200+ pts above 56,350)
If Bank Nifty opens near or above 56,350, it directly enters the opening resistance zone.
Wait for the first 15–30 minutes — a strong close above 56,499 will confirm bullish continuation toward 56,743, the last intraday resistance.
Avoid buying immediately on open; instead, look for a healthy retest of 56,265–56,300 to establish long entries with a favorable risk/reward setup.
If prices face rejection from 56,499, expect mild profit booking that could drag Bank Nifty back toward the No Trade Zone (56,265–56,031).
Sustained rejection candles near 56,700–56,740 could trigger short opportunities for quick scalps — but only after confirmation via an hourly close below 56,499.]
💡 Educational Tip:
Gap-up openings near major resistance levels are often liquidity traps. Always wait for price confirmation and volume support before taking directional trades. Patience gives better accuracy than early anticipation.
⚖️ Scenario 2 – Flat Opening (Around 56,100 ± 100 pts)
A flat opening keeps Bank Nifty inside the No Trade Zone (56,265–56,031), demanding patience and precision.
If the index sustains above 56,265, intraday bulls may regain control, pushing prices toward 56,499 → 56,743.
A breakout candle above 56,265 with increasing volume can be used as an entry trigger for long positions.
On the other hand, failure to sustain above 56,031 will expose the index to weakness toward 55,833 and further down to 55,599–55,535 (Buyer’s Support).
Traders should ideally wait for a clean break from this zone before initiating any directional positions to avoid getting trapped in sideways movements.]
🧠 Educational Note:
Flat openings near mid-zones are “decision areas” — breakout confirmation candles (either side) generally dictate the intraday trend. Avoid overtrading during this phase.
📉 Scenario 3 – Gap Down Opening (200+ pts below 55,950)
If Bank Nifty opens near or below 55,950, it immediately enters the support-testing phase.
Monitor reactions closely near 55,833–55,800; a sharp recovery from this zone may trigger short-covering rallies toward 56,031–56,100.
However, sustained weakness below 55,800 may lead prices toward the critical Buyer’s Support Zone (55,535–55,599) — a must-hold area for bulls.
A 15-min close below 55,535 can attract panic selling and accelerate downside momentum toward 55,300–55,250.
Avoid aggressive buying in a gap-down scenario unless there’s a clear reversal candle or double-bottom formation within the buyer’s zone.]
💬 Educational Insight:
Gap-down openings generally favor experienced traders who understand reversal patterns. Let the first 30 minutes decide whether the move is genuine or an overreaction — discipline matters more than direction here.
🛡️ Risk Management Tips for Options Traders
Never risk more than 2%–3% of trading capital per trade.
Use a stop loss based on 15-min candle close, not random points.
Avoid buying deep OTM options — focus on ATM or slightly ITM for better delta exposure.
When volatility is high, consider using vertical spreads (Bull Call / Bear Put) to manage theta decay.
Book partial profits at 1:1 risk–reward; let the rest trail with stop adjustments.
Do not hold losing positions beyond 2:45 PM — protect your capital before time decay erodes premiums. 💎]
📊 Summary & Conclusion
Bank Nifty currently trades within a consolidation band, with directional clarity expected only outside 56,265–56,031.
Above 56,499, momentum buyers may target 56,743, while sustained weakness below 55,833 can pull prices toward 55,599–55,535.
Traders should prioritize level confirmations, volume analysis, and strict stop-loss adherence for consistent performance.]
🎯 Focus Zone for 10-Oct-2025:
🟩 55,599 → 55,535 (Buyers’ Defensive Zone)
🟥 56,499 → 56,743 (Sellers’ Control Zone)
📢 Disclaimer:
I am not a SEBI-registered analyst . The above analysis is meant purely for educational and informational purposes. Traders are advised to conduct their own research or consult a financial advisor before making trading decisions.
BANKNIFTY : Trading levels and plan for 07-Oct-2025BANK NIFTY TRADING PLAN – 07-Oct-2025
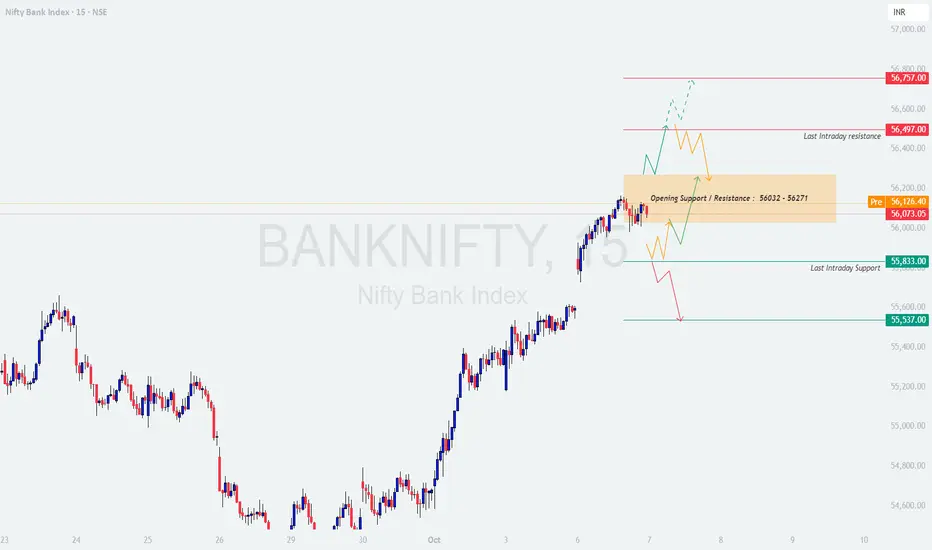
Bank Nifty closed at 56,073, showing slight consolidation after a strong rally in recent sessions. The index is currently hovering around a short-term decision zone, suggesting that the next directional move could emerge from the Opening Support/Resistance band (56,032 – 56,271). Tomorrow’s behavior around this area will be critical to define intraday bias.
📊 Key Technical Levels:
Opening Support / Resistance: 56,032 – 56,271
Last Intraday Resistance: 56,497
Major Resistance: 56,757
Last Intraday Support: 55,833
Major Support: 55,537
🚀 Scenario 1: Gap Up Opening (200+ points)
If Bank Nifty opens above 56,271, it will likely attempt to test the Last Intraday Resistance at 56,497 .
Sustained trading above 56,497 may extend the bullish trend toward 56,757, marking a potential breakout zone for momentum traders.
However, if the index fails to hold above 56,271 and shows rejection candles near resistance, early profit booking can push prices back toward the 56,032 zone.
Traders should wait for a 15-min confirmation candle above 56,497 before entering long positions. Avoid chasing a gap-up blindly.
📘 Educational Note: Gap-ups near resistance often trigger early euphoria but also risk reversal traps. Always confirm a breakout with strong volume and closing strength.
⚖️ Scenario 2: Flat Opening (within ±200 points)
A flat opening near 56,000 will keep the price action within the Opening Support/Resistance zone (56,032 – 56,271) .
If the price sustains above 56,271, bulls could regain control and target 56,497.
On the contrary, a breakdown below 56,032 may invite selling pressure, dragging the index towards 55,833 initially.
The best strategy here is to let the first 30 minutes define direction — trade only on clear breakouts from this box range.
📘 Educational Note: Flat openings reflect indecision. Allow the market to establish direction through initial range expansion before positioning aggressively.
📉 Scenario 3: Gap Down Opening (200+ points)
If Bank Nifty opens near 55,800 or below, it will test the Last Intraday Support at 55,833 .
A decisive breakdown below 55,833 can extend weakness toward 55,537, which is a key bounce zone.
Conversely, if 55,833 holds firmly and bullish reversal candles form, expect a short-covering move toward 56,000+.
Avoid aggressive shorts near 55,537; this level can attract strong dip-buying interest.
📘 Educational Note: Gap-downs often create emotional selling. Instead of panic trades, look for reversal confirmations at major supports for high R:R setups.
🛡️ Risk Management Tips for Options Traders
🕒 Avoid trading in the first 15–30 minutes — allow volatility to settle.
🛑 Always use hourly candle closes for SL validation instead of reacting to noise.
💡 Prefer Bull Call / Bear Put Spreads near key levels to manage premium decay.
💰 Follow a strict 1:2 Risk-Reward Ratio — never enter trades without clear R:R visibility.
📉 Trail profits after every 100–150 points to protect gains in trending markets.
🚫 Never risk more than 2%–3% of total capital on a single trade.
📌 Summary & Conclusion
Bullish Bias: Above 56,497, upside targets 56,757 → 56,900.
Neutral Zone: Between 56,032 – 56,271, expect sideways volatility until breakout.
Bearish Bias: Below 55,833, weakness may extend towards 55,537.
📈 The index remains in a short-term uptrend but faces immediate resistance at 56,497. A breakout could extend momentum, while a failure near resistance may trigger mild correction. Patience and disciplined entries near levels will be key to capturing tomorrow’s move effectively.
⚠️ Disclaimer: This analysis is for educational purposes only. I am not a SEBI-registered analyst. Please perform your own research or consult a financial advisor before taking any trading decisions.
BANKNIFTY : Trading levels and Plan for 06-Oct-2025BANK NIFTY TRADING PLAN – 06-Oct-2025
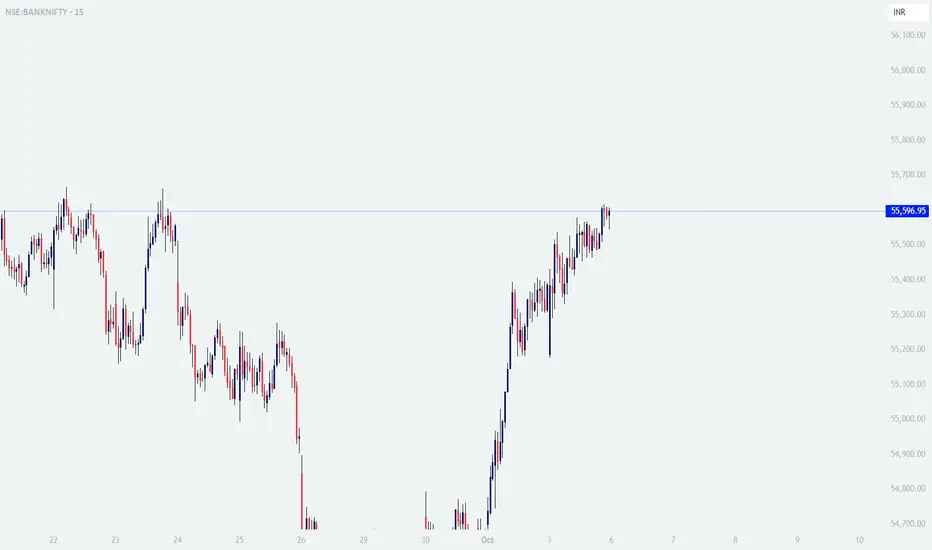
Bank Nifty closed at 55,596, showing strong recovery momentum from recent lows. The index now sits near a crucial decision zone with both support and resistance levels clearly defined. Tomorrow’s opening behavior will decide whether bullish momentum continues or if a pullback emerges.
📌 Key Levels to Watch:
Opening Support Zone: 55,407 – 55,559
Opening Resistance: 55,835
Last Intraday Resistance: 56,050
Last Intraday Support: 55,178 & 55,031
🚀 Scenario 1: Gap Up Opening (200+ points)
If Bank Nifty opens around 55,800 – 55,900, it will directly test the Opening Resistance (55,835) .
A sustained breakout above 55,835 could trigger strong upside momentum towards 56,050 and potentially 56,200.
However, rejection from resistance could invite profit booking back towards the 55,559 zone .
Traders should avoid chasing the gap-up blindly and instead wait for either a breakout confirmation above 55,835 or a rejection signal.
👉 Educational Note: Gap-ups near major resistance zones often create traps. Always wait for a retest before confirming direction.
⚖️ Scenario 2: Flat Opening (within ±200 points)
A flat start near 55,500 – 55,600 will keep the index inside the Opening Support Zone (55,407 – 55,559) .
If prices hold this zone and break above 55,835, bullish continuation is expected towards 56,050.
On the downside, a breakdown below 55,407 can push prices back to test 55,178 – 55,031 levels.
Traders should be patient in the first 15–30 minutes to see if support holds or breaks.
👉 Educational Note: Flat openings usually lead to consolidation before a clear breakout. Look for range expansion setups to catch trending moves.
📉 Scenario 3: Gap Down Opening (200+ points)
If Bank Nifty opens near or below 55,200 – 55,150, it will immediately test the Last Intraday Support at 55,178 .
A breakdown below 55,178 can extend weakness towards 55,031 – 54,900.
However, if support holds strongly around 55,178 – 55,031, a short-covering rally towards 55,500+ is highly possible.
Patience is crucial – avoid aggressive shorts unless 55,178 breaks with strong volume confirmation.
👉 Educational Note: Gap-downs often bring panic selling at open but also provide reversal opportunities if major supports are respected.
🛡️ Risk Management Tips for Options Traders
🕒 Avoid impulsive trades in the first 15–30 minutes; let volatility settle.
🛑 Place stop losses based on 15-min/hourly closes rather than quick spikes.
📉 Prefer spreads (Bull Call / Bear Put) to reduce impact of premium decay.
🎯 Target a 1:2 Risk-Reward ratio minimum for all trades.
💰 Book partial profits at key resistance/support levels to lock gains.
🚫 Don’t risk more than 2–3% of your total capital on a single trade.
📌 Summary & Conclusion
Bullish Bias: Above 55,835, targets 56,050 → 56,200.
Neutral Zone: Between 55,407 – 55,835, expect consolidation and choppy action.
Bearish Bias: Below 55,178, weakness likely towards 55,031 – 54,900.
📊 Bank Nifty is positioned at a critical junction. A breakout above resistance could extend the ongoing bullish momentum, while a breakdown below support could trigger fresh selling. The best approach is to follow confirmation signals and manage trades with strict discipline.
⚠️ Disclaimer: This analysis is purely for educational purposes. I am not a SEBI-registered analyst. Please do your own research or consult with a financial advisor before making trading decisions.
BANKNIFTY : Trading levels and Plan for 03-Oct-2025BANK NIFTY TRADING PLAN – 03-Oct-2025
Bank Nifty closed at 55,386.65, recovering sharply after recent weakness. For tomorrow, key levels are defined between 55,406 (Opening Support/Resistance) and 55,560 (Last Intraday Resistance). The broader supports remain at 55,031 – 55,112 and 54,775.
📌 Key Levels to Watch:
Immediate Opening S/R: 55,406
Last Intraday Resistance: 55,560
Major Resistances Ahead: 55,835 → 56,062
Opening Support Zone: 55,031 – 55,112
Last Intraday Support: 54,775
🚀 Scenario 1: Gap Up Opening (200+ points)
If Bank Nifty opens above 55,600, it will directly test the Last Intraday Resistance .
A clean breakout above 55,560 – 55,600 may fuel momentum towards 55,835, and if sustained, even 56,062.
However, if prices fail to sustain above 55,560, expect intraday profit booking with pullback towards 55,400 – 55,200.
Traders must confirm the breakout with strong volumes before entering fresh longs.
👉 Educational Note: Gap-up openings near resistance often trap buyers. A patient approach is essential—wait for confirmation instead of chasing.
⚖️ Scenario 2: Flat Opening (within ±200 points)
A flat start near 55,300 – 55,400 will keep the index balanced between support and resistance zones.
Upside momentum will trigger only if 55,560 is crossed decisively, targeting 55,835 → 56,062.
On the downside, if 55,031 – 55,112 fails to hold, the index may retest 54,775.
Expect choppy price action until one side (above 55,560 or below 55,031) gives a decisive breakout.
👉 Educational Note: Flat openings usually reflect indecision. Traders should focus on breakouts from the intraday range to avoid false signals.
📉 Scenario 3: Gap Down Opening (200+ points)
If Bank Nifty opens near 55,100 – 55,000, it will test the Opening Support Zone (55,031 – 55,112) .
Breakdown below this zone can drag the index towards the Last Intraday Support at 54,775 .
If 54,775 also fails, deeper correction towards 54,500 levels cannot be ruled out.
However, strong rebound from support zones may lead to sharp short covering back towards 55,300 – 55,400.
👉 Educational Note: Gap-downs often create panic in the first 30 minutes. Smart traders wait for retests of support to avoid being trapped in false breakdowns.
🛡️ Risk Management Tips for Options Traders
⏳ Avoid aggressive positions in the first 15–30 minutes after opening.
🛑 Always keep stop losses based on candle close (15-min/hourly).
🎯 Use spreads (Bull Call / Bear Put) to reduce premium risk.
⚖️ Maintain a risk-reward ratio of at least 1:2 .
💰 Partial profit booking at key levels helps secure gains.
🧘 Stick to position sizing; never risk more than 2–3% of capital on a single trade.
📌 Summary & Conclusion
Bullish Bias: Above 55,560, targets 55,835 → 56,062.
Neutral Zone: Between 55,031 – 55,560, expect sideways action.
Bearish Bias: Below 55,031, expect weakness towards 54,775 → 54,500.
📊 Bank Nifty is entering a crucial zone where breakout above 55,560 may fuel strong upside momentum, while breakdown below 55,031 may bring back selling pressure. Traders should wait for confirmation and trade with discipline.
⚠️ Disclaimer: This trading plan is for educational purposes only. I am not a SEBI-registered analyst. Please do your own analysis or consult a financial advisor before making trading decisions.

BANKNIFTY : Trading levels and plan for 30-Sep-2025BANK NIFTY TRADING PLAN – 30-Sep-2025
Bank Nifty closed at 54,541.35, showing resilience after testing lower levels. The price is now positioned between crucial resistance and support zones. Traders should carefully track reactions near 54,692 (Opening Resistance) and 54,046 (Last Intraday Support) for intraday direction.
📌 Key Levels to Watch:
Last Intraday Resistance: 54,870
Opening Resistance: 54,692
Current Market Level (CMP): 54,541
Last Intraday Support: 54,046
🚀 Scenario 1: Gap Up Opening (200+ points)
If Bank Nifty opens near 54,750 – 54,800, it will be close to the Last Intraday Resistance at 54,870 .
A strong breakout above 54,870 can trigger momentum buying, targeting 55,100 → 55,393 levels.
However, if rejection happens around 54,870, profit booking may drag the index back to 54,692 – 54,500 levels.
Sustained hourly close above 54,870 is the key confirmation for bullish continuation.
👉 Educational Note: Gap-ups often test traders’ patience. Wait for consolidation above resistance before entering longs. Avoid chasing the first candle.
⚖️ Scenario 2: Flat Opening (within ±200 points)
A flat start near 54,400 – 54,550 will keep Bank Nifty in a neutral consolidation band.
Holding above 54,400 could give a push towards 54,692 → 54,870, where resistance strength will decide the day’s trend.
On the downside, breaking below 54,200 may pull the index towards the Last Intraday Support at 54,046 .
Sustained trade below 54,046 will invite aggressive selling.
👉 Educational Note: Flat openings usually create range-bound trades in the first half. Breakouts from this range often set up strong intraday moves.
📉 Scenario 3: Gap Down Opening (200+ points)
If Bank Nifty opens around 54,200 – 54,000, it will test the Last Intraday Support at 54,046 .
A clean breakdown below 54,046 could extend the fall towards 53,850 – 53,700 zones.
If 54,046 holds firm, a sharp rebound towards 54,400 – 54,692 is likely due to short covering.
Sustaining below 54,000 confirms bearish momentum, favoring put writers and sellers.
👉 Educational Note: Gap-downs often lead to panic selling. Avoid chasing the first drop—wait for a retest of support or confirmation breakdown before trading.
🛡️ Risk Management Tips for Options Traders
⏳ Avoid trading in the first 15–30 mins; let market direction settle.
🛑 Always keep stop losses on candle-close basis (15-min/hourly).
🎯 Use option spreads like Bull Call Spread / Bear Put Spread to control premium decay.
⚖️ Maintain a minimum 1:2 Risk-to-Reward ratio . Skip trades with poor setups.
💰 Book profits in parts—locking in gains reduces emotional stress.
🧘 Stay disciplined. Protecting capital is more important than catching every move.
📌 Summary & Conclusion
Bullish Bias: Above 54,870, targets 55,100 → 55,393.
Neutral Zone: Between 54,200 – 54,692, sideways consolidation likely.
Bearish Bias: Below 54,046, expect weakness towards 53,850 – 53,700.
📊 Bank Nifty is trading close to critical zones. The reaction around 54,692 (Opening Resistance) and 54,046 (Support) will define intraday trend. Patience and disciplined execution are key.
⚠️ Disclaimer: This trading plan is prepared for educational purposes only. I am not a SEBI-registered analyst. Please consult your financial advisor before making trading decisions.

BANKNIFTY : Trading levels and plan for 29-Sep-2025BANK NIFTY TRADING PLAN – 29-Sep-2025
Bank Nifty closed at 54,413.90, hovering just above the Last Intraday Support at 54,046 . The index has shown continued weakness, and market participants should closely track how price reacts near support and resistance zones for intraday direction.
📌 Key Levels to Watch:
Last Intraday Resistance: 55,393
Intermediate Resistance: 54,870
Opening Resistance: 54,692
Last Intraday Support: 54,046
🚀 Scenario 1: Gap Up Opening (200+ points)
If Bank Nifty opens around 54,600 – 54,700, it will directly test the Opening Resistance at 54,692 .
Sustaining above this level can push the index towards 54,870, and a breakout above that may extend towards 55,393.
A rejection at 54,692 – 54,870 may bring the index back to test 54,400 – 54,200 levels.
Strong bullish continuation will only be confirmed if the index closes above 54,870 on hourly basis.
👉 Educational Note: Gap-ups need validation. Wait for a 15-min candle confirmation above resistance before entering long trades, as failed gap-ups can trap buyers.
⚖️ Scenario 2: Flat Opening (within ±200 points)
A flat start near 54,350 – 54,450 will keep Bank Nifty in a neutral consolidation zone.
If prices hold above 54,400, upside attempts towards 54,692 → 54,870 may be possible.
On the downside, a break below 54,200 can bring the index towards the Last Intraday Support at 54,046 .
Sustained trading below 54,046 could invite sharp selling pressure.
👉 Educational Note: Flat openings are best observed patiently. The breakout of the initial range usually defines intraday direction.
📉 Scenario 3: Gap Down Opening (200+ points)
If Bank Nifty opens near 54,100 – 54,000, it will immediately test the Last Intraday Support at 54,046 .
A breakdown below 54,046 may extend the fall towards 53,850 – 53,700 zones.
If support holds at 54,046, a sharp bounce-back towards 54,400 – 54,692 is possible on short covering.
Any sustained trade below 54,000 will confirm bearish dominance.
👉 Educational Note: Gap-downs often create panic moves. Avoid chasing the first drop; instead, wait for retests of support before taking a position.
🛡️ Risk Management Tips for Options Traders
Avoid trading in the first 15–30 minutes to avoid traps.
Keep stop losses on closing basis of 15-min/hourly candles .
Use spread strategies like Bull Call Spread / Bear Put Spread to reduce premium risk.
Always maintain a 1:2 Risk-to-Reward ratio . Avoid trades where risk is wider than reward.
Book profits in parts instead of waiting for one big move.
Capital preservation is more important than chasing trades—stay disciplined.
📌 Summary & Conclusion
Bullish Bias: Above 54,692, targets 54,870 → 55,393.
Neutral Zone: Between 54,200 – 54,692, expect sideways consolidation.
Bearish Bias: Below 54,046, expect weakness towards 53,850 – 53,700.
📊 Bank Nifty is at a crucial support zone . Traders should watch 54,692 (Opening Resistance) and 54,046 (Intraday Support) as decisive levels for the day. A close beyond these zones will define trend direction.
⚠️ Disclaimer: This trading plan is for educational purposes only. I am not a SEBI-registered analyst. Please consult your financial advisor before making trading decisions.

BANKNIFTY : Trading levels and Plan for 26-Sep-2025BANK NIFTY TRADING PLAN – 26-Sep-2025
Bank Nifty closed at 54,950.95, hovering just around the Opening Support/Resistance Zone (54,935 – 54,971) . Tomorrow’s market is likely to revolve around this critical band.
📌 Key Levels to Watch:
Opening Support/Resistance Zone: 54,935 – 54,971
Opening Resistance: 55,167
Last Intraday Resistance: 55,368
Last Intraday Support: 54,698
Deeper Support: 54,545
🚀 Scenario 1: Gap Up Opening (200+ points)
A gap-up above 55,150–55,200 will immediately test the Opening Resistance at 55,167 .
Sustaining above this zone can extend the rally towards the last intraday resistance at 55,368 . A breakout above 55,368 could invite further bullish momentum.
However, if Bank Nifty fails to hold above 55,167, it may retrace back to the support zone around 54,971.
👉 Educational Note: Gap-ups often invite early profit booking. Always confirm sustainability above resistance levels before initiating aggressive long trades.
⚖️ Scenario 2: Flat Opening (within ±200 points)
A flat start near 54,900–55,000 means Bank Nifty will trade directly around the Opening Support/Resistance Zone (54,935 – 54,971) .
Holding above 54,971 will give buyers confidence to push towards 55,167 → 55,368.
A failure to sustain above this zone may drag the index down towards 54,698 and possibly 54,545.
👉 Educational Note: Flat openings provide clearer setups as price tests both support and resistance zones naturally, giving traders better confirmation of direction.
📉 Scenario 3: Gap Down Opening (200+ points)
A gap-down below 54,750 will put immediate pressure on Bank Nifty, exposing the Last Intraday Support at 54,698 .
Breaking this level may extend weakness towards 54,545, a strong support zone for buyers.
If buyers defend 54,698 – 54,545, short-covering may trigger a bounce back towards 54,935.
👉 Educational Note: Gap-downs often represent panic moves. It’s safer to wait for confirmation near strong supports before attempting reversal trades.
🛡️ Risk Management Tips for Options Traders
Always wait for 15–30 minutes after market open before entering positions to avoid false signals.
Use hourly candle close for stop-loss confirmation to prevent whipsaws.
Avoid naked options in high volatility; instead, use spreads (like Bull Call or Bear Put spreads) to limit premium decay.
Maintain a strict 1:2 risk-to-reward ratio . Never chase trades out of emotion.
Scale into trades gradually rather than going all-in at once.
📌 Summary & Conclusion
Bullish Scenario: Above 55,167, momentum may extend towards 55,368.
Neutral Zone: Between 54,935 – 54,971, expect consolidation before breakout.
Bearish Scenario: Below 54,698, weakness may deepen towards 54,545.
📊 The market is at a crucial support/resistance band. Traders should remain patient, allow the first 30 minutes to set direction, and then align trades accordingly.
⚠️ Disclaimer: This trading plan is for educational purposes only. I am not a SEBI-registered analyst. Please do your own research or consult a financial advisor before trading.

BANKNIFTY : Trading levels and Plan for 25-Sep-2025BANK NIFTY TRADING PLAN – 25-Sep-2025
Bank Nifty closed at 55,131.40, sitting close to the Opening Support/Resistance at 55,166 . Key levels for tomorrow’s trade:
Opening Support Zone: 54,969 – 55,038
Last Intraday Resistance: 55,495
Major Resistance: 55,686
Last Intraday Support: 54,689
Traders should prepare for all three possible opening scenarios.
🚀 Scenario 1: Gap Up Opening (200+ points)
A gap-up above 55,330+ will push Bank Nifty closer to the last intraday resistance at 55,495 .
Sustaining above this zone can create bullish momentum, targeting 55,686. Beyond this, the rally may extend further if short covering triggers.
However, if price fails to hold above 55,495, it may slide back towards 55,166, turning into a retest zone.
👉 Educational Note: Gap-ups often attract profit booking in the first half. Always confirm sustainability above resistance before entering aggressive longs.
⚖️ Scenario 2: Flat Opening (within ±200 points)
A flat opening near 55,100–55,160 means Bank Nifty will test the Opening Support/Resistance line (55,166) .
Holding above 55,166 could lift the index towards 55,330 → 55,495. A breakout here may extend to 55,686.
On the downside, slipping below 55,038 will weaken the index, pushing towards the last intraday support at 54,689 .
👉 Educational Note: Flat openings provide the best clarity as traders can align with intraday trend instead of reacting to overnight gaps.
📉 Scenario 3: Gap Down Opening (200+ points)
A gap-down below 54,930 will immediately pressure the market, testing the Opening Support Zone (54,969 – 55,038) .
If this zone breaks, expect a direct move towards the last intraday support at 54,689 . Sustaining below this level may trigger deeper downside momentum.
However, if 54,969–55,038 holds, we may witness a short-covering bounce back towards 55,166.
👉 Educational Note: Gap-downs are usually emotional reactions to global markets. Patience is key—avoid chasing shorts until support is broken decisively.
🛡️ Risk Management Tips for Options Traders
Use hourly close levels for stop-loss to avoid unnecessary whipsaws.
Avoid trading large lots on volatile gap openings; scale into trades slowly.
If using options, prefer spreads (like Bull Call Spreads / Bear Put Spreads) around resistance/support to minimize time decay.
Always plan trades with a 1:2 risk-to-reward ratio .
Protect profits by trailing stop-loss as Bank Nifty is highly volatile.
📌 Summary & Conclusion
Bullish Trigger: Above 55,495, momentum may extend towards 55,686.
Neutral Zone: Between 55,038 – 55,166, expect consolidation before breakout.
Bearish Trigger: Below 54,969, weakness may extend to 54,689.
📊 Traders should remain adaptive and let the opening settle for 15–30 minutes before taking positions. Bank Nifty’s volatility requires discipline, patience, and strong risk management.
⚠️ Disclaimer: This analysis is for educational purposes only. I am not a SEBI-registered analyst. Please do your own research or consult a financial advisor before trading.

BANKNIFTY : Trading levels and Plan for 24-Sep-2025BANK NIFTY TRADING PLAN – 24-Sep-2025
📌 Key Levels to Watch :
🟥 56,259 – Major Upside Resistance
🟥 55,801 – Last Intraday Resistance
🟧 55,495 – 55,688 – Opening Support / Resistance Zone (No Trade Zone)
🟩 55,365 – Last Intraday Support
🟩 55,266 – Important Intraday Support
🟩 54,969 – 55,038 – Buyer’s Support
🚀 Gap Up Opening (200+ points above previous close)
If Bank Nifty opens above 55,801, buyers will control momentum. A sustained move above this level could trigger a rally toward 56,259.
However, rejection near 55,801 can create a pullback toward 55,495 – 55,688 zone, which is the no-trade consolidation area.
Only if the index sustains above 55,801 with strong volume, traders may consider long positions targeting 56,259.
Educational Note: Gap-ups above resistance often look attractive but can also trap buyers if momentum fades. Always wait for a 15–30 minute confirmation candle before entering long trades.
📉 Flat Opening (within 100 points range)
In this scenario, the index will likely open inside the 55,495 – 55,688 zone, marked as a No Trade Zone .
If Bank Nifty sustains above this band, then upside levels 55,801 and later 56,259 come into play.
Failure to hold above this zone could drag prices back to 55,365 and 55,266 support levels.
Traders should avoid aggressive positions inside the zone and instead wait for a breakout or breakdown.
Educational Note: Flat openings inside a congestion zone are tricky. The best strategy is patience—allow the price to exit the zone before taking directional trades.
⚠️ Gap Down Opening (200+ points below previous close)
If Bank Nifty opens below 55,266, weakness will likely extend toward the Buyer’s Support zone at 54,969 – 55,038.
If this zone holds, buyers may attempt a recovery. Watch for intraday reversal patterns near this support to attempt small long trades.
If the zone breaks, expect further downside pressure. Resistance on the upside will now be 55,266 and 55,495 – 55,688 zone.
Educational Note: Gap downs can often lead to overreaction. Instead of chasing the fall, wait for the price to test key supports and observe whether buyers step in before planning trades.
💡 Risk Management Tips for Options Traders :
Do not take trades inside the No Trade Zone (55,495 – 55,688), as whipsaws are common there.
Use strict stop losses; never risk more than 2% of your capital on a single trade.
For directional plays, prefer ATM or slightly ITM options for better risk-reward.
Avoid averaging in losing trades; instead, cut losses quickly and re-enter only on confirmation.
On volatile days, consider using spreads (like bull call/bear put) to reduce premium decay risk.
✅ Summary & Conclusion :
A Gap Up above 55,801 may lead to a rally toward 56,259, but confirmation is key.
A Flat Opening inside 55,495 – 55,688 is a no-trade zone. Wait for breakout/breakdown.
A Gap Down below 55,266 could push prices to the Buyer’s Support zone (54,969 – 55,038).
Respect levels, avoid noise inside the no-trade zone, and focus on high-probability setups.
⚠️ Disclaimer : This analysis is for educational purposes only. I am not a SEBI-registered analyst . Please do your own research or consult with a financial advisor before making any trading decisions.

BANKNIFTY : Trading levels and plan for 23-Sep-2025BANK NIFTY TRADING PLAN – 23-Sep-2025
Levels to Watch:
🟥 55,784 – Major Upside Resistance
🟥 55,595 – Last Intraday Resistance
🟥 55,465 – Opening Resistance
🟧 55,261 – 55,311 – Flat Opening Zone (Support/Resistance)
🟩 55,102 – 55,152 – Opening & Last Intraday Support
🟩 54,862 – Major Downside Support
🚀 Gap Up Opening (200+ points above previous close)
If Bank Nifty opens above 55,465, buyers will have the initial advantage. The first hurdle to watch is 55,595. Sustaining above this level may attract further momentum toward 55,784.
However, if rejection comes near 55,595, we may witness profit booking, and the index could retest the 55,465 zone.
Traders should wait for a sustained candle close above 55,595 before attempting long positions with targets near 55,784.
Educational Note: A gap-up near resistance can often trap aggressive buyers. Always confirm with price action instead of jumping in immediately.
📉 Flat Opening (within 100 points range)
In this case, focus will be on the 55,261 – 55,311 zone, which will act as the deciding area.
Sustaining above this zone can trigger buying toward 55,465 and then 55,595.
Failure to hold here may drag the index down to 55,102 – 55,152 support. A break below this support zone could open the way for 54,862.
Educational Note: Flat openings provide the clearest opportunity for structured intraday trades because levels from the previous day remain valid. Patience during the first 15–30 minutes is key.
⚠️ Gap Down Opening (200+ points below previous close)
If Bank Nifty opens below 55,102, it will show weakness, and pressure may build toward 54,862.
Any attempt to recover will face resistance first at 55,102 – 55,152, and then at 55,261 – 55,311 if buyers push further.
A sustained move below 54,862 can lead to deeper selling, but oversold bounces may occur, so manage positions carefully.
Educational Note: Gap downs tend to induce panic trades. Avoid rushing into shorts at the open; instead, let the first 15 minutes establish whether weakness will sustain.
💡 Risk Management Tips for Options Traders :
Always define your stop loss; do not average out of fear.
Avoid selling naked options; prefer spreads to limit risk.
Position sizing should not exceed 2–3% of total capital per trade.
If trading intraday, trail your stop losses to protect gains.
On volatile days, use ATM/ITM options for directional trades instead of far OTM, which may decay quickly.
✅ Summary & Conclusion :
A Gap Up needs strong follow-through above 55,595 to aim for 55,784.
A Flat Opening near 55,261 – 55,311 will decide the trend for the day.
A Gap Down below 55,102 could invite selling pressure toward 54,862.
Patience in the opening 30 minutes and respecting key support/resistance levels will be crucial for capturing the best risk-reward opportunities.
⚠️ Disclaimer : This analysis is for educational purposes only. I am not a SEBI-registered analyst . Please do your own research or consult with a financial advisor before taking any trading decisions.

BANKNIFTY : Trading levels and Plan for 22-Sep-2025BANK NIFTY TRADING PLAN – 22-Sep-2025
The index is currently trading around 55,494, facing an immediate opening resistance zone at 55,512–55,608. On the downside, supports are placed at 55,402 (opening support), 55,225 (last intraday support), and a broader buyer’s support zone between 54,850–55,041.
Gap openings of 200+ points should be considered for tomorrow’s trade setup. Let’s break down the possible scenarios:
🚀 Gap Up Opening (200+ points above previous close)
If Bank Nifty opens with a strong gap-up above 55,700–55,730 (last intraday resistance), traders should avoid immediate chasing as the index might face profit-booking at higher zones.
Safer approach would be to wait for price action near 55,730. If the index sustains above this level on a 15-min/1-hour candle, fresh long positions can be initiated with targets towards 55,950–56,100.
However, if the gap-up opening fails to hold above 55,730 and rejection candles appear, it could trigger selling pressure. In that case, intraday shorts can be considered with a downside move towards 55,600–55,512.
Risk management: Traders must keep a strict SL of around 80–100 points in options as volatility is higher after gap openings. Avoid over-leveraging at higher zones.
⚖️ Flat Opening (near previous close levels)
In case of a flat opening near 55,450–55,500, the immediate focus will be on the opening resistance 55,512–55,608 and opening support 55,402.
A breakout above 55,608 with strong volume can trigger an upside rally towards 55,730. Sustaining above 55,730 may extend momentum towards 55,950.
On the other hand, if Bank Nifty rejects 55,512–55,608, it may retrace towards 55,402 and further down to 55,225.
This scenario gives traders flexibility: either side breakout trade can be captured with proper confirmation.
📉 Gap Down Opening (200+ points below previous close)
If Bank Nifty opens sharply below 55,225, it will shift intraday sentiment to bearish.
Immediate support will be tested near the buyer’s demand zone 54,850–55,041. If this zone holds, a technical pullback can be expected towards 55,225–55,402.
However, if the gap-down sustains below 54,850, then deeper correction is possible towards 54,600–54,450.
In such cases, option traders should prefer put side trades but must book profits quickly as rebounds from strong support zones are common.
🛡️ Risk Management & Option Trading Tips
Always wait for the first 15–30 minutes to let volatility settle before entering trades.
Use a strict stop-loss based on hourly candle close to avoid whipsaws.
In case of gap openings, avoid chasing. Instead, trade on confirmation and retest levels.
Stick to a fixed risk-reward ratio (minimum 1:2) to ensure consistency.
Avoid overtrading – 1–2 good trades are enough for the day.
📌 Summary & Conclusion
Above 55,730, momentum could extend towards 55,950–56,100 🚀.
Flat openings require focus on 55,512–55,608 (resistance) and 55,402 (support) ⚖️.
Below 55,225, weakness may drag prices towards 54,850–55,041 zone 📉.
Traders should align trades with price action near these levels, while keeping risk tight and avoiding emotional trades.
⚠️ Disclaimer
I am not a SEBI-registered analyst. The above analysis is for educational purposes only. Please consult your financial advisor before making any trading decisions.

BANKNIFTY : Trading levels and Plan for 19-Sep-2025BANK NIFTY TRADING PLAN – 19-Sep-2025
📌 Key Levels from the Chart:
No Trade Zone: 55,661 – 55,758
Last Intraday Resistance: 55,957
Major Resistance: 56,260
Last Intraday Support: 55,402 – 55,467
Critical Support: 54,850
🚀 Gap-Up Opening (200+ points above previous close)
If Bank Nifty opens around 55,900+, it will be near the Last Intraday Resistance (55,957) . A strong breakout above this zone may trigger bullish momentum towards 56,260, which is the higher resistance level.
📌 Trading Approach:
Go long only if candles sustain above 55,957 with volume.
First target: 56,150–56,200, extended target: 56,260.
Keep SL below 55,758 to protect capital.
Be cautious of false breakouts, as Bank Nifty often traps near resistance zones.
⚖️ Flat Opening (within ±200 points of 55,716)
A flat opening around 55,600–55,750 brings Bank Nifty inside the No Trade Zone (55,661–55,758) . This area is tricky and may cause choppy moves.
📌 Trading Approach:
Avoid aggressive trades inside this zone.
A breakout above 55,758 can lead to 55,957, giving a quick long opportunity.
A breakdown below 55,661 may push prices back to the support band at 55,402–55,467.
Patience is key—wait for price action confirmation before entering.
🔻 Gap-Down Opening (200+ points below previous close)
If Bank Nifty opens near or below 55,400, it immediately tests the Last Intraday Support zone (55,402–55,467) . A failure to hold this support may extend the fall towards the critical level of 54,850 .
📌 Trading Approach:
If 55,402–55,467 holds, expect a bounce back towards 55,600–55,700, which can be played on the long side.
If 54,850 breaks decisively, it could trigger further downside, opening a short trade opportunity with SL above 55,100.
Gap-downs are usually volatile, so manage position size carefully.
🛡️ Risk Management Tips for Options Traders
❌ Avoid trading inside the No Trade Zone ; wait for clean breakouts.
✅ Use spreads (Bull Call or Bear Put) to reduce premium decay.
📏 Position sizing: Risk only 2% of total capital per trade.
🔄 Trail stop-loss once your position moves in profit.
🕒 First 30 minutes are crucial; avoid over-trading during volatility.
📌 Summary & Conclusion
Above 55,957, momentum can extend towards 56,260.
A flat opening inside 55,661–55,758 requires patience and discipline.
Below 55,402, weakness may accelerate, testing 54,850 as a decisive level.
Stay disciplined, don’t chase the market blindly, and let levels guide your trades.
⚠️ Disclaimer
I am not a SEBI registered analyst . This trading plan is prepared purely for educational purposes. Please conduct your own analysis or consult with a financial advisor before making trading decisions.

BANKNIFTY : Trading levels and plan for 18-Sep-2025BANK NIFTY TRADING PLAN – 18-Sep-2025
📊 Levels from the chart:
Opening Resistance: 55,599
Last Intraday Resistance: 56,265
Opening Support Zone: 55,164 – 55,038
Last Intraday Support: 54,858
🚀 Gap-Up Opening (200+ points above previous close)
If Bank Nifty opens above 55,680–55,700, it indicates a continuation of bullish momentum. The immediate test would be at Opening Resistance (55,599). A sustained move above this level can fuel a rally towards 56,000–56,265 (Last Intraday Resistance).
📌 Trading Approach:
Intraday buyers can look for long entries above 55,700, targeting 56,100–56,265.
Stop-loss should be placed below 55,500 on a 15-min closing basis.
If Bank Nifty struggles near resistance and shows rejection candles, partial profit booking is wise, as resistance zones often attract profit-taking.
📉 Flat Opening (within ±200 points of 55,480)
A flat opening around the previous close would keep the index near the mid-zone of support and resistance. In such scenarios, market participants should avoid aggressive trades in the first 30 minutes and allow price action to settle.
📌 Trading Approach:
If the index sustains above 55,599, bullish momentum may continue towards 55,900–56,265.
If the index rejects resistance and falls below 55,300, expect a dip towards the Opening Support Zone (55,164–55,038).
Best strategy here: Wait for a breakout or breakdown from the consolidation range, then ride the trend with small risk defined by nearest support/resistance.
🔻 Gap-Down Opening (200+ points below previous close)
A gap-down below 55,280–55,250 would indicate short-term weakness. The index would then test the Opening Support Zone (55,164–55,038) . If this support holds, a sharp pullback rally is possible. However, if it breaks, prices may drift lower towards the Last Intraday Support at 54,858 .
📌 Trading Approach:
If Bank Nifty holds 55,038 and forms a reversal candle, intraday traders can play for a bounce back to 55,300–55,500.
If it breaks 55,038, fresh shorts can be considered with targets towards 54,858.
Stop-loss for shorts should be placed just above the broken support zone to manage risk effectively.
🛡️ Risk Management Tips for Options Traders
Never chase premiums after a gap opening; wait for retracement before entering.
Use spreads (Bull Call or Bear Put) to limit risk in volatile sessions.
Always define your maximum risk capital per trade (ideally not more than 2% of your account).
Avoid holding naked options near resistance/support without a hedge.
Scale out of profitable positions gradually instead of waiting for exact targets.
📌 Summary & Conclusion
Above 55,599, momentum may extend towards 56,265.
Flat opening requires patience; wait for breakout above 55,599 or breakdown below 55,300.
Below 55,038, weakness may deepen towards 54,858.
Discipline, patience, and respecting stop-loss levels will be the key for navigating tomorrow’s session.
⚠️ Disclaimer
I am not a SEBI registered analyst . This trading plan is purely for educational purposes. Traders should do their own research or consult a financial advisor before taking positions.

BANKNIFTY : Trading levels and Plan for 17-Sep-2025BANK NIFTY TRADING PLAN – 17-Sep-2025
📌 The market is currently trading near a consolidation range with clear supports and resistances. Tomorrow’s opening levels will play a crucial role in shaping intraday momentum. Gap openings beyond 200+ points can provide strong directional clues.
1. Gap-Up Opening (200+ Points Above 55,366) 🚀
If Bank Nifty opens strongly above the Opening Resistance (55,166–55,366 zone) and sustains, bullish momentum is likely to extend towards the Last Intraday Resistance at 55,599.
Wait for the first 15–30 minutes to let prices stabilize. Avoid chasing the first green candle.
A sustained move above 55,366 can act as confirmation for long trades.
Upside targets: 55,500–55,599 zone. Beyond this, a fresh breakout can lead to extended momentum.
Stop loss should be placed just below 55,166 on an hourly closing basis.
📌 Educational Note: Gap-up opens often attract profit booking. Always confirm strength with volume before entering longs.
2. Flat Opening (Near 55,166–55,200 Zone) ⚖️
If the market opens flat around the consolidation range, it will trade inside the No-Trade Zone initially.
Avoid immediate trades inside this range (55,100–55,200) to prevent whipsaws.
If the price sustains above 55,366, fresh longs can be taken targeting 55,500–55,599.
If the price breaks below 55,038, it may trigger selling pressure towards 54,858–54,811.
Stop loss should be maintained just outside the breakout zone to avoid false triggers.
📌 Educational Note: Flat openings are tricky. Patience is key – wait for either a breakout or breakdown to confirm direction.
3. Gap-Down Opening (200+ Points Below 54,950) 🔻
A sharp gap-down below the Opening Support (55,038) will shift sentiment to bearish.
If the index opens below 54,950 and sustains, selling pressure can push it towards the Last Intraday Support (54,811–54,858).
Further breakdown below this zone can extend the fall towards 54,550.
Any bounce back towards 55,038 should be watched carefully; if rejected, it may give another shorting opportunity.
Stop loss for shorts should be placed just above 55,166 on hourly close basis.
📌 Educational Note: Gap-downs often trap early shorters if not confirmed. Always wait for price stability before entering fresh shorts.
💡 Risk Management Tips for Options Traders
Avoid buying deep OTM options; prefer ATM or slightly ITM strikes for better risk-reward.
Time decay (Theta) works fastest in the last 2–3 days of expiry – keep position sizing small.
Follow strict stop losses; don’t average in loss-making options.
Use hedged strategies (Spreads) instead of naked calls/puts during volatile moves.
📌 Summary & Conclusion
Above 55,366 → Bullish momentum can extend towards 55,500–55,599.
Inside 55,100–55,200 → No-trade zone; wait for breakout confirmation.
Below 55,038 → Bearish momentum towards 54,858–54,811, with risk of extension to 54,550.
📌 Key Point: The first 30 minutes will be crucial tomorrow. Traders should align trades only after confirmation to capture the best risk-reward setups.
⚠️ Disclaimer: I am not a SEBI-registered analyst. This analysis is shared for educational purposes only. Please do your own research or consult your financial advisor before making trading decisions.

Nifty Index (Research for 16 Sep Expiry)NIFTY is running from supportive trendline. ..PCR has also come in favour of CE( ie indicating that CE buyers/ Put sellers are showing their strength. Coming expiry will probably closes in green
Nifty CMP-25114
expecting Targets- 1) 25220 ,
2) 25330 ,
3) 25420
Intraday Support- 25025, 25980
Major support (I think we won't need it in this expiry) - 24750

BANKNIFTY : Trading levels and Plan for 16-Sep-2025BANK NIFTY TRADING PLAN – 16-Sep-2025
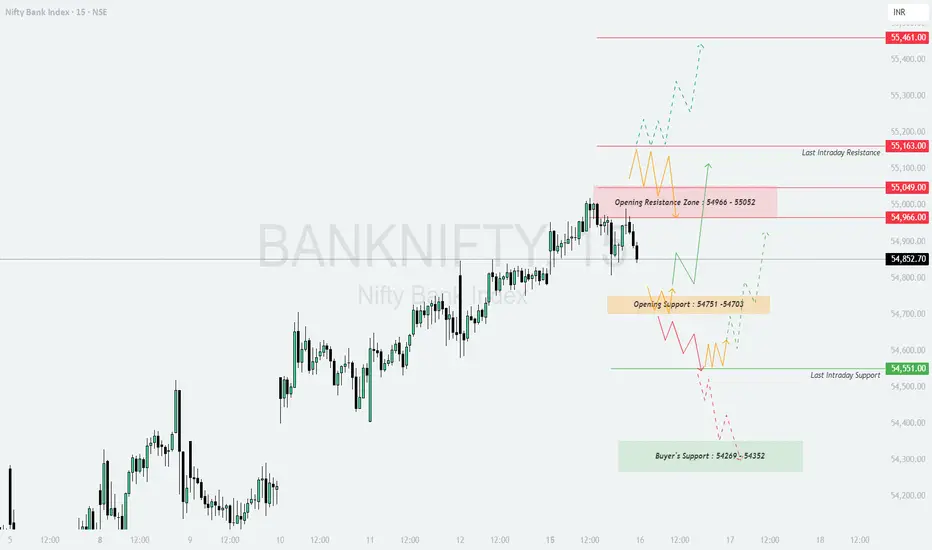
📊 Spot Price (Previous Close): 54,852
🔑 Key Levels from Chart:
Opening Resistance Zone: 54,966 – 55,052
Last Intraday Resistance: 55,163
Major Resistance: 55,461
Opening Support Zone: 54,751 – 54,703
Last Intraday Support: 54,551
Buyer’s Support Zone: 54,269 – 54,352
🔹 Scenario 1: Gap-Up Opening (200+ Points above 54,966)
If Bank Nifty opens with strength above 54,966, it directly tests the Opening Resistance Zone (54,966 – 55,052).
A strong breakout and hourly close above this zone may push prices toward 55,163, which is the last intraday resistance.
If bullish momentum continues, an extended move toward the 55,461 major resistance is possible.
On the flip side, rejection from 55,052 can cause a pullback toward 54,966, which then acts as support.
📌 Educational Note: Gap-ups near resistance zones often face selling pressure. Always wait for confirmation candles before entering long trades.
🚨 Risk Tip: Instead of buying naked calls at higher premiums, prefer Bull Call Spreads (Buy ATM call + Sell OTM call) to reduce risk.
🔹 Scenario 2: Flat Opening (Between 54,703 – 54,966)
A flat open in this range suggests indecision, where both buyers and sellers will try to dominate.
A breakout above 54,966 can trigger bullish momentum toward 55,052 → 55,163, and possibly higher levels.
On the downside, if price slips below 54,751 – 54,703 support zone, it may test the 54,551 last intraday support.
Sustained trading in this zone without breakout may lead to sideways price action.
📌 Educational Note: Flat opens usually trap impatient traders. Observing the first 30 minutes helps in identifying genuine breakouts or breakdowns.
🚨 Risk Tip: Trade with small position sizing in flat zones. Scale up only after clear directional breakout.
🔹 Scenario 3: Gap-Down Opening (200+ Points below 54,551)
A sharp gap-down below 54,551 will put immediate pressure on bulls.
If this level fails, prices may slide toward the Buyer’s Support Zone (54,269 – 54,352).
A breakdown below 54,269 can intensify selling and invite deeper corrections.
However, if Bank Nifty finds support near 54,352 – 54,269 and rebounds, a pullback rally toward 54,551 may occur.
📌 Educational Note: Gap-downs near strong supports often create volatile intraday moves. Avoid panic selling; wait for confirmation before shorting.
🚨 Risk Tip: Use Bear Put Spreads (Buy ATM put + Sell lower strike put) instead of naked put buying to hedge against sudden short-covering rallies.
📝 Summary & Conclusion
Bullish above: 54,966 → Targets: 55,052 / 55,163 / 55,461
Neutral Zone: 54,703 – 54,966 → Choppy range, wait for breakout.
Bearish below: 54,551 → Downside targets: 54,352 / 54,269
📌 The market is currently at a crucial resistance zone. A clean breakout above 54,966 – 55,052 can extend bullish momentum, while a breakdown below 54,551 may shift trend to bearish.
💡 Options Tip: For directional trades, prefer ATM/ITM options for higher delta. In uncertain zones, adopt spreads (Bull Call / Bear Put) instead of naked options to minimize theta decay.
⚠️ Disclaimer: I am not a SEBI-registered analyst. This plan is prepared purely for educational purposes. Please do your own research or consult a financial advisor before making trading decisions.
BANKNIFTY : Trading levels and plan for 12-Sep-2025BANK NIFTY TRADING PLAN – 12-Sep-2025
📊 Spot Price (Previous Close): 54,644
🔑 Key Levels:
Opening Resistance: 54,831
Last Intraday Resistance: 55,049
Major Resistance: 55,163
Opening Support: 54,550
Last Intraday Support: 54,386
Major Support: 54,157
🔹 Scenario 1: Gap-Up Opening (200+ Points above 54,831)
If Bank Nifty opens above 54,831, it will enter the bullish territory directly.
A sustained move above this resistance can trigger a rally toward 55,049, which is the last intraday resistance.
If momentum is strong, the index may further extend toward 55,163, but expect profit booking near this zone.
Any rejection near 55,049 – 55,163 can pull prices back toward 54,831, which then becomes the intraday support.
📌 Educational Note: Large gap-ups near resistance should be traded cautiously. Wait for confirmation candles before taking long entries.
🚨 Risk Tip: Avoid chasing calls blindly on gap-ups. Instead, consider spreads (Bull Call Spreads) to protect against sudden reversals.
🔹 Scenario 2: Flat Opening (Between 54,550 – 54,831)
A flat open within this zone signals a balanced start.
A breakout above 54,831 will open room for a bullish move toward 55,049 – 55,163.
On the downside, if Bank Nifty slips below 54,550, it will test the 54,386 support zone.
Price action within this range (54,550 – 54,831) may be choppy, so wait for a clear directional breakout.
📌 Educational Note: Flat openings often trap impatient traders. The first 30 minutes can provide clarity, so observe before acting.
🚨 Risk Tip: Use smaller positions when trading range-bound setups. Only scale up once breakout confirmation happens.
🔹 Scenario 3: Gap-Down Opening (200+ Points below 54,386)
If Bank Nifty opens below 54,386, it will put pressure on the market sentiment.
Breaking this support can extend the fall toward 54,157, which is a critical support zone.
If the index defends 54,386 and shows reversal signs, a pullback toward 54,550 may occur, creating a short-covering opportunity.
Below 54,157, the trend may turn strongly bearish, and deeper corrections are possible.
📌 Educational Note: Gap-downs near strong supports often create intraday volatility. Avoid panic trades and wait for confirmation candles.
🚨 Risk Tip: Instead of naked put buying, prefer Bear Put Spreads or hedge with futures to manage risk against rebounds.
📝 Summary & Conclusion
Bullish above: 54,831 → Targets: 55,049 / 55,163
Neutral Zone: 54,550 – 54,831 → Avoid overtrading here.
Bearish below: 54,386 → Next support: 54,157
📌 The index is currently in a critical consolidation phase. Watch for breakouts above 54,831 for bullish continuation and breakdowns below 54,386 for bearish moves.
💡 Options Tip: For directional trades, prefer ATM/ITM options. In choppy zones, use spreads instead of naked positions to control time decay.
⚠️ Disclaimer: I am not a SEBI-registered analyst. This plan is prepared purely for educational purposes. Please do your own research or consult a financial advisor before making trading decisions.

BANKNIFTY : Trading levels and plan for 11-Sep-2025BANK NIFTY TRADING PLAN – 11-Sep-2025
(Levels derived from support–resistance pivots and market psychology)
📈 Gap-Up Opening (200+ points above 54,732)
If Bank Nifty opens significantly above 54,732 (Last Intraday Resistance), the sentiment will turn strongly bullish.
Sustaining above this zone can drive momentum toward 54,955 (Major Resistance).
Intraday traders should watch for rejection near 54,955, as this is a psychological supply area.
Any pullback toward 54,732 – 54,643 may act as a retest zone for fresh long entries.
👉 Strategy: Avoid chasing the first candle. Enter long trades only if the price consolidates above 54,732 for 15–30 minutes. Targets: 54,955, with SL below 54,643. Short only if a clear rejection candle forms at 54,955.
📊 Flat Opening (Around 54,466 – 54,566 zone)
A flat open around the Opening Support/Resistance (54,466 – 54,566) indicates indecision.
If Bank Nifty sustains above 54,566, it may build momentum toward 54,732, and then toward 54,955.
If price fails to cross 54,566 and slips below 54,466, weakness may drag it toward 54,319 (Last Intraday Support).
This zone may see choppy moves; patience is key to avoid false entries.
👉 Strategy: Let the first 30 minutes settle. Go long only above 54,566 with targets 54,732 – 54,955. Consider shorts if it trades below 54,466, aiming for 54,319.
📉 Gap-Down Opening (200+ points below 54,266)
If Bank Nifty opens below 54,266, it signals weakness from the start.
Immediate cushion lies at 54,213; a breakdown here may extend to deeper supports near 54,000.
If buyers defend 54,213, a bounce toward 54,319 – 54,466 is possible, but strength must be confirmed.
Sustained trading below 54,213 may trigger panic selling.
👉 Strategy: Look for shorts below 54,213, targeting 54,000. Avoid aggressive longs unless a reversal candle appears near 54,213 with strong volume.
🛡️ Risk Management Tips for Options Traders
📊 Avoid taking trades in the first few minutes of volatile openings; let direction settle.
🛑 Always define a strict SL based on levels (prefer hourly candle close for major levels).
💰 Trail SL once trade moves in your favor to secure profits.
🚫 Avoid averaging in options; cut losing trades quickly and re-enter only on clear confirmation.
⚖️ Position sizing should be limited—don’t risk more than 1–2% of total capital in a single trade.
📌 Summary & Conclusion
✅ Above 54,732, Bank Nifty targets 54,955, bullish momentum intact.
🔄 Flat open near 54,466 – 54,566 requires patience; breakout/breakdown will define trend.
⚠️ Below 54,213, weakness can intensify toward 54,000.
🕰️ First 30 minutes of price action are critical—observe, then act.
⚠️ Disclaimer
I am not a SEBI-registered analyst . This trading plan is shared purely for educational purposes. Please do your own analysis or consult a financial advisor before taking trades.

BANKNIFTY : Trading levels and plan for 10-Sep-2025BANK NIFTY TRADING PLAN – 10-Sep-2025
(Levels derived from intraday chart zones, resistance/support pivots, and market psychology)
📈 Gap-Up Opening (200+ points above 54,428)
If Bank Nifty opens with a strong gap-up above 54,428, it directly enters a bullish momentum zone.
Sustaining above 54,424 (Last Intraday Resistance) may fuel a rally towards 54,637.
If momentum continues, the next psychological target will be 55,025.
However, rejection near 54,637 could bring a pullback toward 54,424 – 54,300 support band.
👉 Strategy: Avoid chasing the first candle. If price sustains above 54,424 for 30 minutes, long positions can be initiated with a target of 54,637 – 55,025. If rejection occurs, look for a short scalp back to 54,300.
📊 Flat Opening (Around 54,200 – 54,300 zone)
A flat opening near the Opening Resistance/Support (54,300) zone indicates indecision.
If Bank Nifty sustains above 54,300, upside potential is open towards 54,424, and later 54,637.
If it struggles below 54,300, expect weakness toward 54,012 (Opening Support Zone).
Consolidation in this zone may trap both sides initially; hence patience is essential.
👉 Strategy: Let the index stabilize for the first 30 minutes. Enter long only above 54,300 with confirmation, or short below 54,228 if weakness is visible.
📉 Gap-Down Opening (200+ points below 54,028)
If Bank Nifty opens below 54,028, the bias turns negative.
The first downside cushion lies in the Opening Support zone (53,970 – 54,012).
If this breaks, price can extend weakness toward 53,765 – 53,809 (Last Intraday Support).
Sustained breakdown below 53,765 may lead to deeper correction zones near 53,600 levels.
👉 Strategy: Short on breakdowns below 54,012, with profit booking near 53,765 – 53,809 zone. Watch for reversal candles around this support area for potential intraday bounces.
🛡️ Risk Management Tips for Options Traders
⚖️ Always size positions based on capital—avoid over-leveraging during gap openings.
⏳ Wait for confirmation candles (15–30 minutes) before entering trades, especially on gap-ups/downs.
🛑 Use hourly candle close for stop-loss placement to avoid premature exits.
💰 Trail stop-loss to lock profits once the index moves in your favor.
📉 Never average out losing trades in options; instead, cut losses quickly and look for fresh setups.
📌 Summary & Conclusion
✅ Above 54,424, Bank Nifty can rally toward 54,637 – 55,025.
⚠️ Below 54,012, weakness can extend to 53,765 – 53,809.
🔄 A flat start around 54,300 demands patience; breakout/breakdown from this zone will guide direction.
🎯 The first 30 minutes of price action will be critical in defining the trend.
⚠️ Disclaimer
I am not a SEBI-registered analyst . This trading plan is shared for educational purposes only. Please consult your financial advisor or do your own analysis before making any trades.

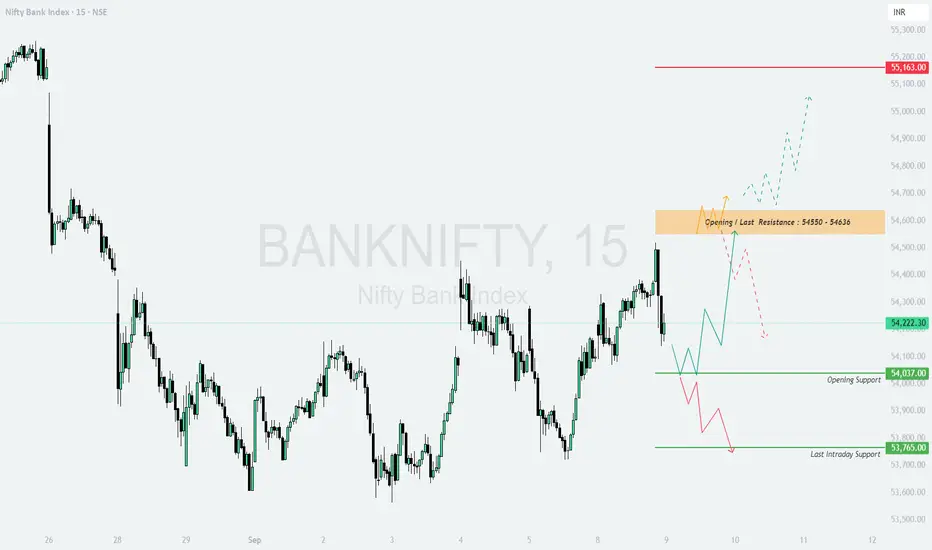
BANKNIFTY: Trading levels and Plan for 09-Sep-2025BANK NIFTY TRADING PLAN – 09-Sep-2025
📌 Key Levels to Watch :
Major Resistance Zone: 54,550 – 54,636
Upside Extension Resistance: 55,163
Opening Support: 54,037
Last Intraday Support: 53,765
The index is now trading near a decision-making point. Price behavior around the resistance zone and support levels will set the tone for the next move.
🔼 1. Gap-Up Opening (200+ points above 54,636)
If Bank Nifty opens above 54,636, it will open doors for bullish continuation.
📌 Plan of Action :
Sustaining above 54,636 can lead to a strong rally towards 55,163.
If momentum continues, the index may even attempt new highs beyond 55,200+.
Watch for early profit booking near 55,163, as this level could act as a supply zone.
👉 Educational Note: Gap-ups above resistance zones often trap late sellers. But fresh longs should be added only if the price sustains for 15–30 mins above resistance.
➖ 2. Flat Opening (Around 54,200 – 54,300)
A flat start gives traders an opportunity to observe early market sentiment.
📌 Plan of Action :
If Bank Nifty sustains above 54,300, expect a test of the 54,550 – 54,636 resistance zone.
A clean breakout above 54,636 can extend the move towards 55,163.
On the downside, a failure to hold 54,037 (opening support) may drag prices towards 53,765.
👉 Educational Note: Flat openings are ideal for option sellers in the first hour. Buyers should wait for confirmation of breakout/breakdown before initiating trades.
🔽 3. Gap-Down Opening (200+ points below 54,000)
If the index opens sharply lower, bearish momentum may dominate.
📌 Plan of Action :
Immediate support lies at 53,765 (last intraday support).
A breakdown below 53,765 can accelerate selling, targeting 53,500 – 53,400 levels.
However, if Bank Nifty takes support at 53,765 and rebounds strongly, expect a short-covering rally back towards 54,037.
👉 Educational Note: Gap-downs create panic, but seasoned traders wait for a reversal signal near strong support zones to capture short-covering rallies.
🛡️ Risk Management Tips for Options Traders
Always trade with a pre-defined stop-loss on hourly closing basis .
Keep position sizing under control — risk only 1–2% of total capital per trade .
On volatile days, prefer option spreads (bull call spread, bear put spread) over naked options to manage time decay.
Avoid chasing gap-ups or gap-downs blindly; wait for confirmation candles.
Scale out profits near resistance zones like 54,636 and trail stop-losses on remaining positions.
📌 Summary & Conclusion
🟢 Above 54,636 → Bullish trend continuation towards 55,163+ .
🟧 Flat Opening → Range-bound play; above 54,300 bullish, below 54,037 weak .
🔴 Below 54,000 → Bearish momentum, testing 53,765 and possibly lower .
⚠️ Critical Zone: 54,550 – 54,636 (Major Resistance). A clear breakout here will define the bullish trend continuation.
⚠️ Disclaimer: I am not a SEBI-registered analyst. This analysis is purely for educational purposes and should not be considered as financial advice. Please consult your financial advisor before making trading decisions.
BANKNIFTY : Trading levels and Plan for 08-Sep-2025b]BANK NIFTY TRADING PLAN – 08-Sep-2025
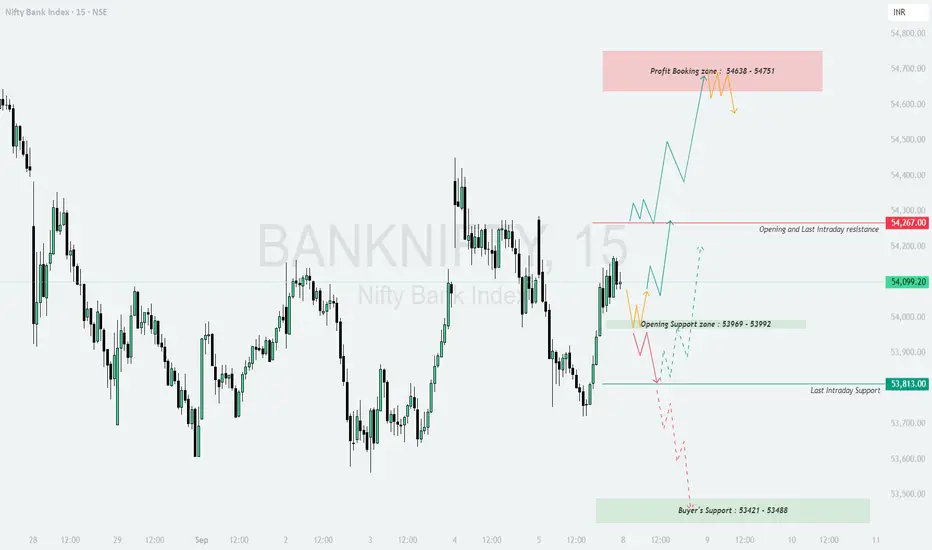
📌 Key Levels to Watch :
Profit Booking Zone: 54,638 – 54,751
Opening & Last Intraday Resistance: 54,267
Opening Support Zone: 53,969 – 53,992
Last Intraday Support: 53,813
Buyer’s Support (Strong Zone): 53,421 – 53,488
The market has entered a sensitive phase where traders need to closely monitor reactions around support and resistance levels.
🔼 1. Gap-Up Opening (200+ points above 54,267)
If Bank Nifty opens with a strong gap-up above 54,267, it directly challenges the resistance zone.
📌 Plan of Action :
Sustaining above 54,267 will invite momentum buying, pushing towards the profit booking zone 54,638 – 54,751.
Traders should be cautious here, as this zone is ideal for partial profit booking or scaling out of longs.
A breakout and sustained move above 54,751 can open room for further upside, but momentum may slow down.
👉 Educational Note: Gap-ups near resistance often face selling pressure. Wait for confirmation candles before chasing a long trade.
➖ 2. Flat Opening (Around 54,000 – 54,150)
A flat opening indicates a balanced market start, offering opportunities both ways.
📌 Plan of Action :
Sustaining above 54,099 – 54,150 will keep the momentum bullish, targeting 54,267.
If price breaks above 54,267, the move can extend towards the profit booking zone.
On the downside, failure to sustain above 54,000 may drag prices to test the opening support zone 53,969 – 53,992.
👉 Educational Note: Flat openings provide the best chance to evaluate market sentiment in the first 30 minutes. Avoid rushing into trades and let price action guide your entries.
🔽 3. Gap-Down Opening (200+ points below 53,900)
A weak opening below 53,900 will bring sellers into control.
📌 Plan of Action :
Initial support lies at 53,813 (last intraday support). A breakdown below this level can drag Bank Nifty towards the buyer’s support zone 53,421 – 53,488.
Expect strong buying attempts from this buyer’s zone. If the rebound holds, it can trigger a sharp pullback rally.
Sustaining below 53,421 will turn the market sentiment bearish, opening deeper downside targets.
👉 Educational Note: Gap-downs often cause emotional selling. Smart traders wait for a retest of supports before entering trades.
🛡️ Risk Management Tips for Options Traders
Always maintain a stop-loss on hourly closing basis to avoid being trapped in intraday volatility.
Avoid aggressive lot sizes on volatile gap-up/gap-down days. Keep risk per trade at 1–2% of capital .
Use option spreads (like bull call spreads or bear put spreads) near resistance/support to manage premium decay.
Never hold out-of-the-money options overnight unless backed by strong conviction.
Book partial profits at key zones like support/resistance and let the rest ride with a trailing stop.
📌 Summary & Conclusion
🟢 Above 54,267 → Bullish bias with targets at 54,638 – 54,751 (profit booking zone) .
🟧 Flat Opening → Watch 54,000 – 54,150 range; above bullish, below weak .
🔴 Below 53,900 → Weakness towards 53,813 & further to 53,421 – 53,488 (buyer’s support zone) .
⚠️ Critical Zone: 54,638 – 54,751 (Profit Booking Zone). Booking profits here is wise before chasing further upside.
⚠️ Disclaimer: I am not a SEBI-registered analyst. This analysis is for educational purposes only and should not be taken as financial advice. Please consult your financial advisor before trading.