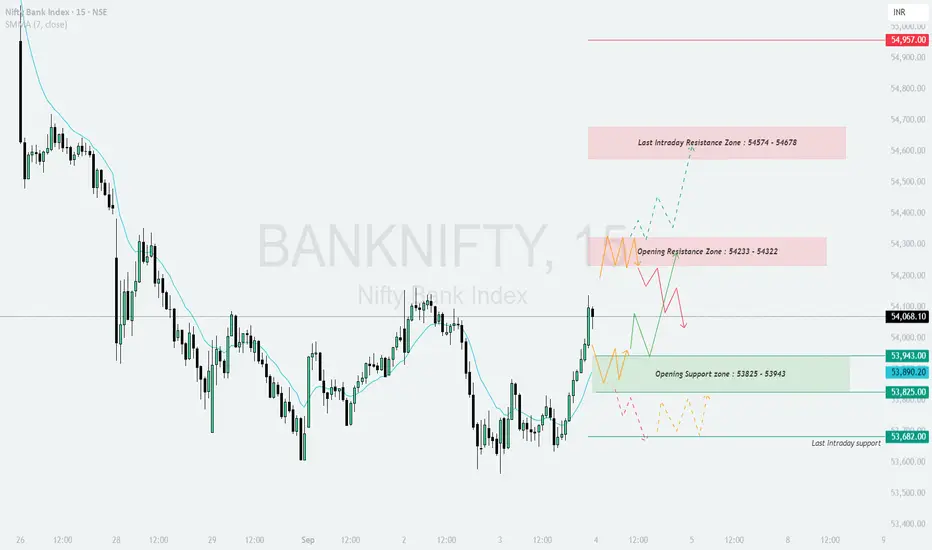
BANKNIFTY : Trading levels and Plan for 04-Sep-2025BANK NIFTY TRADING PLAN – 04-Sep-2025
📌 Key Levels to Watch :
Opening Resistance Zone: 54,233 – 54,322
Last Intraday Resistance Zone: 54,574 – 54,678
Major Resistance: 54,957
Opening Support Zone: 53,825 – 53,943
Last Intraday Support: 53,682
These levels will define intraday trend strength and reversals. Let’s analyze scenarios:
🔼 1. Gap-Up Opening (200+ points above 54,233)
If Bank Nifty opens significantly higher above 54,233, it will enter the resistance zone and buyers will aim to test 54,574 – 54,678.
📌 Plan of Action :
Sustaining above 54,322 can lead to a quick rally towards 54,574 – 54,678.
Booking profits near this zone is advised, as sellers may step in.
If momentum extends, the next target will be 54,957, but only if 54,678 breaks with strength.
👉 Educational Note: Gap-ups near resistance zones can often trap late buyers. Always wait for confirmation before entering fresh longs.
➖ 2. Flat Opening (Around 53,900 – 54,100)
A flat start near current levels indicates balance. Intraday movement will depend on whether support or resistance breaks first.
📌 Plan of Action :
Holding above 53,943 (Opening Support) can push price towards 54,233 – 54,322 (Resistance Zone).
A breakout above this zone may open the path to 54,574 – 54,678.
If price slips below 53,825, weakness can extend towards 53,682.
👉 Educational Note: Flat openings often provide the cleanest intraday trends once the first 30 minutes establish direction.
🔽 3. Gap-Down Opening (200+ points below 53,825)
If Bank Nifty opens weak below 53,825, sellers will take control, with supports coming into play.
📌 Plan of Action :
A gap-down below 53,825 increases probability of a slide towards 53,682 (Last Intraday Support).
If 53,682 breaks, the downside can intensify with sharp selling.
Any bounce from this zone should be treated cautiously unless price regains 53,825 – 53,943.
👉 Educational Note: Gap-downs can trigger panic selling, but experienced traders should watch for reversal patterns near strong supports.
🛡️ Risk Management Tips for Options Traders
Always place stop losses based on hourly close.
Limit risk to 1–2% of trading capital per position.
Scale out profits – exit part at first target, hold balance for extended moves.
Avoid over-leveraging in weekly expiry days to reduce volatility risk.
When uncertainty is high, prefer spreads (Bull Call / Bear Put) over naked options.
📌 Summary & Conclusion
🟢 Above 54,233 → Upside towards 54,574 – 54,678, extended 54,957 .
🟧 Flat Opening → Range-bound between 53,825 – 54,322; breakout will decide direction .
🔴 Below 53,825 → Weakness towards 53,682 and possibly lower .
⚠️ Key Pivot Zone: 53,825 – 53,943 will act as the critical battleground for bulls and bears.
⚠️ Disclaimer: I am not a SEBI-registered analyst. This trading plan is for educational purposes only and should not be treated as financial advice. Please consult your financial advisor before making trading decisions.
Bankniftyanalysis
BANKNIFTY : Trading levels and Plan for 03-Sep-2025BANK NIFTY TRADING PLAN – 03-Sep-2025
📌 Key Levels to Watch :
Opening Resistance: 53,868
Last Intraday Resistance: 54,037
Major Resistance Zone: 54,233 – 54,319
Opening Support Zone: 53,454 – 53,537
Last Intraday Support: 53,204
These zones will act as turning points where price reactions are expected. Let’s break it down scenario-wise.
🔼 1. Gap-Up Opening (200+ points above 54,037)
If Bank Nifty opens sharply higher above 54,037, momentum could continue towards the Resistance Zone 54,233 – 54,319.
📌 Plan of Action :
Sustaining above 54,037 can invite bullish momentum, targeting 54,233 – 54,319.
Profit booking may occur at the upper band of resistance (54,319), so be cautious near this zone.
If price fails to sustain and falls back below 54,037, weakness may drag it toward 53,868 again.
👉 Educational Note: In strong gap-ups, waiting for a pullback to support before entering is safer than chasing highs.
➖ 2. Flat Opening (Around 53,627 – 53,775)
A flat start near current levels signals indecision; market participants will watch for breakout from support/resistance.
📌 Plan of Action :
Sustaining above 53,775 could push price towards 53,868 → 54,037.
If unable to hold above 53,627, expect a retest of the Opening Support Zone (53,454 – 53,537).
Avoid over-trading inside this choppy band; wait for clean breakouts or breakdowns.
👉 Educational Note: Flat openings usually lead to sideways action early in the session; patience helps filter false signals.
🔽 3. Gap-Down Opening (200+ points below 53,454)
If Bank Nifty opens weak below the Opening Support Zone, sellers may dominate.
📌 Plan of Action :
A gap-down below 53,454 could test 53,204 (Last Intraday Support).
If 53,204 holds, a relief bounce towards 53,454 – 53,537 may occur.
A breakdown below 53,204 would intensify selling pressure, potentially opening the way for deeper downside.
👉 Educational Note: In gap-down situations, avoid aggressive longs unless strong reversal signals appear.
🛡️ Risk Management Tips for Options Traders
Stick to a strict stop loss on hourly close to avoid deep drawdowns.
Risk only 1–2% of capital per trade.
Book partial profits at nearby resistance/support to secure gains.
Avoid chasing trades in the middle of the zone; best trades occur at breakouts or bounces from key levels.
Use option spreads (Bull Call or Bear Put) to hedge against volatility and theta decay.
📌 Summary & Conclusion
🟢 Above 54,037 → Upside targets 54,233 – 54,319 .
🟧 Flat Opening → Watch 53,775 / 53,868 for upside, 53,454 zone for downside .
🔴 Below 53,454 → Weakness towards 53,204; breakdown may extend bearish move .
⚠️ Key Battle Zone: 53,454 – 53,537 (Opening Support Zone).
⚠️ Disclaimer: I am not a SEBI-registered analyst. This analysis is purely for educational purposes and should not be considered investment advice. Please consult your financial advisor before trading.

Bank nifty Futures- Consolidation ankNifty Futures (Index) daily
Technical analysis + sector (banking industry) fundamental overview + a learning summary for students.
Technical Analysis (Daily Chart) Candlestick & Chart Pattern👉
Recent candles show selling pressure after the peak near 57,800 (upper trendline rejection).
Current candles look like lower highs + lower lows = possible descending channel formation.
The long wicks at support zones indicate buyers are defending near 52,800- 53,000.
Swing Analysis
Major swing high: 57,850
Swing low: 47,750
Retracement happening between 0.382 (53,992) and 0.236 (55,466) Fibonacci levels.
Pattern in Progress
Falling Wedge / Descending Channel forming- often bullish if breakout happens above resistance trendline.
👉If price breaks below 52,800, then deeper correction possible.
Key Levels
-Support
52,800 - 53,000 (critical Fib support)
50,400 - 50,500 (strong demand zone)
48,500 (swing support)
-Resistance
55,000 - 55,500 (Fib cluster + recent rejection)
57,800 (swing high, big breakout point)
60,000 psychological level
Entry Points-
For Long (Investors/Positional)
-Enter near 52,800- 53,000 with SL below 52,500.
Add more if it breaks and sustains above 55,500.
-For Short (Traders):
Below 52,800, short with target 50,400 - 48,500.
Keep SL near 53,600.
Industry Analysis (Banking Sector)
Indian banks are in a strong credit growth cycle (loan demand high, NPA ratios declining).
-RBI’s monetary policy easing in future may improve margins further.
-PSU Banks are gaining strength, but private banks (HDFC, ICICI, Kotak) still dominate.
-Key Fundamental Ratios (Peer Banks)
-ICICI Bank: RoE - 16%, NIM - 4.5%, GNPA <2%
-HDFC Bank: RoE - 15%, NIM - 4.1%, GNPA - 1.5%
-SBI: RoE - 14%, NIM - 3.6%, GNPA - 2.5%
👉 Overall, sector health is positive, but valuation of large banks is already at premium.
-Student Learnings
1. Chart Patterns:
Descending channel/falling wedge = watch for breakouts.
2. Candlestick Wicks:
Long lower shadows = hidden buying.
3. Swing + Fibonacci:
Key tool to identify retracement zones.
4. Support & Resistance:
Always mark levels - entry becomes safer.
5. Fundamentals in Sector Indices:
Index = basket - study sector & top-weight banks, not single balance sheet.
⚠️ Disclaimer
This analysis is for educational purposes only. It is not financial advice. Trading in derivatives (like BankNifty Futures) is highly risky and may lead to capital loss. Please consult your financial advisor before investing.
Follow👣 for more🚩
#BankNifty #StockMarketIndia #TechnicalAnalysis #CandlestickPatterns #SwingTrading #SupportAndResistance #InvestingBasics #BankingSector #StockMarketEducation #FinanceStudents #MarketAnalysis
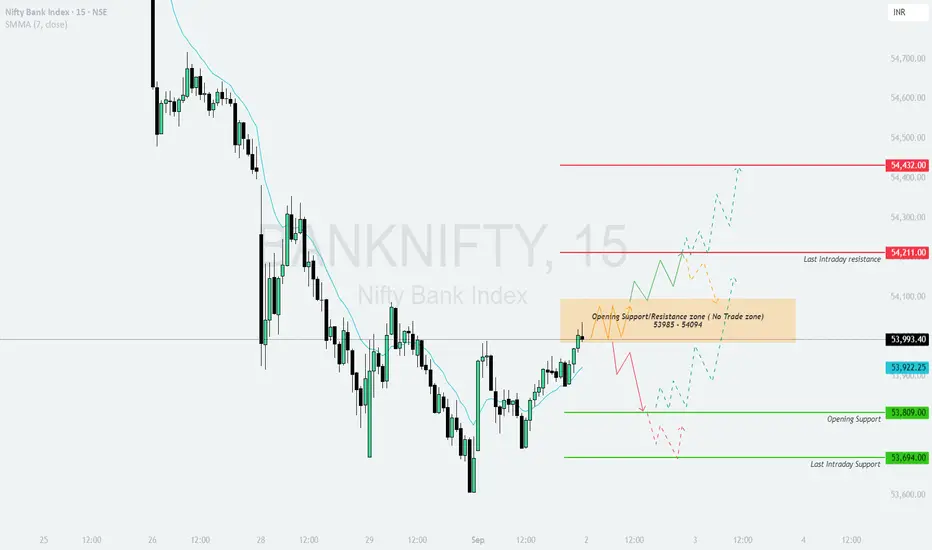
BANKNIFTY : Trading levels and plan for 02-Sep-2025BANK NIFTY TRADING PLAN – 02-Sep-2025
📌 Key Levels to Watch :
No Trade Zone (Opening Support/Resistance): 53,985 – 54,094
Last Intraday Resistance: 54,211
Major Resistance Above: 54,432
Opening Support: 53,809
Last Intraday Support: 53,694
These levels act as reaction points where traders should expect volatility and directional cues.
🔼 1. Gap-Up Opening (200+ points above 54,094)
If Bank Nifty opens significantly above the No Trade Zone, bulls may attempt to take control.
📌 Plan of Action :
Sustaining above 54,211 (last intraday resistance) can trigger further momentum.
The next upside target will be 54,432, where profit booking pressure could arise.
If price fails to sustain above 54,094 and slips back into the No Trade Zone, expect consolidation and choppy action.
👉 Educational Note: Gap-up openings often result in high option premiums. Instead of chasing, wait for a retest of support or consolidation before entering directional trades.
➖ 2. Flat Opening (Around 53,950 – 54,050)
If the market opens flat within the No Trade Zone (53,985 – 54,094), traders must exercise patience.
📌 Plan of Action :
Avoid trading immediately in the No Trade Zone as false signals are common.
A breakout above 54,094 with strong volume may lead to a move towards 54,211 – 54,432.
A breakdown below 53,985 will shift focus towards 53,809 (opening support).
👉 Educational Note: Flat openings are best approached with discipline. Let the market give clear confirmation before committing to a direction.
🔽 3. Gap-Down Opening (200+ points below 53,809)
If Bank Nifty opens lower, it will test key supports quickly.
📌 Plan of Action :
A gap-down below 53,809 directly exposes the market to test 53,694 (last intraday support).
Buyers may attempt a pullback from 53,694, making it a possible intraday reversal zone.
A decisive break below 53,694 will weaken sentiment further and can accelerate downside momentum.
👉 Educational Note: Gap-downs create panic moves. Avoid chasing shorts at lows; instead, look for pullbacks to resistance zones to enter with better risk/reward.
🛡️ Risk Management Tips for Options Traders
Always trade with a defined stop loss based on hourly close.
Risk only 1–2% of capital per trade.
Use option spreads (like Bull Call or Bear Put) instead of naked buying in volatile markets.
Scale out of trades at important resistance/support zones.
Avoid trading within the No Trade Zone (53,985 – 54,094) where whipsaws are likely.
📌 Summary & Conclusion
🟢 Above 54,211 → Upside momentum towards 54,432 possible .
🟧 Flat Opening → Avoid trades in 53,985 – 54,094 (No Trade Zone), wait for breakout/breakdown .
🔴 Below 53,809 → Weakness towards 53,694; below that, expect further downside .
⚠️ Key Battle Zone: 53,985 – 54,094 (No Trade Zone).
⚠️ Disclaimer: I am not a SEBI-registered analyst. This analysis is shared purely for educational purposes and should not be considered as investment advice. Please consult your financial advisor before trading.
BANKNIFTY : Trading levels and plan for 01-Sep-2025💼 BANK NIFTY TRADING PLAN – 01-Sep-2025
📌 Key Levels to Watch :
Opening Resistance Zone: 53,844
Last Intraday Resistance: 53,982
Sideways Resistance Zone: 54,142 – 54,214
Opening Support: 53,466
Buyer’s Zone for Reversal: 53,204 – 53,466
Last Intraday Support: 53,204
These levels will serve as reaction zones where market participants are likely to show strong activity.
🔼 1. Gap-Up Opening (200+ points above 53,844)
If Bank Nifty opens with a significant gap-up above 53,844, bullish traders will have the upper hand.
📌 Plan of Action :
Sustaining above 53,982 (last intraday resistance) can lead to a quick rally.
Upside targets will be 54,142 – 54,214 (sideways resistance zone) where profit booking pressure may arise.
Failure to hold above 53,844 can invite a retracement back toward 53,692 (current reference).
👉 Educational Note: Gap-up moves often look attractive, but chasing high premiums in options can be risky. Waiting for a retest of support levels gives safer entry points.
➖ 2. Flat Opening (Around 53,650 – 53,750)
If the index opens flat near its current zone, price behavior around 53,844 (opening resistance) will decide the trend.
📌 Plan of Action :
Sustaining above 53,844 can take Bank Nifty towards 53,982 and eventually 54,142 – 54,214.
If rejected from 53,844, price could slip back toward 53,466 (opening support).
A break below 53,466 will drag the index into the Buyer’s Zone (53,204 – 53,466), where intraday reversal attempts may happen.
👉 Educational Note: Flat openings provide balanced opportunities—traders should observe first 30 minutes to gauge real strength before taking directional trades.
🔽 3. Gap-Down Opening (200+ points below 53,466)
If Bank Nifty opens sharply lower, it will directly test the Buyer’s Reversal Zone (53,204 – 53,466).
📌 Plan of Action :
Aggressive buyers may defend 53,204 – 53,466, making this zone a potential reversal area.
If 53,204 holds, a recovery towards 53,466 and 53,692 is possible.
A decisive breakdown below 53,204 (last intraday support) can accelerate selling pressure and lead to extended downside.
👉 Educational Note: Gap-downs bring panic—avoid shorting at extreme lows; instead, watch for retracements to enter with better risk/reward.
🛡️ Risk Management Tips for Options Traders
Use hourly close-based stop losses instead of small tick-based stops.
Risk only 1–2% of trading capital per trade.
In volatile moves, prefer option spreads (Debit/Credit spreads) over naked buying.
Scale out profits at key zones like resistance or support—don’t wait for exact tops/bottoms.
Avoid overtrading during sideways phases; wait for clear breakouts/breakdowns.
📌 Summary & Conclusion
🟢 Above 53,982 → Upside momentum towards 54,142 – 54,214 .
🟧 Flat Opening → Watch 53,844 as pivot; above bullish, below cautious .
🔴 Below 53,466 → Weakness towards Buyer’s Reversal Zone (53,204 – 53,466) .
⚠️ Critical battle zones: 53,844 (resistance) & 53,466 (support).
⚠️ Disclaimer: I am not a SEBI-registered analyst. This analysis is shared only for educational purposes and should not be considered investment advice. Please consult your financial advisor before trading.

BANKNIFTY : Trading levels and Plan for 29-Aug-2025💼 BANK NIFTY TRADING PLAN – 29-Aug-2025
📌 Key Levels to Watch :
Opening Resistance Zone: 54,076 – 54,184
Last Intraday Resistance: 54,246
Major Resistance Above: 54,511
Opening Support Zone: 53,669 – 53,767
Last Intraday Support: 53,460
Major Support Below: 53,204
These levels represent intraday turning points where buyers or sellers may step in aggressively.
🔼 1. Gap-Up Opening (200+ points above 54,184)
If Bank Nifty opens with a strong gap above 54,184, bullish momentum is likely.
📌 Plan of Action :
Sustaining above 54,246 (last intraday resistance) may fuel upside towards 54,511, which is the next hurdle for bulls.
Partial profit booking is advisable near 54,511, as it could trigger a pullback.
If the index fails to sustain above 54,246, it may slip back into the 54,076–54,184 resistance band, indicating possible rangebound price action.
👉 Educational Note: On big gap-ups, avoid chasing the first 15 minutes. Wait for a retest of support before entering long trades.
➖ 2. Flat Opening (Around 53,669 – 53,767 Support Zone)
If Bank Nifty opens flat within the opening support band, the market will look for fresh direction.
📌 Plan of Action :
Holding above 53,767 can invite buying, targeting 54,076 → 54,246.
Failure to hold above 53,669 may push the index back towards 53,460, opening the door for more weakness.
Traders should avoid over-leveraging in this consolidation zone, as false breakouts are common.
👉 Educational Note: Flat openings usually demand patience. Allow price to test both sides of support/resistance before committing to a trade.
🔽 3. Gap-Down Opening (200+ points below 53,460)
If Bank Nifty opens with a sharp gap below 53,460, bearish control will likely continue.
📌 Plan of Action :
Below 53,460, the index can slide further towards 53,204 (major support).
The 53,204 zone is critical; strong buying wicks here may signal a reversal opportunity.
If 53,204 breaks decisively, expect extended downside momentum, so shorts can be trailed aggressively.
👉 Educational Note: Gap-down openings often trigger panic. Avoid emotional trades—stick to levels and wait for clear breakdown confirmations.
🛡️ Risk Management Tips for Options Traders
Risk only 1–2% of trading capital per trade.
Use hourly candle close stop-losses for confirmation instead of reacting to noise.
On high-volatility days, prefer spreads (Bull Call/Bear Put) over naked options.
Book profits in tranches, don’t wait for exact targets.
Keep an eye on India VIX to gauge premium decay and volatility risk.
📌 Summary & Conclusion
🟢 Above 54,246 → Upside towards 54,511 (profit booking zone) .
🟧 Flat near 53,669–53,767 → Wait for breakout, either to 54,246 or 53,460 .
🔴 Below 53,460 → Weakness towards 53,204 (critical support) .
🎯 The battle zone: 53,669–53,767 opening support will decide intraday momentum.
⚠️ Disclaimer: I am not a SEBI-registered analyst. This trading plan is prepared purely for educational purposes and should not be treated as investment advice. Please do your own research or consult a financial advisor before trading.

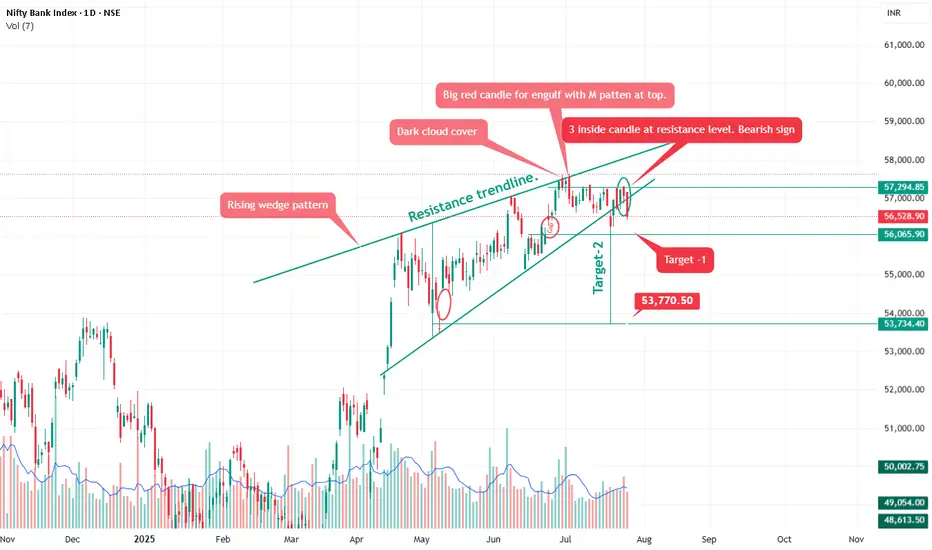
Bank nifty Rising wedge pattern.Pattern Analysis
Rising Wedge Pattern:
A bearish pattern typically seen near tops. It shows narrowing price movement with higher highs but declining momentum.
Breakdown confirmed as price has fallen below the lower wedge support trendline.
Confirms selling pressure and rejection from the top near 57,300–57,500 zone.
🕯️ Candlestick Signals
Dark Cloud Cover:
A bearish reversal pattern indicating sellers have taken control after a bullish phase.
Big Red Candle + ‘M’ Pattern:
Bearish engulfing at resistance – strong indication of a top formation.
3 Inside Down Candlestick Pattern at Resistance:
Recent red candles have higher volume, confirming institutional selling activity.
As anticipated in our previous analysis, Bank Nifty corrected from the 57,000 level to 56,056, validating the bearish setup.
It is also expected to short here 56,550 add on any rise up to 57,700-57,950 for target mentioned on chart.
Alternative Scenario: Be aware that the rising wedge could potentially break upwards. If the price breaks decisively above the resistance trendline with strong volume, the bearish outlook would be invalidated.
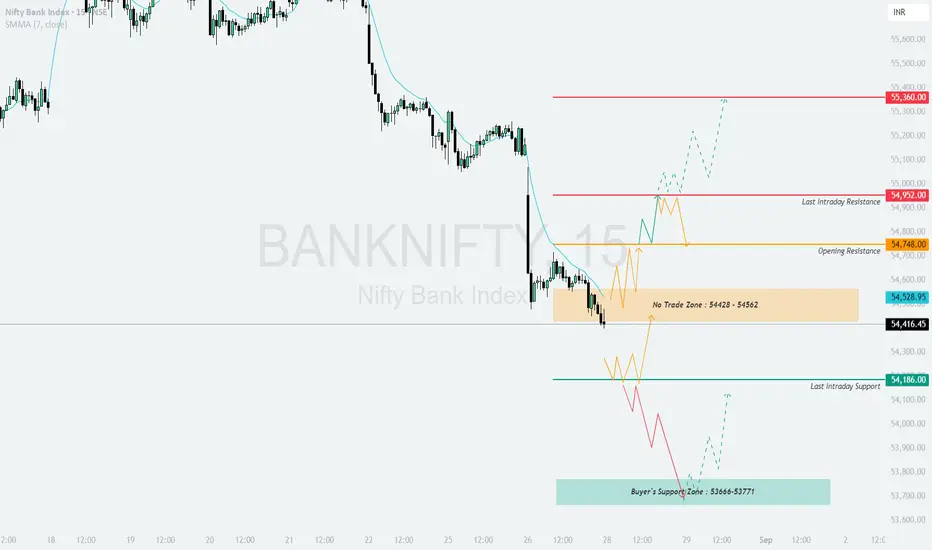
BANKNIFTY : Trading levels and Plan for 28-Aug-2025💼 BANK NIFTY TRADING PLAN – 28-Aug-2025
📌 Key Levels to Watch :
Opening Resistance: 54,748
Last Intraday Resistance: 54,952
Major Resistance Above: 55,360
No-Trade Zone: 54,428 – 54,562
Last Intraday Support: 54,186
Buyer’s Support Zone: 53,666 – 53,771
These levels act as decision-making zones for intraday setups.
🔼 1. Gap-Up Opening (200+ points above 54,748)
If Bank Nifty opens above 54,748, early strength will be visible.
📌 Plan of Action :
Sustaining above 54,952 (Last Intraday Resistance) can push the index towards 55,360, which will act as a major resistance and profit booking zone.
Failure to hold above 54,952 may drag prices back to retest 54,748 support, giving rangebound moves.
A breakout above 55,360 should be traded cautiously with partial booking at higher levels.
👉 Educational Note: On strong gap-ups, always avoid chasing; instead, wait for price retests near support to manage risk better.
➖ 2. Flat Opening (Around 54,428 – 54,562 No-Trade Zone)
A flat start near the No-Trade Zone means price is indecisive.
📌 Plan of Action :
If Bank Nifty sustains above 54,748, buyers may take it towards 54,952 → 55,360.
If it slips below 54,428, selling pressure may drag it down to 54,186 support.
Avoid aggressive trading inside the no-trade band (54,428 – 54,562), as it can trigger false breakouts.
👉 Educational Note: Flat openings require patience. Allow 30 minutes for trend clarity before entering trades.
🔽 3. Gap-Down Opening (200+ points below 54,186)
If Bank Nifty opens below 54,186, bearish momentum will dominate.
📌 Plan of Action :
Below 54,186, price can slide quickly towards 53,666 – 53,771 Buyer’s Zone.
Watch carefully for reversals in the buyer’s zone; if sustained, a recovery bounce can emerge.
If the buyer’s zone breaks with volume, deeper weakness may continue.
👉 Educational Note: On gap-down days, trend-following trades work better than reversal attempts. Wait for retests before shorting.
🛡️ Risk Management Tips for Options Traders
Risk only 1–2% of capital per trade.
Use hourly close stop-loss for directional moves.
Prefer spreads (Bull Call / Bear Put) on gap days to minimize premium decay.
Do not trade aggressively in the No-Trade Zone (54,428 – 54,562).
Monitor Bank Nifty PCR & India VIX to gauge sentiment and volatility.
📌 Summary & Conclusion
🟢 Above 54,952 → Possible upside to 55,360 .
🟧 Flat near 54,428–54,562 → Avoid trades until breakout .
🔴 Below 54,186 → Downside towards 53,666–53,771 .
🎯 Key Decision Zone: 54,428 – 54,562 (No-Trade Zone) will guide the trend.
⚠️ Disclaimer: I am not a SEBI-registered analyst. This trading plan is purely for educational purposes and should not be considered financial advice. Please consult a financial advisor before making trading or investment decisions.
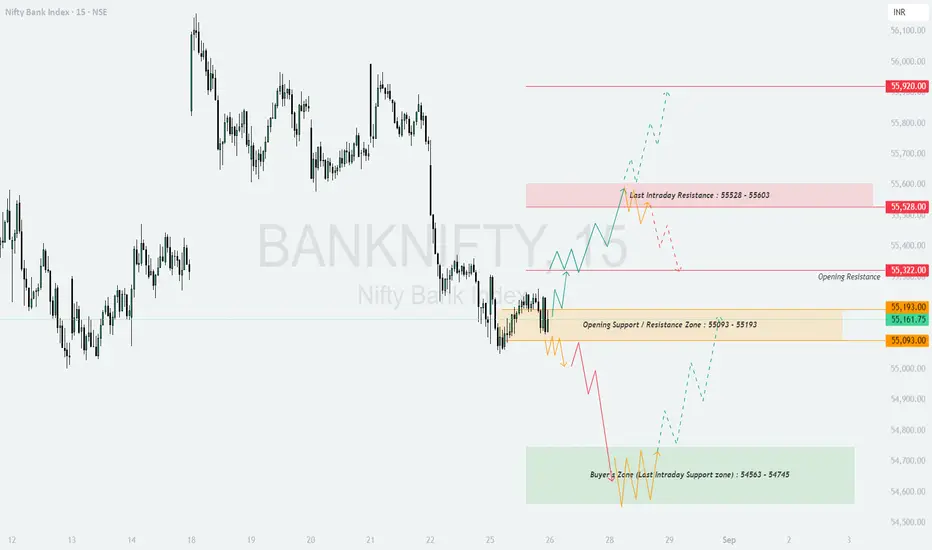
BANKNIFTY : Trading levels and plan for 26-Aug-2025📊 BANK NIFTY TRADING PLAN – 26-Aug-2025
The price action on 25-Aug-2025 has defined critical levels for the next trading session. The Opening Support/Resistance Zone is 55,093 – 55,193, with key upside resistances at 55,322 and 55,528–55,603, while the strong downside support remains in the 54,563 – 54,745 Buyer’s Zone.
Let’s analyze the trading plan for all opening scenarios.
🔼 1. Gap-Up Opening (200+ Points Above 55,322)
If Bank Nifty opens above 55,322, it enters the bullish territory, testing the “Opening Resistance” directly.
📌 Plan of Action:
Watch if the price sustains above 55,322 for 15–30 minutes. Sustaining here will attract buying momentum.
Next target would be the Last Intraday Resistance zone 55,528–55,603.
If momentum continues and buyers hold above 55,603, extension towards 55,920 is possible.
If the index fails to hold above 55,322, then profit booking may pull it back toward 55,193 – 55,093 zone for retesting.
Risk note: Do not chase calls aggressively after a big gap-up 🚫. Always prefer entering on dips toward support for safer risk–reward.
➖ 2. Flat Opening (Around 55,093–55,193)
A flat opening around the Opening Support/Resistance Zone will be a balanced case where the market decides the next trend based on initial strength.
📌 Plan of Action:
If price sustains above 55,193, it can gradually move higher towards 55,322 → 55,528–55,603.
Failure to hold above 55,093 will invite selling pressure and drag the index towards the Buyer’s Zone (54,745–54,563).
First 30 minutes are crucial — let the market structure develop before entering trades to avoid false breakouts.
Risk note: Use hedged option strategies like Bull Call Spreads or Iron Condors if volatility is high. This helps reduce premium decay risk.
🔽 3. Gap-Down Opening (200+ Points Below 54,950)
A sharp gap-down below 55,000 would put pressure on bulls and may activate the Buyer’s Zone.
📌 Plan of Action:
If Bank Nifty opens below 55,000 and fails to reclaim 55,093, then the downside target becomes 54,745 – 54,563.
A bounce from the Buyer’s Zone can give scalping opportunities on the long side, but only with strict stop-loss.
If even 54,563 breaks, expect further downside expansion. Option writers may benefit from selling Calls.
Risk note: After a gap-down, avoid panic entries 🚦. Wait for retests of broken levels before confirming trend direction.
🛡️ Risk Management Tips for Options Traders
Never risk more than 1–2% of capital on a single trade.
Avoid trading immediately in the first 5 minutes after open; let volatility cool down.
Always maintain stop-losses in both futures and options.
Prefer spreads (Bull Call / Bear Put) over naked positions to control risk.
Remember: Protecting capital is more important than chasing every move. 💡
📌 Summary & Conclusion
🟢 Above 55,322 → 55,528–55,603 → 55,920 possible.
🟧 Flat near 55,093–55,193 = decision zone, wait for breakout/breakdown.
🔴 Below 55,093 → 54,745–54,563 Buyer’s Zone will be tested.
Key pivot: 55,093–55,193 zone.
⚠️ Disclaimer: I am not a SEBI-registered analyst. This analysis is purely for educational purposes and should not be considered financial advice. Please consult a financial advisor before making trading/investment decisions.
BANKNIFTY : Trading levels for 25-Aug-2025BANK NIFTY TRADING PLAN – 25-Aug-2025
📊 The market is at a decisive zone where price action around the 55,168 support–resistance pivot will guide the day’s direction. With clear intraday resistance at 55,528–55,687 and strong support around 54,563–54,745, let’s break down the trading plan for all three possible opening scenarios.
🔼 1. Gap-Up Opening (200+ Points Above 55,528)
If Bank Nifty opens above 55,528, it directly enters the “Opening Resistance Zone.” Such gaps often trigger profit booking in the early minutes, as traders who carried long positions may book profits.
📌 Plan of Action:
Wait for the first 15–30 minutes to see whether price sustains above 55,528.
If sustained, expect a rally towards the Last Intraday Resistance 55,687 and further into the target zone of 55,954–56,061.
However, if the index fails to sustain and slips back below 55,528, a quick retracement toward 55,168 may occur.
Risk note: Do not chase aggressive calls after a sharp gap-up. Instead, wait for pullbacks to key levels for a favorable risk–reward entry.
➖ 2. Flat Opening (Around 55,150–55,250)
A flat start around 55,168 will be the most balanced case, where both bulls and bears will have opportunities depending on who gains control first.
📌 Plan of Action:
If Bank Nifty sustains above 55,168 with strong buying, expect an upward move toward 55,528. A breakout above this resistance can open the way to 55,687 and eventually 55,954–56,061.
On the contrary, if price fails to hold 55,168 and slips below, selling pressure may drag it toward 54,745–54,563 (Last Intraday Support Zone).
Traders should closely monitor the first 30 minutes’ structure to avoid false breakouts.
Risk note: Options traders can use spreads (Bull Call Spread / Bear Put Spread) instead of naked buying to reduce theta decay and premium risk.
🔽 3. Gap-Down Opening (200+ Points Below 54,950)
A sharp gap-down below 55,000 may lead to panic selling, especially if global cues are weak.
📌 Plan of Action:
If the index opens below 55,000 and fails to reclaim 55,168, expect selling to intensify toward the 54,745–54,563 support zone.
If the support zone holds, intraday pullbacks are possible — traders may look for quick scalps on the long side but with strict stop-losses.
A breakdown below 54,563 will open deeper downside levels, creating opportunities for option writers on the short side.
Risk note: After a gap-down, avoid panic selling at open. Allow the index to retest broken levels — failed retests often provide high-probability trades.
📌 Risk Management Tips for Options Traders
Always trade with a defined stop-loss — never average into a losing trade.
Avoid trading in the first 5 minutes after a big gap; let volatility settle.
Position sizing is key — never risk more than 1–2% of total capital on a single trade.
Use hedged strategies like spreads instead of naked positions when IV (implied volatility) is high.
Remember, missing a trade is better than forcing a wrong trade. Patience pays.
📊 Summary & Conclusion
🟢 Sustaining above 55,528 opens doors to 55,687 → 55,954–56,061.
🟧 Flat opening near 55,168 makes it a decision zone for either breakout or breakdown.
🔴 Below 55,168, weakness may drag Bank Nifty toward 54,745–54,563.
Key pivot for the day: 55,168.
⚠️ Disclaimer: I am not a SEBI-registered analyst. The above analysis is for educational purposes only. Please do your own research or consult a financial advisor before making any trading decisions.

Bank Nifty spot 55,149.40 by Daily Chart view - Weekly updateBank Nifty spot 55,149.40 by the Daily Chart view - Weekly update
- Rising Support Channel broken down from supportive role
- Next fairly decent Support Zone 54160 to 54660 for Bank Nifty Index
- Upwards going Resistance Zone 59550 to 56385 for Bank Nifty Index
- Next Strong Resistance Zone 56850 to 57250 and then ATH Level 57628.40
- Acting Support Zone 55050 to 55450 for Bank Nifty Index, will it be a Resistance Zone again
- Bank Nifty Index formed Bearish Rounding Top, somehow seen sustaining closure above the Support Zone for past 3 weeks, indicates consolidation, hope for an upward trajectory

BANKNIFTY : Trading plan and levels for 22-Aug-2025📌 BankNifty Trading Plan for 22-Aug-2025
Key Levels from Chart:
Opening Resistance → 55,849
Opening Support Zone → 55,622 – 55,697
Last Intraday Resistance Zone → 56,097 – 56,135
Last Intraday Support Zone → 55,334 – 55,395
Downside Target Support → 55,174
Previous Close → 55,733.90
🚀 Scenario 1: Gap Up Opening (200+ points above previous close)
If BankNifty opens around 55,950+, buyers will dominate the initial sentiment.
The first major hurdle is Opening Resistance at 55,849. If sustained above, momentum can quickly test 56,097 – 56,135 (Last Intraday Resistance Zone).
A clean breakout above 56,135 can push the index toward 56,355 (Profit Booking Zone).
However, failure near resistance could cause intraday profit booking, dragging it back toward the 55,849 retest zone.
💡 Plan of Action : Go long only above 55,849 with confirmation. Trail stop-loss below 55,697. Book partial profits near 56,135 and tighten stops beyond that. Avoid chasing if price struggles near resistance.
📊 Scenario 2: Flat Opening (within ±100 points of 55,734)
Flat openings often lead to sideways choppiness around support and resistance zones.
If price sustains above 55,849, bullish momentum may extend toward 56,097 – 56,135.
Failure to break 55,849 and slipping below 55,622 – 55,697 (Opening Support Zone) will invite weakness.
Breakdown below 55,622 can accelerate selling toward 55,334 – 55,395 (Last Intraday Support Zone).
💡 Plan of Action : Avoid trading inside 55,622 – 55,849 chop zone. Wait for breakout: long above 55,849 or short below 55,622 for clear momentum trades.
⚠️ Scenario 3: Gap Down Opening (200+ points below previous close)
If BankNifty opens near 55,500 or below, bearish sentiment will dominate.
Immediate cushion lies at 55,334 – 55,395 (Last Intraday Support Zone). Breakdown below this zone can drag the index toward 55,174 strong support.
If 55,334 holds, expect a relief bounce back toward 55,622 zone.
Be cautious of false breakdowns, as gap-downs often lead to short-covering rallies.
💡 Plan of Action : Go short only if 55,334 breaks with volume, keeping SL above 55,395. For long scalps, wait for bullish reversal patterns near 55,334 before targeting 55,622.
📌 Risk Management Tips for Options Traders 💡
Use hedged strategies like spreads or straddles in high volatility instead of naked buying.
Place strict stop-losses on option premiums – don’t average losing positions.
Respect the 2% rule → risk only 2% of total capital per trade.
Avoid overtrading inside congestion zones; wait for directional clarity.
Trail your profits and book partials near resistance/support zones 🎯.
📝 Summary & Conclusion
Above 55,849, targets are 56,097 – 56,135, then 56,355 🚀.
Between 55,622 – 55,849, sideways choppiness likely ⚖️ – avoid trades.
Below 55,622, weakness toward 55,334 – 55,395, and if broken → 55,174 ⚠️.
👉 The day will be trend-driven outside the support/resistance zones. Discipline and patience are key to avoid false moves.
⚠️ Disclaimer
I am not a SEBI registered analyst. This trading plan is shared purely for educational purposes . Please consult with your financial advisor before making trading or investment decisions.

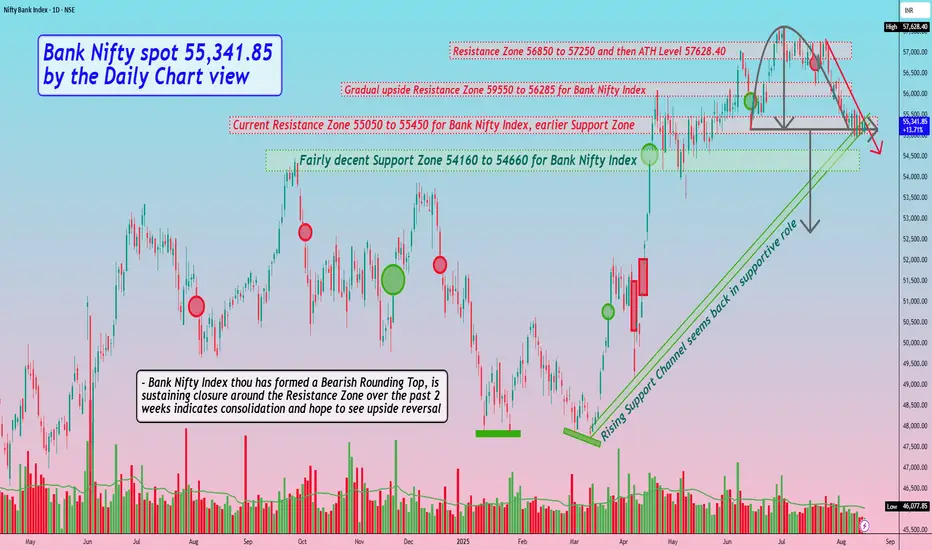
Bank Nifty spot 55,341.85 by the Daily Chart view - Weekly updatBank Nifty spot 55,341.85 by the Daily Chart view - Weekly update
- Fairly decent Support Zone 54160 to 54660 for Bank Nifty Index
- Current Resistance Zone 55050 to 55450 for Bank Nifty Index, earlier Support Zone
- Falling Resistance Trendline is yet a hurdle to cross over along with the current Resistance Zone
- Rising Support Channel seems back in supportive role and gives indicative feeling of probable upside reversal, so hope for the best to happen
- Bank Nifty Index thou has formed a Bearish Rounding Top, is sustaining closure around the Resistance Zone over the past 2 weeks indicates consolidation and hope to see upside reversal
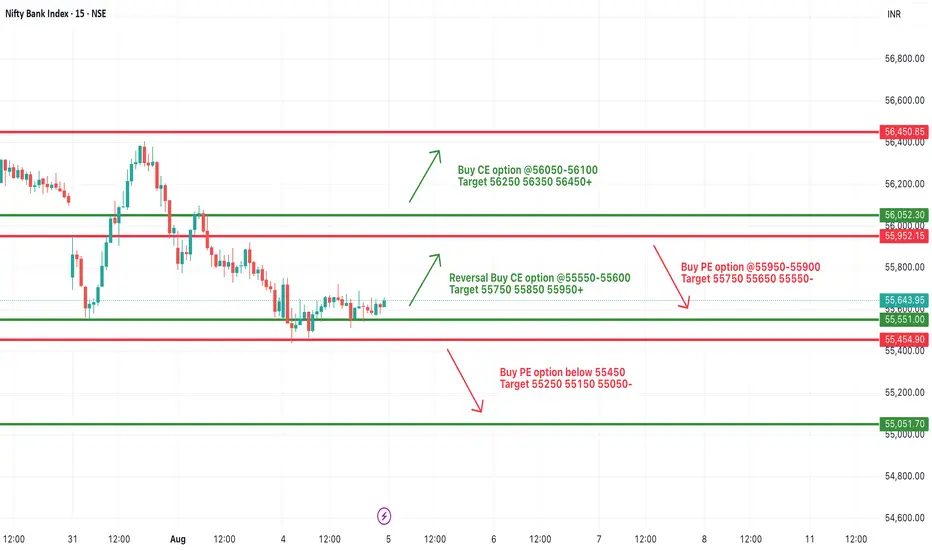
[INTRADAY] #BANKNIFTY PE & CE Levels(05/08/2025)A flat opening is expected in Bank Nifty near the 55,600 level, reflecting a neutral start after previous sessions of consolidation. The market is currently trading within a narrow range, and a breakout from this range will decide the direction for today’s move.
On the upside, if Bank Nifty sustains above the 55,950–56,000 resistance zone, a bullish breakout may lead to an intraday rally toward 56,250, 56,350, and 56,450+ levels. Sustained strength above 56,100 will add confirmation to the trend.
However, if Bank Nifty faces resistance near 55,950 and slips below 55,550–55,500, it may trigger a downward move toward 55,250, 55,150, and 55,050- levels. Further weakness below 55,450 would reinforce bearish sentiment.
The 55500–56,000 range is acting as a crucial consolidation zone. Traders are advised to wait for a clear breakout or breakdown from this zone for directional trades.
Learn Institutional Trading🏛️ Learn Institutional Trading
Step into the world of smart money and learn how the big players trade!
Institutional Trading isn’t about following indicators—it’s about understanding market structure, liquidity, and smart money moves.
🔍 What You’ll Learn:
Market Structure – Trends, ranges, and liquidity zones
Smart Money Concepts – Accumulation , distribution , and manipulation traps
Volume & Order Flow – See what the institutions see
Precision Entries – No guessing, just calculated moves
Risk Management – Trade like a pro, protect your capital
💡 Why It Matters:
Retail traders often get trapped 🚧 by institutional strategies. When you learn how institutions think and operate, you stop reacting and start predicting market behavior.
🚀 Final Thought:
Think like a pro. Trade like an institution. 🏛️ Win with structure.
Learn Institutional Trading and transform the way you see the market—forever

Learn Advanced Institutional Trading🎓 Learn Advanced Institutional Trading
Advanced Institutional Trading is the high-level skill of trading financial markets the way professional institutions do — using big data, smart tools, and strategic decision-making to consistently win in the market. 💼📊
Learning this means going beyond basic charts or trendlines. It’s about understanding how big money moves, and how to:
🧠 Read institutional order flow
📉 Trade with algorithms and dark pools
📈 Use volume, liquidity zones & smart money indicators
🛡️ Apply institutional-level risk management
⚙️ Trade options, futures, and other derivatives at scale
💬 Interpret economic data like banks and funds do
You’ll learn to:
Identify entry and exit points based on institutional footprints
Use macro and micro market analysis
Build a trading system with logic and consistency
React to live news, earnings, and global events the way hedge funds do
📌 In simple words:
Learning Advanced Institutional Trading gives you the mindset, tools, and strategies used by the top 1% of traders — so you can trade smart, calculated, and professional just like the big players.

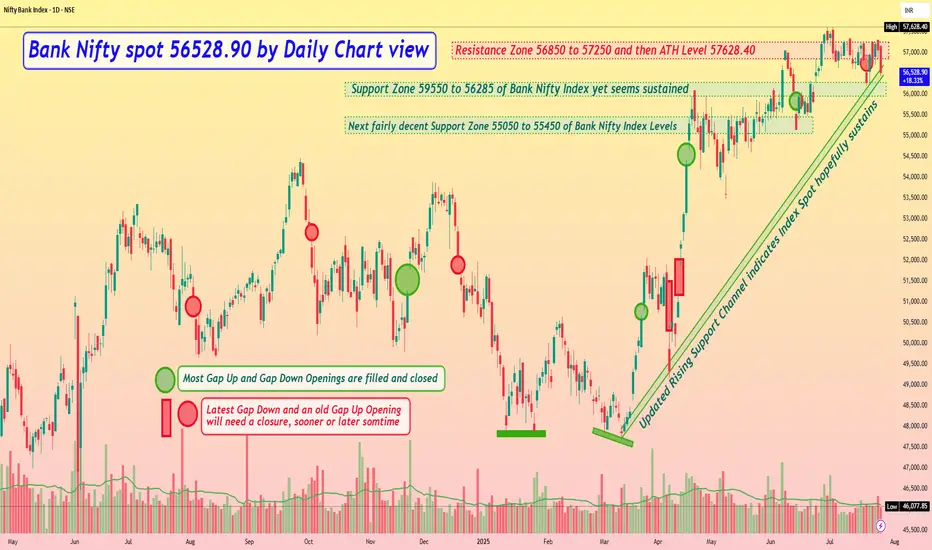
Bank Nifty spot 56528.90 by Daily Chart view - Weekly updateBank Nifty spot 56528.90 by Daily Chart view - Weekly update
- Resistance Zone seen at 56850 to 57250 and then ATH Level 57628.40
- Updated Rising Support Channel indicates Index Spot hopefully sustains
- Support Zone seen at 59550 to 56285 of Bank Nifty Index yet seems sustained
- Next fairly decent Support Zone seen at 55050 to 55450 of Bank Nifty Index Levels
- *Multiple reasons attribute for weakness and breakdown and that is how Markets show their Supremacy*
Learn Institutional Trading🔷 What is Institutional Trading?
Institutional Trading refers to how big players (institutions) like mutual funds, hedge funds, pension funds, insurance companies, and proprietary trading firms operate in financial markets—especially in stocks, futures, and options. These institutions trade with huge capital—often in crores or billions of rupees/dollars—and have access to advanced tools, data, and insider-level insights that retail traders (individual traders like us) do not.
They don’t trade based on tips, YouTube calls, or simple indicators like RSI or MACD. They trade based on order flow, liquidity zones, volume data, and macroeconomic models. Their strategies are often data-driven, algorithmic, and backed by deep research.
🔷 Why is it Important to Learn Institutional Trading?
Because retail traders often lose money by following surface-level analysis. If you want to play against or with the big boys, you need to understand how institutions think, trade, and manipulate the market to create liquidity and trap uninformed traders.
Once you start thinking like an institution, you’ll stop falling for fake breakouts, news-based traps, or retail patterns that no longer work.
🔷 How Do Institutions Trade?
Institutions don’t just click "buy" or "sell" like retail traders. They use strategic and layered approaches to build or unload positions without disrupting the market.
Let’s break down some techniques:
1. Accumulation and Distribution
Accumulation Phase: This is where institutions silently buy large quantities of a stock at lower prices without moving the market too much.
Distribution Phase: After pushing the price up (with smart buying), they start selling slowly to retail traders who are buying out of FOMO.
👉 Retail gets trapped at the top, institutions exit with profit.
2. Order Flow & Liquidity Grabs
Institutions need liquidity to enter or exit. That’s why they often:
Create fake breakouts or false signals to trap retailers.
Induce stop-loss hunting moves to trigger retail orders (that’s their liquidity).
Then, they reverse the market direction, moving it in their favor.
This is often called Smart Money Concepts.
3. Volume Weighted Trading
Institutions monitor VWAP (Volume Weighted Average Price) to decide their entries/exits. They break up large orders into small pieces and execute them using algorithms to stay unnoticed.
4. Use of Derivatives (Options & Futures)
They hedge their large cash market positions using options and futures, which allow them to manage risk efficiently while maximizing profit.
🔷 Institutional Trading Strategies
Here are some strategies that institutions commonly use (simplified for learning):
📌 1. Long/Short Equity
Long on undervalued stock
Short on overvalued stock in the same sector
Reduces risk, aims to profit from relative performance.
📌 2. Arbitrage Trading
Taking advantage of price differences in different markets (e.g., cash-futures arbitrage).
📌 3. Sector Rotation Strategy
Moving capital from underperforming sectors to upcoming ones based on macroeconomic analysis (e.g., rotating from IT to Pharma).
📌 4. Options Hedging
Buying call/put options to protect existing large positions.
Selling premium to generate income (covered calls, iron condors).
📌 5. Event-Driven Trades
Based on earnings, mergers, policy changes (institutions often trade heavily on such events, with better insight and preparation).
🔷 Signs of Institutional Activity
Watch for these clues:
Unusual volume with no news
Sudden reversals after stop-loss hits (classic liquidity grab)
Consolidation near support/resistance with rising volume (accumulation)
Breakouts with heavy volume follow-up (institutional buying confirmation)
Options OI buildup in a particular strike
🔷 How to Learn Institutional Trading (Step by Step)
Understand Market Microstructure
Learn how orders, bid-ask spreads, and liquidity actually work.
Master Price Action and Volume Analysis
Indicators lag. Institutions trade with price and volume.
Learn about Order Blocks, Fair Value Gaps
These are institutional concepts showing where smart money entered.
Study Smart Money Concepts (SMC)
Focus on concepts like:
Liquidity Sweep
Inducement
Mitigation
Imbalance zones
Market Structure Shift
Use TradingView Smart Tools
Explore order block indicators, volume profile, VWAP, etc.
Observe Options Open Interest (OI)
Track institutional options positions using OI analysis.
Backtest and Practice
Use market replay tools to simulate institutional strategies.
🔷 Myths About Institutional Trading
❌ "Institutions only invest, they don’t trade intraday."
→ Truth: They have high-frequency trading (HFT) algorithms that execute millions of trades daily.
❌ "You need crores to trade like an institution."
→ Truth: You can mirror their logic even with small capital—if you understand market structure, liquidity, and volume.
❌ "Retail traders can’t win."
→ Truth: You can’t win if you play their game with your rules. But if you learn how they play, you can follow their footprints.
🔷 Final Thoughts
Institutional Trading is not a “strategy,” it’s a mindset.
It's about understanding:
Where is smart money entering or exiting?
Where is retail being trapped?
Where is liquidity sitting?
Once you start focusing on market structure, volume behavior, price action, and liquidity zones, your trades will become more accurate, logical, and profitable.
Retail indicators lag. Institutions don’t follow them.
They create the moves, while indicators show what already happened.

institutional Nifty-50 option tradingInstitutional Nifty-50 option trading refers to the strategic use of Nifty-50 options (CE & PE) by FIIs, DIIs, Hedge Funds, and Banks to hedge, speculate, or manage risk on large capital positions. Unlike retail, their trades are data-driven and volume-heavy.
Key Institutional Strategies:
Delta-Neutral Strategies – Like Long Straddles or Strangles, where institutions profit from volatility.
Covered Call / Protective Puts – To hedge large Nifty portfolios.
Bull/Bear Spreads – Deployed when directional conviction is strong but limited in risk appetite.
Option Writing – Writing options at OI resistance/support to generate premiums.
Calendar Spreads – Leveraging time decay while anticipating movement.
📈 How to Track Institutional Activity:
Option Chain Analysis: Spot high OI shifts with unusual volumes.
OI + Volume + IV: Use combined data to infer institutional positioning.
Change in PCR (Put Call Ratio): Signals sentiment shift at index levels.
FII-DII Daily Derivative Data: Published by NSE after market hours.
Strike-wise Open Interest Heatmaps: Help identify resistance/support zones built by institutions.

Advance Option TradingKey Concepts in Advanced Options Trading
Multi-Leg Strategies:
Advanced options trading heavily involves multi-leg strategies — using two or more options contracts in a single trade. Popular ones include:
Iron Condor: A neutral strategy involving four different options contracts to profit from low volatility. It generates a limited profit if the stock remains within a specific range.
Straddles and Strangles: Used when expecting a large price move, but unsure of the direction. Traders buy both a call and a put option.
Butterfly Spreads: These limit both risk and reward and are ideal when the trader believes the stock will stay near a specific price.
Adjustments and Rolling:
Unlike basic options traders who may let contracts expire, advanced traders constantly adjust positions. For example, if a trade moves against them, they may "roll" the position — closing it and reopening another at a different strike or expiry.
Understanding Option Greeks:
Advanced traders don’t just bet on direction; they manage exposure to:
Delta (Direction)
Gamma (Rate of change of delta)
Theta (Time decay)
Vega (Volatility sensitivity)
Rho (Interest rate impact)
This helps in building more calculated, data-driven trades.
Volatility Trading:
Volatility is key in advanced options. Some traders look to exploit Implied Volatility (IV) — pricing of future volatility — by trading IV crush around earnings or economic events. For instance, an Iron Condor may be used when IV is high, aiming to profit from the IV drop.
Directional vs. Non-Directional Trading:
Advanced traders often prefer non-directional strategies. These are setups where you can make money even if the market goes sideways, such as with Iron Condors or Calendar Spreads.
Risks in Advanced Options Trading
While the rewards can be higher, so are the risks. Complex strategies can lead to significant losses if misunderstood. Margin requirements can be high, and some trades may have unlimited loss potential (e.g., uncovered calls). Hence, strict risk management, stop-loss rules, and position sizing are essential.
Final Thoughts
Advanced options trading is not for beginners, but for those who want to move beyond simply guessing market direction. It’s about constructing trades that work in various market conditions — bullish, bearish, or sideways — and using volatility and time as weapons. With the right knowledge and discipline, advanced options can become a powerful tool in any trader’s arsenal. However, success requires education, continuous learning, and a clear understanding of risk and reward

Sensex 1D Timeframe
📈 Sensex (BSE 30) Today’s Overview (1D Time Frame)
Opening Level: Sensex opened higher around 82,350 to 82,500 points, continuing the positive momentum from previous sessions.
Intraday High: Reached around 82,530 in the first half of the session.
Intraday Low: Dropped to approximately 82,170–82,200 in the afternoon session.
Current Trading Range: Mostly trading between 82,200 and 82,500 levels, with a slight upward bias.
Previous Close: Around 82,180–82,200.
Net Change: Trading +0.2% to +0.3% higher, showing slight gains.
🔍 Key Market Drivers Today
Positive Impact:
Strong earnings from banking stocks, especially HDFC Bank and ICICI Bank, are boosting index strength.
Eternal Group (parent of Zomato) surged significantly, adding positivity to market sentiment.
Low volatility today, with India VIX falling, indicating reduced fear in the market.
Negative Impact:
Realty, PSU Banks, and Media sectors underperformed, capping higher gains.
Profit booking seen in auto and pharma stocks, causing minor mid-session dips.
📝 Technical Summary
Trend: Overall uptrend remains intact, with minor intraday corrections.
Support Levels: Immediate support around 82,170–82,200 zone.
Resistance Levels: Strong resistance around 82,500–82,550, breakout beyond which could take Sensex toward 83,000.
Volatility: Low volatility suggests possible slow and steady upward movement
✅ Summary Conclusion
Today, Sensex is mildly positive, driven by financial sector strength and earnings momentum. Some sector rotation is visible with pockets of weakness in PSU and Realty stocks. Volatility remains low, supporting a controlled trading session with limited intraday swings.

A possible Head and Shoulder formation in BankniftyChance of a head and shoulder formation on the hourly chart of the Index.
If the market clears the resistance line around 57300, it can form another high or test the recent high made.
On the lower side, there is are support and it may respect the support levels.
Major support levels :- 56800, 56640
Resistance levels :- 57285, 57600
Wait for the market to move above the neck line for any bullish trade to enter in the index. Else bearish trade can be initiated below 56650 levels.
Watch for the price action near the price levels before entering the trade.

Banknifty Swing AnalysisBank nifty potentially is in a corrective wave, the downside forecast has been marked. Currently it is still in wave A. If wave A is impulsive and current rally lacks momentum/divergent on RSI, then it's likely wave B. This bull trap could lure traders thinking a new uptrend has begun, only to be followed by wave C collapse.
