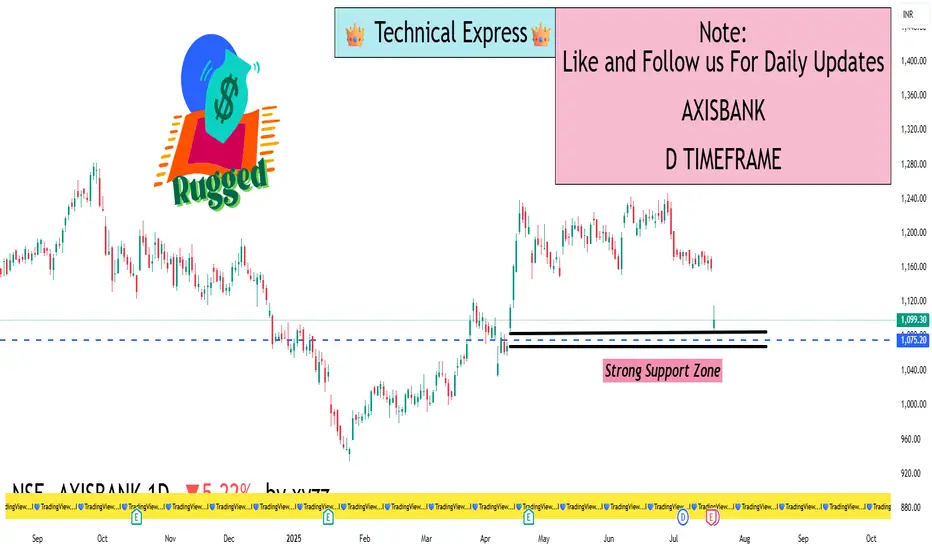
AXISBANK – 1D Timeframe📊 AXISBANK – DAILY CHART (1D TIMEFRAME)
📅 Date: July 18, 2025
Closing Price: ₹1,099
Change: –₹60.50 (–5.2%)
Intraday Range: ₹1,074 (Low) – ₹1,159 (High)
52‑Week Range: ₹867 – ₹1,186
YTD Return: Approx. +8%
Volume: Heavier than average, indicating strong selling pressure.
⚠️ MARKET CONTEXT & TREND
Bearish Trend: Axis Bank has broken below key support zones.
Oversold RSI: While it suggests possible short-term bounce, confirmation is needed.
Strong ADX: Indicates trend strength is increasing — in this case, on the downside.
High Volume Sell-off: Indicates institutional or heavy selling pressure.
No reversal indicators yet – MACD is still negative and falling.
🔍 SUMMARY VIEW
Trend: Strongly Bearish
Momentum: Weak, heavily oversold
Volatility: High
Reversal Signs: Not yet confirmed
Short-Term Outlook: Bearish to sideway unless price reclaims ₹1,120–1,150 zone
🔮 WHAT TO WATCH NEXT
Reversal Confirmation: Look for RSI climbing back above 30 and MACD crossover.
Volume Drop on Red Days: If selling volume dries up, it may signal weakening bears.
Breakout above ₹1,150: Could confirm fresh buying and trend reversal.
Further Drop Below ₹1,070: Could lead to panic selling and deeper correction
Bankniftyanalysis
Master Candle Sticks✅ Why Candlesticks Are So Powerful
Candlesticks visually represent real-time market sentiment. Every single candlestick shows you:
Who is in control (buyers or sellers).
The strength of momentum.
Potential exhaustion or continuation.
The battle between retail traders and smart money.
Unlike indicators, which lag, candlesticks are real-time market footprints, helping traders make quick, informed decisions based on pure price action.
✅ Structure of a Candlestick
Every candlestick consists of:
Body: The range between open and close prices — shows strength or weakness.
Wick/Shadow: High and low of the session — shows rejection, liquidity grabs, or manipulation.
Color: Bullish (green/white) vs. Bearish (red/black).
The size of the body and wicks tells a story about market strength or indecision.
✅ Essential Candlestick Patterns
🔵 Reversal Patterns:
Pin Bar (Hammer/Inverted Hammer): Long wick shows rejection of price and potential reversal.
Engulfing Candles: Bullish or bearish candles fully engulf previous candle → momentum shift.
Morning Star / Evening Star: Three-candle reversal at key levels → trend change confirmation.
Doji: Indecision candle, often seen before reversals or breakouts.
🔵 Continuation Patterns:
Inside Bar: Consolidation, often leading to breakouts in the direction of trend.
Bullish/Bearish Flag: Continuation after a sharp move.
Three White Soldiers / Three Black Crows: Strong multi-candle trend confirmation.
✅ Advanced Institutional Candlestick Secrets
🔥 Secret 1: Candlesticks at Key Market Levels
Candlestick signals are most reliable at:
Order Blocks
Support & Resistance Zones
Liquidity Pools
Imbalance/Fair Value Gaps
Always combine candlestick signals with higher timeframe zones for high-probability setups.
🔥 Secret 2: Wick Rejections & Stop Loss Hunts
Institutions often push price to grab liquidity beyond a support/resistance level, shown by long wicks. Wick rejections = liquidity grab = high reversal probability.
🔥 Secret 3: Multi-Timeframe Candlestick Reading
A single higher timeframe candle (Daily, 4H) is built from multiple smaller timeframe candles. Professionals:
Use HTF direction and LTF entry.
For example, Daily bullish engulfing + M15 break of structure = precise sniper entry.
✅ How to Master Candlestick Trading
✅ Focus on clean price action, avoid overcrowding charts with indicators.
✅ Study reaction at key levels, not random patterns.
✅ Always confirm with market structure (trend direction, higher highs/lows, BOS/CHoCH).
✅ Use candlestick confluence, combining patterns with liquidity zones, order blocks, or supply/demand.
✅ Avoid low-quality signals in choppy or low-volume markets.
✅ How Institutions Use Candlesticks
Institutions manipulate candles during low liquidity periods (fakeouts).
They use time-based traps, creating bullish/bearish patterns before reversing direction.
Volume + Candlestick Analysis shows true institutional intent — e.g., high volume bullish pin bars after liquidity grab = strong upside signal.
✅ Pro Tips for Candlestick Mastery
💡 Best signals occur after liquidity grabs — false breakout + rejection wick.
💡 Always combine candlesticks with market structure shifts — don’t take isolated signals.
💡 Trade in the direction of higher timeframe momentum, even if lower timeframe gives opposite signals.
💡 In sideways markets, avoid reversal signals, favor range trades.
✅ Final Thoughts
Candlesticks are the true language of the market. By mastering candlestick trading, you’ll gain the ability to predict market moves before they happen, trade with confidence, and avoid the common mistakes of indicator-dependent retail traders.
Master Candlestick Trading is your first step to becoming a consistently profitable trader, whether in forex, stocks, crypto, or commodities

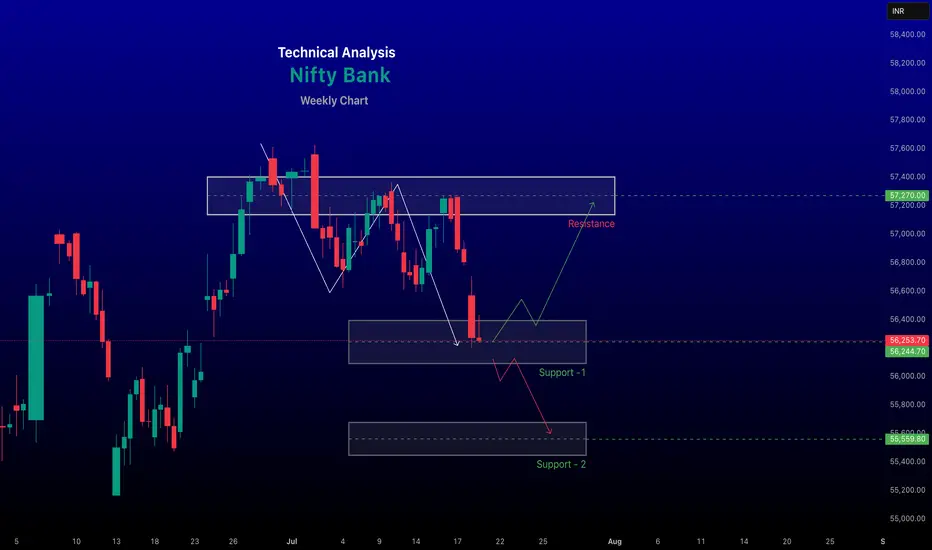
renderwithme | Banknifty index for the week of July 21-25, 2025
~~ Predicting involves analyzing recent trends and technical indicators. Based on available data, Bank Nifty closed at 56,283 on July 18, 2025, reflecting a bearish sentiment with a 0.35% decline. Technical analysis suggests a consolidation phase, with key support levels at 56,200–56,500 and resistance at 57,000–57,500. A break below 56,000 could trigger further selling toward 55,500, while a close above 57,500 may signal a bullish reversal targeting 57,800–58,000. Market sentiment is cautious due to global trade tensions, rising crude prices, and upcoming earnings from major banks like #HDFCBank and #ICICIBank , which could influence volatility. Domestic institutional buying provides some support, but foreign institutional selling adds pressure. Traders are advised to monitor these levels closely and maintain strict stop-losses.
Char for your reference only
~~ Disclaimer ~~
This analysis is based on recent technical data and market sentiment from web sources. It is for informational \ educational purposes only and not financial advice. Trading involves high risks, and past performance does not guarantee future results. Always conduct your own research or consult a SEBI-registered advisor before trading.
# Boost and comment will be highly appreciated.
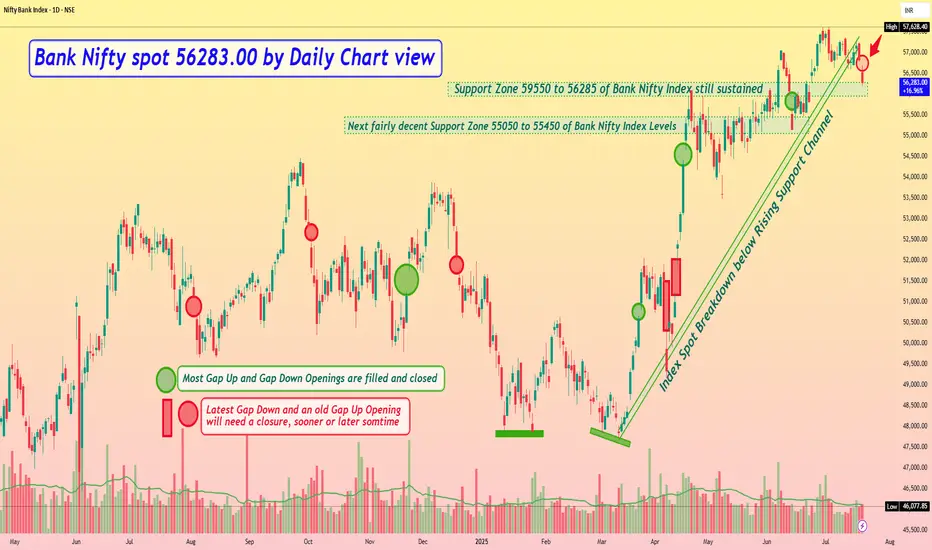
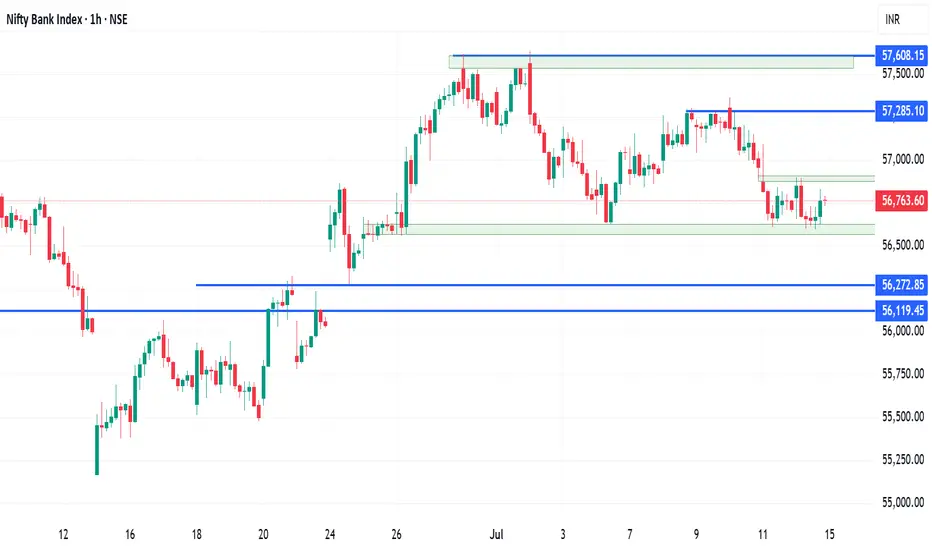
Bank Nifty spot 56283.00 by Daily Chart view - Weekly updateBank Nifty spot 56283.00 by Daily Chart view - Weekly update
- Resistance Zone 56840 to 57200 and then ATH Level 57628.40
- [ b]*Bank Nifty Index Spot Breakdown below Rising Support Channel*
- Support Zone 59550 to 56285 of Bank Nifty Index *still sustained*
- Next fairly decent Support Zone 55050 to 55450 of Bank Nifty Index Levels
- Bank Nifty Index Gap Down Opening today 18-July-2025 to act as tiny resistance hurdle
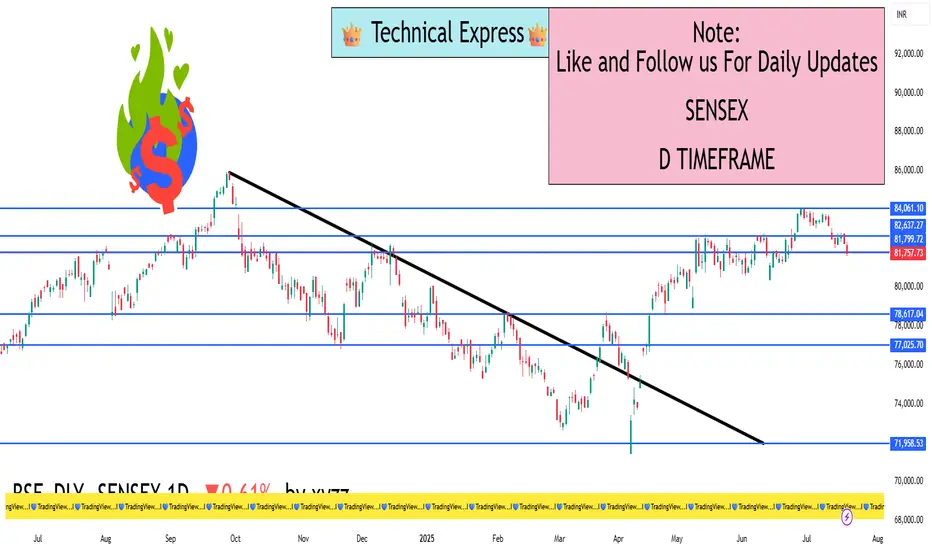
Sensex – 1 Day Timeframe✅ Closing Summary:
Closing Price: ₹82,540.65
Change: −₹501.34 (−0.60%)
Opening Price: ₹83,081.80
Intraday High: ₹83,114.95
Intraday Low: ₹82,488.25
The Sensex fell over 500 points, reflecting broad-based selling across banking, IT, and financial services. The index struggled to hold gains and faced resistance at higher levels throughout the day.
🔍 Key Reasons for the Decline:
Weak Earnings from Financials:
Axis Bank and other financial stocks reported disappointing quarterly results.
As financial stocks hold significant weight in the Sensex, this created negative sentiment across the board.
IT and Tech Sector Pressure:
Global uncertainty, U.S. Fed rate concerns, and weak guidance from global tech firms contributed to a fall in Indian IT stocks like Infosys and TCS, dragging the index.
Foreign Institutional Investor (FII) Selling:
FIIs were net sellers in July, putting pressure on large-cap blue-chip stocks.
Persistent outflows created downward pressure on the index despite support from domestic institutional buyers.
Global Market Cues:
Mixed global signals, rising oil prices, and uncertain interest rate outlooks kept risk sentiment subdued.
Caution ahead of major global economic data further prevented buying enthusiasm.
📈 Technical Outlook (Short-Term):
Support Zone: ₹82,300 to ₹82,000
This is a key demand zone. A breakdown below could lead to further downside towards ₹81,500.
Resistance Zone: ₹83,150 to ₹83,500
Any bounce-back will face selling near this region unless backed by strong buying volume.
Indicators:
RSI: Dropped below 45, indicating weakening strength.
MACD: Shows a bearish crossover, confirming short-term negative momentum.
Volume: Heavier than average, signaling increased institutional activity on the sell side.
📆 Recent Trend Performance:
1-Day Return: −0.60%
1-Week Return: −0.45%
1-Month Return: +1.85%
6-Month Return: +12.3%
1-Year Return: +11.7%
The index remains strong over the long term, but the short-term chart reflects a corrective phase amid sectoral weakness.
🧠 What Traders & Investors Should Know:
Short-Term Traders: Monitor the 82,300 level for signs of bounce or breakdown. Potential intraday setups are forming, but caution is advised.
Swing Traders: Wait for a confirmation candle—like a bullish engulfing or hammer—near the support before entering long positions.
Long-Term Investors: This correction may offer a healthy buy-on-dip opportunity, particularly in stocks with strong fundamentals in auto, capital goods, and FMCG sectors.
💬 Conclusion:
The Sensex declined nearly 0.60% due to earnings pressure from major financials and global uncertainty impacting IT and large-cap stocks. While the market sentiment remains weak in the short term, the long-term uptrend is still intact. Key support around ₹82,300 will determine the near-term direction. If held, a rebound may follow next week, especially if major earnings turn out better than expected.
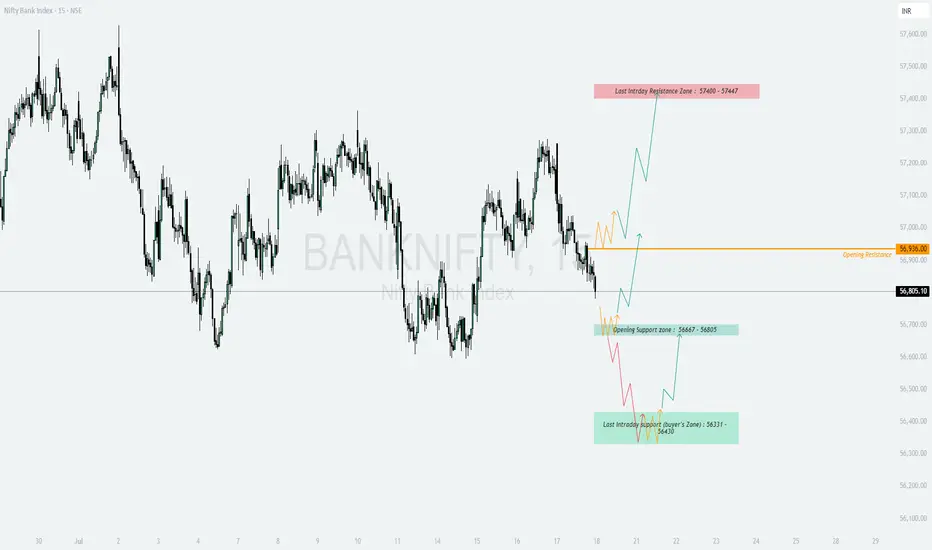
BANKNIFTY - Trading levels and Plan for 18-Jul-2025📊 BANK NIFTY INTRADAY TRADING PLAN – 18-Jul-2025
Gap Opening Reference: 200+ Points Considered Significant
📍 IMPORTANT LEVELS TO MONITOR
🟥 Last Intraday Resistance Zone: 57,400 – 57,447
🟧 Opening Resistance: 56,936
🟩 Opening Support Zone: 56,667 – 56,605
🟢 Last Intraday Support (Buyer’s Zone): 56,331 – 56,430
🚀 SCENARIO 1: GAP-UP OPENING (Above 57,136) 📈
(Gap opening considered above 200+ points from the previous close)
If Bank Nifty opens above 57,136 , strength is expected toward Last Intraday Resistance Zone: 57,400 – 57,447 .
Avoid buying immediately after the opening candle; allow 15–30 minutes for price confirmation and volatility settlement.
If price sustains above 57,400 , upside momentum may continue, but consider trailing your stop-loss as this is an exhaustion zone.
Options Tip: Consider ATM or slightly OTM Call Options or Bull Call Spread setups for controlled risk.
📊 SCENARIO 2: FLAT OPENING (Between 56,667 – 56,936) ⚖️
This range marks the equilibrium between buyers and sellers, as defined by Opening Support Zone and Opening Resistance .
Observe the first 15–30 minute candle for clear direction.
If price sustains above 56,936 , bias turns bullish toward 57,400 – 57,447 .
If price breaks below 56,667 , sellers may push Bank Nifty toward Buyer’s Zone: 56,331 – 56,430 .
Options Tip: Employ Strangle or Iron Fly strategies around flat openings with tight ranges.
📉 SCENARIO 3: GAP-DOWN OPENING (Below 56,467) ⚠️
If Bank Nifty opens below 56,467 , downside momentum may accelerate toward Last Intraday Support: 56,331 – 56,430 .
Avoid instant selling at open. Let first 15–30 minute candle give direction clarity.
If price sustains below 56,331 , weakness could extend further.
Options Tip: Focus on ATM or ITM Put Options , or Bear Put Spreads for safer downside positioning.
💡 OPTIONS TRADING RISK MANAGEMENT TIPS
📏 Risk no more than 1–2% of your capital on any single trade.
⏳ Give at least 15–30 minutes after market open before initiating trades.
🔐 Use Hourly Close-based Stop Losses to avoid getting trapped by wicks.
⚖️ Prefer hedged strategies ( Spreads, Iron Fly, Strangles ) during high IV (Implied Volatility) phases.
🚫 Avoid revenge trading. Accept stop-loss gracefully; focus on next setup.
📌 SUMMARY & CONCLUSION
Bullish Bias: Gap-up above 57,136 → Focus on 57,400–57,447 zone.
Range-bound Bias: Flat between 56,667–56,936 → Watch for breakout confirmation.
Bearish Bias: Gap-down below 56,467 → Eye on 56,331–56,430 support zone.
Prioritize confirmation from 15–30 minute opening range before acting.
Maintain strict risk management discipline using options tools like spreads.
⚠️ DISCLAIMER: I am not a SEBI-registered analyst. This trading plan is shared strictly for educational and informational purposes. Please consult your financial advisor before making any trading or investment decisions.
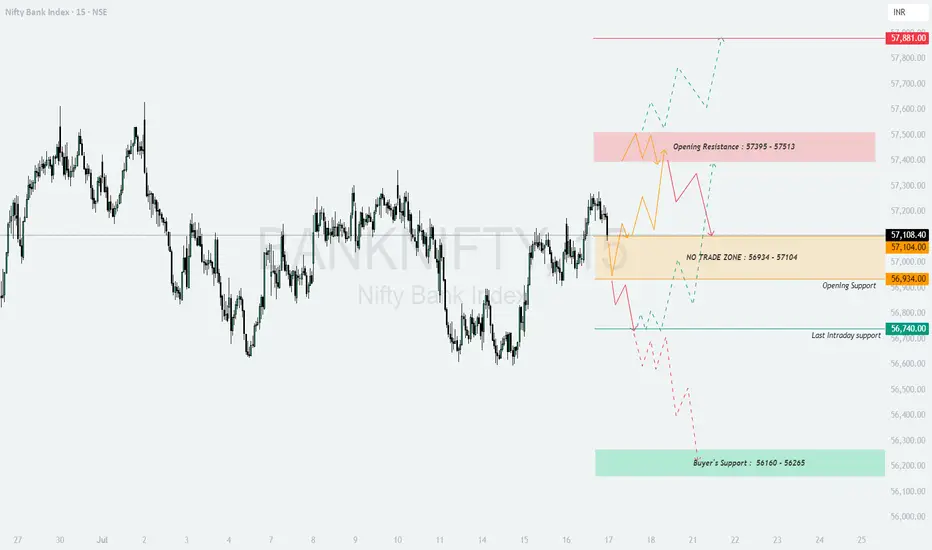
BANKNIFTY : Intraday Trading levels and Plan for 17-July-2025📊 BANK NIFTY INTRADAY TRADING PLAN – 17-Jul-2025
200+ Points Gap Opening Considered Significant | Structured by Psychological Zones
📍 KEY ZONES AND LEVELS TO MONITOR:
🟥 Opening Resistance Zone: 57,395 – 57,513
🔴 Profit Booking Resistance: 57,881
🟧 NO TRADE ZONE: 56,934 – 57,104
🟦 Opening Support: 56,934
🟩 Last Intraday Support: 56,740
🟩 Buyer’s Support Zone: 56,160 – 56,265
🚀 SCENARIO 1: GAP-UP OPENING (Above 57,395) 📈
If BANK NIFTY opens above 57,395 with 200+ points gap-up, the market enters the Opening Resistance Zone (57,395 – 57,513) .
Buyers should be cautious within this zone, focusing only on quick momentum scalps until a 15-minute candle closes above 57,513 .
If 57,513 breaks and sustains, the next target would be 57,881 (Profit Booking Resistance) .
Options Tip: Deploy ATM Call Options with small quantity initially, increase exposure only on candle confirmation. Avoid far OTM calls in strong gap-ups.
📊 SCENARIO 2: FLAT OPENING (Between 56,934 – 57,104) ⚖️
This zone is marked as NO TRADE ZONE on the chart. Prices may behave indecisively here, so patience is key.
If BANK NIFTY sustains above 57,104 after opening flat, expect upside continuation toward the Opening Resistance Zone.
If BANK NIFTY breaks below 56,934 , look for weakness targeting Last Intraday Support 56,740 .
Options Tip: Consider Iron Condor or Strangle Writing setups within this NO TRADE ZONE if volatility is high. Otherwise, wait for breakout confirmation.
📉 SCENARIO 3: GAP-DOWN OPENING (Below 56,740) ⚠️
If BANK NIFTY opens below 56,740 with a significant gap, bearish momentum is confirmed.
The immediate downside target would be the Buyer’s Support Zone: 56,160 – 56,265 .
Sell-on-rise strategy can be considered after the first 15-minute candle closes below 56,740 .
Options Tip: Prefer ATM or ITM Put Options or build Bear Put Spreads for controlled risk-reward. Avoid naked shorts in case of sudden reversal.
💡 RISK MANAGEMENT TIPS FOR OPTIONS TRADERS
📏 Risk only 1–2% of capital per trade.
⏳ Avoid aggressive entries in the first 15–30 minutes ; let price settle.
🔐 Use Hourly Candle Close for major decision stops, not just wick-based SL.
⚖️ Consider Hedged Strategies (like spreads) during volatile conditions.
📅 Avoid trading just before major news events or expiry if possible.
📌 SUMMARY & CONCLUSION
Bullish Scenario: Gap-up above 57,395 → Target 57,881
Neutral Scenario: Flat between 56,934 – 57,104 → Wait for breakout confirmation
Bearish Scenario: Gap-down below 56,740 → Target 56,160 – 56,265
Trade cautiously around marked zones and follow structured rules. Consistency over prediction!
⚠️ DISCLAIMER: I am not a SEBI-registered analyst. This plan is shared for educational and informational purposes only. Please consult your financial advisor before making any investment decisions.
BANK NIFTY view for 16-07-202557193-57213 will act as a crucial resistance followed by there is an upper TL and Broadening top formation.
If it breaks above TL highs will be the targets.
If it takes resistance as mentioned it will reach support level 56600. Once it breaks and closes below 56550 in lower TF we can expect huge downside.

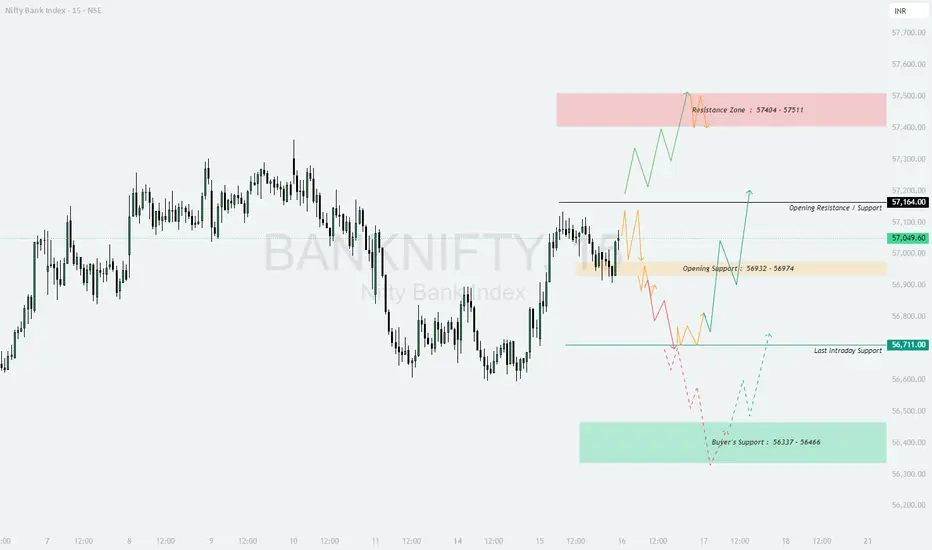
BANKNIFTY : Trading levels and plan for 16-July-2025📊 BANK NIFTY INTRADAY TRADING PLAN – 16-Jul-2025
Based on 15-Min Chart Observation | 200+ Point Gap Considered Significant
📍 IMPORTANT LEVELS TO WATCH
🟥 Resistance Zone: 57,404 – 57,511
⚫️ Opening Resistance / Support: 57,164
🟧 Opening Support Zone: 56,932 – 56,974
🟩 Last Intraday Support: 56,711
🟩 Buyer’s Support Zone: 56,337 – 56,466
🚀 SCENARIO 1: GAP-UP OPENING (Above 57,164) 📈
If BANK NIFTY opens above 57,164 with a gap of 200+ points, expect a continuation toward the Resistance Zone 57,404 – 57,511 .
Aggressive buying should only be considered after a 15-min candle close above 57,164 to confirm strength.
If prices enter the Resistance Zone, avoid fresh longs and look for profit booking opportunities.
Options Tip: Focus on ATM or ITM Call Options . Avoid far OTM options on gap-up days to minimize theta loss.
📊 SCENARIO 2: FLAT OPENING (Between 56,932 – 57,164) 🔄
This range is marked as a mixed zone: Opening Resistance / Support Zone . Price behavior here will set the day’s tone.
If BANK NIFTY sustains above 57,164 , move towards the bullish setup targeting the upper Resistance Zone.
If BANK NIFTY breaks below 56,932 , expect a decline toward Last Intraday Support 56,711 .
Options Tip: Consider Straddle or Strangle setups for premium decay if prices stay sideways between 56,932 – 57,164. Exit quickly if volatility spikes.
📉 SCENARIO 3: GAP-DOWN OPENING (Below 56,711) ⚠️
A gap-down below 56,711 signals bearish momentum. Initial downside target would be the Buyer’s Support Zone: 56,337 – 56,466 .
Wait for the first 15-minute candle close below 56,711 before shorting to confirm strength.
If prices bounce from Buyer’s Support Zone , observe for reversal signals and manage trailing stop-loss.
Options Tip: Favor ATM or ITM Put Options . On gap-downs, avoid naked far OTM positions—use Bear Put Spreads for balanced risk-reward.
💡 RISK MANAGEMENT TIPS FOR OPTIONS TRADERS
📏 Risk only 1–2% of your trading capital per trade.
⏳ Avoid impulsive entries in the first 15–30 minutes of market opening.
⚖️ Always mark your Stop-Loss based on candle close, not just price spikes.
📈 Choose ATM or ITM options —they offer better Delta and lesser time decay.
💼 Reduce position size when markets open with large gaps to avoid slippage risks.
📌 SUMMARY & CONCLUSION
Bullish Scenario: Above 57,164 → Target 57,404 – 57,511
Range-Bound Scenario: Between 56,932 – 57,164 → Watch closely for breakouts
Bearish Scenario: Below 56,711 → Target 56,337 – 56,466
Stay disciplined and patient. Let the market come to your planned levels instead of chasing moves.
⚠️ DISCLAIMER: I am not a SEBI-registered analyst. This analysis is for educational purposes only. Please do your own research or consult a certified financial advisor before making trading decisions.
BANKNIFTY TRADING PLAN – 15-JUL-2025📊 BANK NIFTY TRADING PLAN – 15-JUL-2025
Educational write-up based on key technical levels, considering all opening scenarios with a 200+ points gap threshold
💡 Previous Close: 56,763.60
⏱️ Candle Time Frame: 15-Min Chart
⚠️ Important Note: Allow the first 15–30 minutes to observe price action before committing capital.
Gap Opening Consideration: 200+ points
📌 KEY LEVELS TO WATCH
🟥 Resistance Zone: 57,410
🟥 Last Intraday Resistance: 57,160
🟧 Opening Resistance/Support Zone: 56,932 – 56,974
🟨 Opening Support: 56,629
🟩 Buyer's Zone (Best Buy Area): 56,328 – 56,427
🔴 Extreme Support Zone: 56,139
🚀 SCENARIO 1: GAP-UP OPENING (Above 56,932) 📈
If Bank Nifty opens above 56,932 with strength, immediate upside targets become 57,160 followed by 57,410 .
Do not jump in directly on a gap-up; wait for confirmation via price sustaining above the first 15-minute candle.
Failure to sustain above 56,932 can trigger profit booking. Reversal shorts should be considered below 56,974 if rejection candles form.
Options Traders: Prefer buying ATM/ITM CE options on strength with tight stop-loss. Avoid far OTM as theta burn is higher post gap-up.
📊 SCENARIO 2: FLAT OPENING (Between 56,629 – 56,932) 🔄
Flat opening in this range signals indecision. Observe whether price holds above or below Opening Support 56,629 .
If Bank Nifty sustains above 56,932 after a flat open, momentum can push towards 57,160.
Break below 56,629 increases downside risk. Expect drift towards the Buyer's Zone 56,328 – 56,427 .
Options Traders: Avoid directional trades in the first 15 minutes. Once structure is clear, use ATM strikes for better premium decay protection.
📉 SCENARIO 3: GAP-DOWN OPENING (Below 56,429) ⚠️
If Bank Nifty opens below 56,429 , immediate attention should be on the Buyer's Zone 56,328 – 56,427 .
This is a key bounce zone. If the zone holds, look for reversal trades; if broken, next possible support lies around 56,139 .
Avoid aggressive puts right at open post-gap-down. Wait for retests and price rejection confirmation before entering.
Options Traders: IV spikes are common post-gap-down. Focus on hedged positions or spreads to avoid overpaying for premiums.
💡 OPTIONS TRADING RISK MANAGEMENT TIPS
Use 1–2% capital allocation per trade.
Respect key support/resistance zones. Avoid chasing prices in emotional setups.
Stick to ATM/ITM strikes to reduce theta and volatility crush.
Be cautious post 2:30 PM – options time decay accelerates heavily.
Always trade with defined stop-loss based on 15-minute candle closes . Avoid relying solely on price ticks.
📌 SUMMARY & CONCLUSION
Bullish Trigger: Gap-up above 56,932 → Targets 57,160 – 57,410.
Neutral Zone: 56,629 – 56,932 → Observe first 15–30 minutes for clarity.
Bearish Trigger: Gap-down below 56,429 → Watch 56,328 – 56,139.
Stay patient. The market often gives second chances even if you miss the first move.
Options premium management and risk control are more important than chasing every move.
⚠️ DISCLAIMER: I am not a SEBI-registered analyst. This trading plan is shared for educational and learning purposes only. Please conduct your own research or consult with a financial advisor before making any trading decisions.

Banknifty analysis for the upcoming movement in the index.Banknifty has been trading in a range for a long time and is now trading around the support levels of 56600.
The RSI indicator on the daily charts is showing some bearish divergence and today the market has taken a halt after 2 days of fall.
If the market starts travelling on the lower side there are chances of testing the lower support level of 56120.
The market has been trading in a range of 56600 to 57600. And the support is tested many a times.
Bullish trades can be initiated for intraday play only once the market starts sustaining above today's high of 56900.
Moving averages are also forming a resistance gate around the resistance level. Watch for the breakout and enter only on the retest of the levels.
Major support levels :- 56600, 56270, 56120
Resistance levels :- 56900, 57285
Wait for the price action and trade according to the price action.
Option Trading Part-1 What Is Institutional Option Trading?
Institutional Option Trading involves using derivatives (Options) for:
Hedging big equity portfolios
Speculating on volatility or price movement
Arbitrage opportunities
🔹 Key Techniques:
Volatility Arbitrage
Delta-Neutral Hedging
Covered Calls
Protective Puts
Iron Condors & Spreads
How Institutions Use Options Differently
✅ Retail Focus:
Naked calls/puts
Directional trades
Limited capital
✅ Institutional Focus:
Portfolio insurance
Complex multi-leg strategies
Implied Volatility arbitrage
Event-based hedging (like earnings or Fed news)

BANKNIFTY : Trading levels and Plan for 14-Jul-2025📊 BANK NIFTY INTRADAY PLAN – 14 JULY 2025 (15-Min Chart Analysis)
Educational breakdown for gap-up, flat, and gap-down opening scenarios. Refer to chart zones carefully before executing trades.
📍 Previous Close: 56,712.85
📌 Gap opening threshold: 200+ points
⏱️ Tip: Allow the first 15–30 minutes for price settlement before acting on levels.
📌 KEY LEVELS TO MONITOR
Resistance Zone: 57,164
Last Intraday Resistance: 56,974
Opening Resistance Zone: 56,834
Opening Support/Resistance Zone: 56,688 – 56,640
Buyer's Support Zone: 56,427 – 56,330
Major Support (Breakdown Zone): 56,202
🚀 SCENARIO 1: GAP-UP OPENING (Above 56,834) 📈
Bias: Bullish with caution at upper resistance zones
If Bank Nifty opens above 56,834 , expect a direct test of Last Intraday Resistance: 56,974 .
Sustainable strength above 56,974 can lead towards 57,164 . This is the final resistance zone where booking profits is advisable.
If prices hit 57,164 early in the day, avoid chasing. Wait for a pullback and observe whether 56,974 holds as support.
On strong bullish momentum, avoid deep OTM call buying — stick with ATM/ITM options for safer theta exposure.
📊 SCENARIO 2: FLAT OPENING (Near 56,712 – 56,688) 🔄
Bias: Neutral-to-bearish depending on first hour structure
If opening is near 56,712 – 56,688 , focus on whether 56,688–56,640 (Opening Support/Resistance Zone) holds.
If price breaks and sustains below 56,640, expect a move toward Buyer’s Support Zone: 56,427 – 56,330 .
Best setups would come if price consolidates above or below this opening zone for 30–45 minutes before directional confirmation.
Wait for breakdown candle confirmation before taking PE trades. Avoid random entries in choppy structure.
📉 SCENARIO 3: GAP-DOWN OPENING (Below 56,502) ⚠️
Bias: Bearish with buy-on-dip potential at key support
If opening is below 56,502 , Bank Nifty may directly drift towards Buyer’s Support Zone: 56,427 – 56,330 .
Expect sharp reaction candles from this zone. This is where aggressive intraday buyers may step in.
If even 56,330 breaks, a further slide towards 56,202 becomes likely — avoid catching falling knives below this level unless there’s a clear structure forming.
For conservative traders, avoid counter-trading until price reclaims 56,688 after breakdown.
💡 OPTIONS TRADING – RISK MANAGEMENT TIPS
Use ATM or ITM options in fast-moving markets; avoid deep OTM trades as theta eats premium quickly.
If VIX is high, apply hedging strategies like vertical spreads to manage risk.
Avoid initiating trades based on the first 5-minute candle alone; confirmation is key.
Never risk more than 1–2% of total capital on any single trade.
Watch Bank Nifty along with Nifty and broader sector indices like PSU Banks for confirmation.
Avoid re-entry into the same trade direction after 2:45 PM to reduce event risk.
📌 SUMMARY & CONCLUSION
Bullish Trigger: Above 56,834 → Target 57,164
Neutral Zone: 56,712 – 56,688 → Wait for structure clarity
Bearish Trigger: Below 56,640 → Watch 56,427 – 56,330 for bounce
Trade with discipline, respect levels, and follow confirmation logic before acting.
Options buyers must avoid holding positions post 3 PM if trades are not in favor.
⚠️ DISCLAIMER: I am not a SEBI-registered analyst. This trading plan is for educational purposes only. Please do your own research or consult your financial advisor before trading.

BANKNIFTY : Trading levels and Plan for 11-Jul-2025📊 BANK NIFTY INTRADAY PLAN – 11 JULY 2025 (15min TF)
An educational and actionable trading strategy based on technical zones and opening behavior.
📍 Reference Close: 56,956.95
📈 Gap Opening Threshold: 200+ points
⏱️ Pro Tip: Let the market stabilize in the first 15–30 mins before entering trades for better confirmation.
📌 KEY LEVELS TO WATCH
Opening Resistance: 57,123
Last Intraday Resistance: 57,223
Profit Booking Zone: 57,609 – 57,678
NO TRADE ZONE: 57,020 – 56,910
Last Intraday Support: 56,768
Support for Consolidation: 56,436 – 56,518
Buyer's Support (Must Try Zone): 56,202 – 56,304
📈 SCENARIO 1: GAP-UP OPENING (Above 57,123)
Bias: Bullish, but caution at higher resistances
If Bank Nifty opens above 57,123 , momentum can build toward 57,223 , the last intraday resistance.
A breakout and sustained close above 57,223 opens the door for a move toward the Profit Booking Zone: 57,609–57,678 .
Watch for exhaustion signs like long upper wicks or volume drop at those higher zones to secure profits.
Avoid chasing CE options if IV is high post-gap-up; wait for consolidation or retracement.
📊 SCENARIO 2: FLAT OPENING (Between 57,020 – 56,910) – NO TRADE ZONE 🟧
Bias: Indecisive — Let market choose direction first
A flat open inside the No Trade Zone suggests potential chop and fakeouts.
Avoid fresh positions in this zone unless you get a decisive breakout above 57,123 or breakdown below 56,910 .
Use this time to observe option premium behavior and build directional bias based on price/volume cues.
Patience will be more profitable than premature trades here.
📉 SCENARIO 3: GAP-DOWN OPENING (Below 56,768)
Bias: Bearish to potential bounce plays
A gap-down below 56,768 puts bears in control, with support at 56,436–56,518 .
If prices break below that consolidation zone, expect a move towards Buyer’s Support Zone: 56,202 – 56,304 , where reversal is possible.
Look for bullish reversal candles at the lower zone for call buying or intraday pullback trade.
If breakdown continues below 56,200, avoid bottom fishing – stick with the trend.
💡 OPTIONS TRADING RISK MANAGEMENT TIPS
Avoid buying OTM options blindly on a gap-up or gap-down – IV crush is real!
Wait for a candle confirmation before jumping into a trade.
Use 15-minute candle close-based SL to prevent getting whipsawed.
Avoid trading in No Trade Zone unless a clear direction is established.
Use vertical spreads to limit risk and hedge positions.
Protect profits after 2 PM – avoid entering new trades in the last hour unless very high conviction.
📌 SUMMARY & CONCLUSION
Bullish Momentum: Above 57,123, target 57,609–57,678
Neutral/Choppy Zone: 57,020 – 56,910 – avoid taking trades here
Bearish Zone: Below 56,768, with bounce watch at 56,202–56,304
Let price action confirm your bias before committing capital
Control risk with predefined SL and avoid emotional trading
⚠️ DISCLAIMER: I am not a SEBI-registered analyst. The above analysis is for educational purposes only. Please consult a certified financial advisor before making trading decisions.

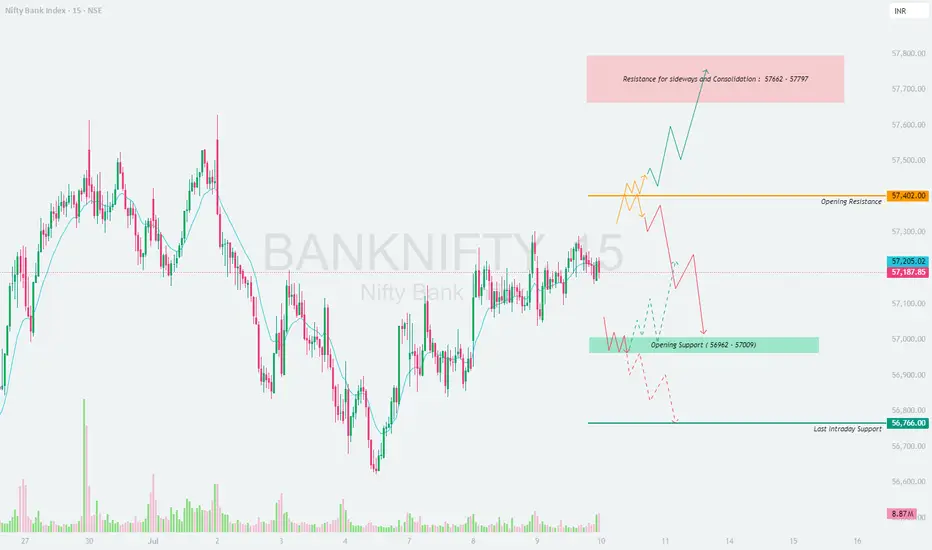
BANKNIFTY : Trading levels and plan for 10-July-2025📊 BANK NIFTY INTRADAY PLAN – 10 JULY 2025 (15min TF)
An educational, level-based strategy plan based on key price zones and expected market behavior
📍 Reference Close: 57,187.85
📈 Gap Opening Threshold: 200+ points
⏱️ Tip: Wait for the first 15–30 minutes post-opening before confirming breakout/breakdown setups
🔍 IMPORTANT LEVELS TO WATCH
Opening Resistance: 57,402
Resistance for Sideways & Consolidation: 57,662 – 57,797
Opening Support Zone: 57,009 – 56,962
Last Intraday Support: 56,766
📈 SCENARIO 1: GAP-UP OPENING (Above 57,402)
Bias: Bullish with potential consolidation at upper zones
A gap-up above 57,402 would signal early bullish strength.
Upside targets could stretch to 57,662–57,797 – a known resistance for consolidation.
If price shows rejection candles or wicks in this zone, consider partial profit booking or reversal setups.
Only continue bullish trades if 15-min candle closes above 57,797 with strong volume.
📊 SCENARIO 2: FLAT OPENING (Between 57,009 – 57,402)
Bias: Neutral to breakout – depends on price reaction
This zone is a battle ground. Price may test both support and resistance.
If Nifty Bank sustains above 57,205 and reclaims 57,402 , a breakout trade may evolve.
On the flip side, if it slips below 57,009 , sellers may try to push it toward 56,766 .
Avoid early trades. Wait for either a breakout above resistance or breakdown below support.
📉 SCENARIO 3: GAP-DOWN OPENING (Below 56,962)
Bias: Bearish to bounce watch
A gap-down below 56,962 will likely push price towards 56,766 – a key level for intraday reversal or panic selling.
If 56,766 holds, we may see short covering. Look for bullish reversal patterns in this zone.
If it fails, next leg of decline may start and one can ride the downside using puts or short futures with tight SL.
Reversal trades must be confirmed by bullish structure; avoid bottom fishing without confirmation.
💡 OPTIONS RISK MANAGEMENT TIPS
Trade near support/resistance, not inside indecision zones
For uncertain sessions, favor spreads (Bull Call/Bear Put) to limit risk
Avoid averaging down losing options – instead, re-analyze your thesis
Stick to 15-min candle close-based stop-loss to avoid fake moves
Protect capital during sideways zones like 57,009–57,205 – stay nimble
Time decay impacts premium heavily post-2PM – be cautious in scalping late trades
📌 SUMMARY & CONCLUSION
Bullish above 57,402 with upside resistance at 57,797
Sideways zone between 57,009 – 57,402 ; breakout to decide direction
Bearish bias below 56,962 , with last support at 56,766
Use patience and discipline – let the levels guide your trades
⚠️ DISCLAIMER: This is not investment advice. I am not a SEBI-registered analyst. The analysis is purely for educational purposes. Please consult your financial advisor before taking any trading decisions.
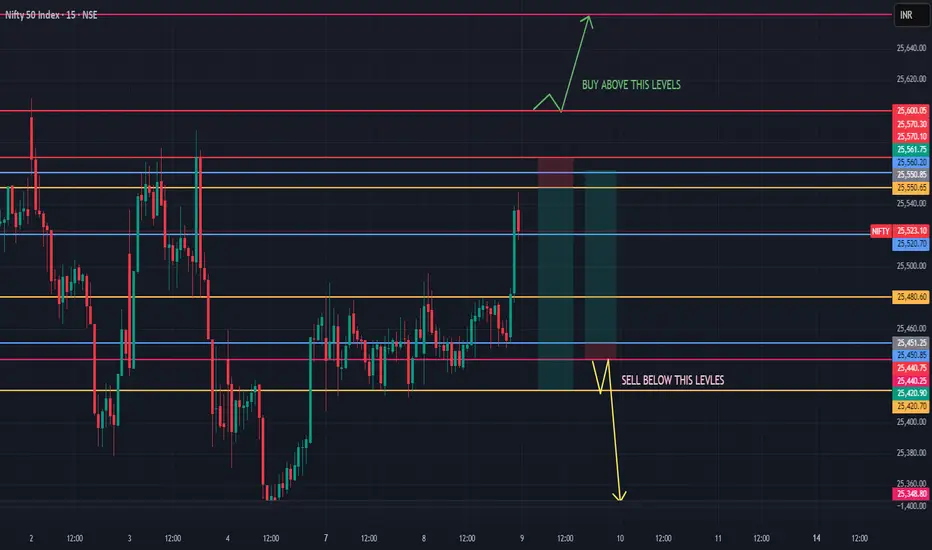
NIFTY INTRADAY LEVELS ( EDUCATIONAL PURPOSE) 09/07/2025🔷 NIFTY Intraday Trade Setup – 09 July
📊 Chart Timeframe: 15-min | Entry/Exit: 1-min TF
🔼 GAP-UP Opening (Above 25,550)
✅ Sell on breakdown below 25,540
🎯 Target: 25,480 → 25,420
🛑 Stop Loss: 25,570
Reason: Previous resistance zone; sellers may dominate
📌 Buy only above 25,600 with strong volume breakout
🎯 Target: 25,660 → 25,700
🛑 SL: 25,570
🔽 GAP-DOWN Opening (Below 25,450)
✅ Buy above 25,470 with bullish price action
🎯 Target: 25,520 → 25,560
🛑 Stop Loss: 25,440
📌 Sell below 25,420 if support breaks
🎯 Target: 25,350 → 25,300
🛑 SL: 25,460
🔁 FLAT Opening (Between 25,480 – 25,530)
🔁 Buy near 25,480–25,500 zone if strong support holds
🎯 Target: 25,550 → 25,600
🛑 SL: 25,470
🔁 Sell near 25,540–25,550 on rejection or resistance
🎯 Target: 25,490 → 25,450
🛑 SL: 25,570
⚠️ 1-Min Execution Tips:
✅ Wait for 1st 5-min candle to complete
📉 Avoid revenge trades post-breakout failure
🔁 Focus on structure, not emotion
🔄 Adjust levels dynamically with volume spike
BANKNIFTY - Trading plan and levels for 08-Jul-2025# 💼 \ BANK NIFTY INTRADAY PLAN – 08-July-2025\
📉 \ Index CMP:\ 56,919
📍 \ Chart Setup:\ Support/Resistance Zones + Price Reaction Patterns
🔍 \ Key Levels Analyzed for All Opening Scenarios (200+ pts gap considered)]
---
### 🔑 \ Key Zones To Watch:\
🟧 \ Opening Support / Resistance:\ **57,085**
🟥 \ Last Intraday Resistance Zone:\ **57,321 – 57,375**
🟥 \ Profit Booking / Supply Zone:\ **57,662 – 57,800**
🟦 \ Opening Support Zone:\ **56,657 – 56,705**
🟫 \ Last Intraday Support:\ **56,479**
---
## 🟩 \ 1. GAP-UP Opening (200+ points above 57,085)\
If BANKNIFTY opens above **57,285–57,375**, watch how it behaves inside the intraday resistance zone.
\
\ 📈 \ Breakout Opportunity:\
If price breaks above **57,375** with strength, target the higher **supply zone at 57,662–57,800**.
Entry only after a 15-min candle close above 57,375 with volume.
\ 🔻 \ Reversal from Resistance:\
If price opens in this zone and shows rejection (wick, bearish engulfing), short toward **57,085** with SL above 57,400.
\ 🧠 \ Tip:\ Avoid fresh buying directly into 57,662–57,800 unless market shows sustained momentum.
\
## 🟨 \ 2. FLAT Opening (between 56,880 – 57,085)\
Likely to consolidate early; wait for clean directional move from support or breakout level.
\
\ 🎯 \ Upside Trade:\
Buy above **57,085** if price sustains, target 57,321–57,375.
Watch for continuation if that zone breaks (same setup as Gap-Up case).
\ 🔻 \ Downside Trade:\
If price breaks below **56,880**, expect it to head toward **Opening Support Zone at 56,657–56,705**.
Avoid shorting aggressively in the middle of the range; instead trade near zones.
\ 🕒 \ Patience Pays:\
Wait 15–30 minutes post open for confirmation before executing trades.
\
## 🟥 \ 3. GAP-DOWN Opening (below 56,705)\
A bearish open below the Opening Support Zone brings the **Last Intraday Support (56,479)** into focus.
\
\ 📉 \ Short Opportunity:\
If price fails to sustain above 56,657 after a gap down and retests the level, short with a target of **56,479**.
SL should be just above 56,705.
\ 🔁 \ Reversal Opportunity:\
If price bounces strongly from **56,479–56,500**, a reversal trade may be taken back toward **56,705–56,880** zone.
Use bullish engulfing or inside bar breakout as confirmation.
\ 📌 \ Note:\ This zone is the last hope for intraday bulls – trade cautiously.
\
---
## 🧠 \ Risk Management Tips for Options Traders:\
✅ Trade ATM/ITM options to avoid time decay during consolidation.
✅ Avoid holding positions beyond 12:00 PM if direction remains unclear.
✅ Don’t buy CALLS near known resistance zones or PUTS near support without breakout confirmation.
✅ Use **fixed risk-reward ratio** setups – ideally 1:2 or more.
✅ Never average losers in options – especially in volatile zones.
---
## 📌 \ Summary & Conclusion:\
🎯 \ Above 57,375 = Bullish Continuation\ toward 57,800 possible.
⚠️ \ Rejection from 57,375 = Sell-off to 57,085 or lower.\
🧲 \ Buyers expected at 56,657–56,705 and 56,479.\
📊 Structure favors trend continuation if 57,085 holds as support.
---
⚠️ \ Disclaimer:\
This plan is for educational purposes only. I am \ not a SEBI-registered advisor\ . Please do your own research or consult a financial advisor before taking any trade based on this plan.

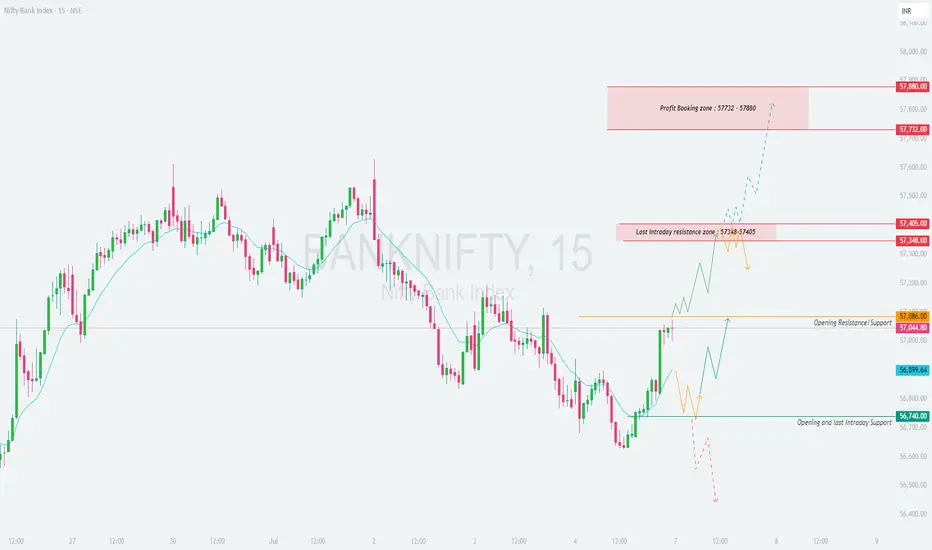
BANKNIFTY : Trading levels and plan for 07-July-2025📘 BANKNIFTY TRADING PLAN – 07-Jul-2025
🕒 Timeframe: 15-Minute | 📈 Structure: Support & Resistance Reaction Zones | ⚙️ Logic: Price Action-Based Intraday Decisioning
📍 Key Levels to Watch:
🔸 Opening Resistance / Support Zone: 57,086
🔸 Last Intraday Resistance Zone: 57,348 – 57,405
🔸 Profit Booking Zone: 57,732 – 57,880
🔹 Opening & Intraday Support Zone: 56,740
🔹 Minor Support Before Breakdown: 56,899
🟩 1. GAP-UP Opening (200+ points above 57,086)
If Bank Nifty opens near or above 57,300–57,400, it will be entering the Last Intraday Resistance Zone. Wait for price to sustain above 57,405 on 15-min candle close to confirm bullish strength.
📈 Action: Buy on breakout above 57,405, targeting 57,732 – 57,880 zone. Partial profit can be booked at 57,732.
🛑 Stop Loss: Keep SL just below 57,348 zone or use 15-min candle low.
⚠️ Caution: Avoid fresh longs near 57,800, as this is a profit booking zone.
If price fails to hold above 57,405 and shows rejection candles like doji/inverted hammers:
📉 Action: Consider shorting with SL above 57,405, targeting 57,086.
🛑 SL: Above the rejection wick
🎯 Target: Retest of breakout near 57,086
🟨 2. Flat Opening (between 56,899 – 57,086)
This range is the neutral zone, where the index may consolidate or create a directional breakout.
🕒 Wait for the first 15–30 mins to allow price action to unfold.
📈 If price breaks above 57,086 with volume, initiate long trade toward 57,348 – 57,405.
📉 If price rejects from 57,086 or breaks below 56,899, a short trade toward 56,740 becomes viable.
🛑 SLs: Use candle-close basis stops near breakout/breakdown levels.
🟥 3. GAP-DOWN Opening (200+ points below 56,740)
A gap-down below 56,740 brings us directly near the last intraday support breakdown area.
📉 Action: Sell on breakdown retest of 56,740, target 56,500 – 56,410 if downside continues.
🔄 Reversal Trade: If price sharply rebounds from 56,740 and crosses 56,899, consider reversal long trades with target 57,086.
🛑 SL: For short – above breakdown candle; for reversal – below support low.
💡 Risk Management Tips for Options Traders:
✅ Trade near breakout/breakdown zones, avoid chasing after wide moves
✅ Avoid buying deep OTM options in time decay zones (post 1 PM)
✅ Keep risk fixed per trade – e.g., 1%–2% of capital
✅ Use spreads (like bull call spread or bear put spread) when volatility is high
✅ Exit when trade structure invalidates (even before SL hits)
📝 Summary & Conclusion:
🔹 Price is currently reacting around the opening supply zone of 57,086.
🔸 Bulls will need to sustain above 57,405 to push toward the 57,732 – 57,880 zone.
🔻 Bears will gain momentum below 56,740, targeting deeper correction.
🕒 Best trades usually form after 15–30 mins of price stability – avoid rushing entries.
⚠️ Disclaimer:
I am not a SEBI-registered analyst . This analysis is for educational purposes only. Please do your own research or consult a financial advisor before making any trading decisions.
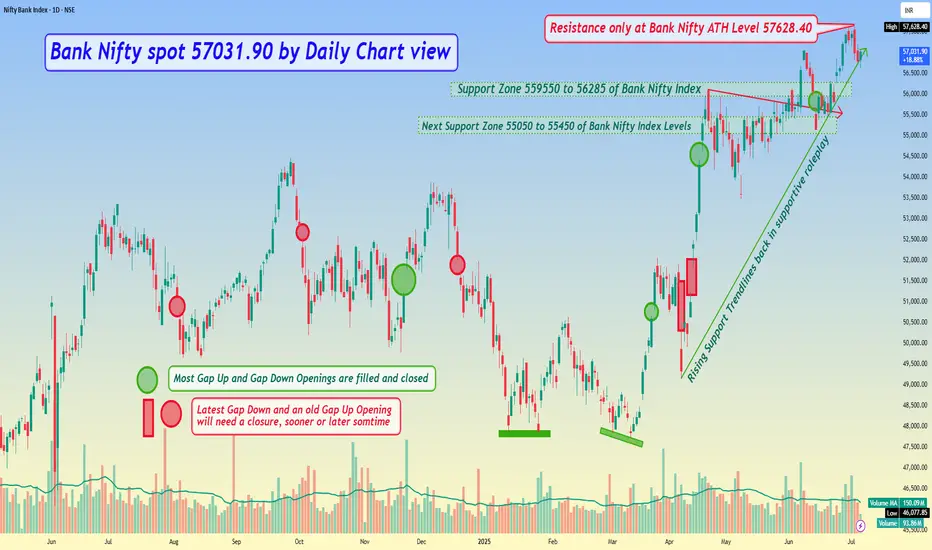
Bank Nifty spot 57031.90 by Daily Chart view - Weekly UpdateBank Nifty spot 57031.90 by Daily Chart view - Weekly Update
- Resistance only at Bank Nifty ATH Level 57628.40
- Support Zone 559550 to 56285 of Bank Nifty Index
- Next Support Zone 55050 to 55450 of Bank Nifty Index Levels
- Bank Nifty Index retraced from New ATH by unwarranted events and usual profit booking
BANKNIFTY – On the Edge of Breakdown📈 BANKNIFTY – On the Edge of Breakdown | Option Chain + Price Action Analysis
🕒 Chart Type: 15-Minute
📆 Date: July 3, 2025
🔍 What’s Catching Our Eye:
BANKNIFTY is sitting dangerously close to the ₹56,770 support zone, which has been tested multiple times. Price action remains weak, and failure to bounce indicates rising pressure on this level.
📌 What We’re Watching For:
We’re closely monitoring the price action near ₹56,770 — a breakdown below this key level could trigger a sharp pick-up in bearish momentum. On the flip side, any meaningful reversal setup will only be considered valid if BANKNIFTY reclaims ₹57,100 with a strong bullish candlestick supported by volume. As of now, the option chain data continues to heavily favor the bears, offering more confirmation than speculation for a potential downside move.
📊 Volume Footprint:
The current volume stands at 149.89M, slightly lower than the previous session’s 162.75M, indicating a mild drop in participation. This suggests that traders are in a wait-and-watch mode. A sharp surge in volume—especially on a move below ₹56,770—could validate a breakdown and trigger momentum on the downside.
📈 Option Chain Highlights:
The 57000 PE is showing a strong long build-up, signaling that traders are positioning for further downside. On the other hand, the 57000 CE has witnessed a heavy short build-up, reinforcing the bearish sentiment. Additionally, lower strike PEs between 56700 and 56900 are also displaying long build-up, further confirming downside pressure. Meanwhile, Call OI is increasing at higher strikes, indicating that resistance is likely forming in the 56900–57200 range.
🔁 Trend Bias:
🔴 Bearish unless we reclaim and sustain above ₹57,100 with confirmation
🧠 Trade Logic / Reasoning:
There is a visible and well-established supply zone between ₹57,400 and ₹57,600, which has consistently capped upside attempts. On the downside, the ₹56,770 support is showing signs of exhaustion due to repeated tests. Derivative data continues to favor the sellers, with strong bearish positioning in the option chain. As there is no visible sign of a reversal yet, it's prudent to remain cautious on taking any premature long positions.
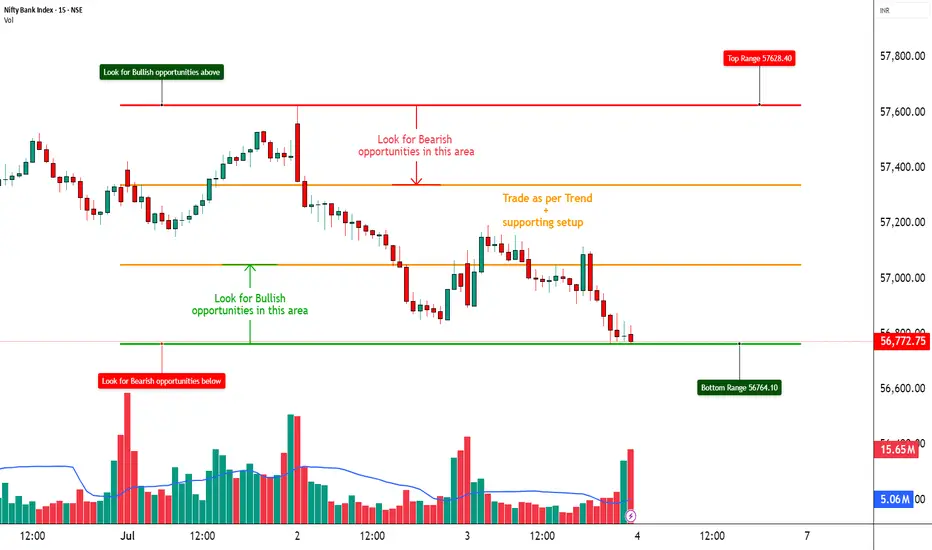
📍 Important Levels to Mark:
🔺 Top Range: 57,600 - Look for breakout or reversal candlestick pattern + volume
🔻 Bottom Range: 56,770 - Watch for breakdown or bullish reversal pattern + volume
🎯 Trade Plan (Educational Purpose Only):
✅ Best Sell: 57000 PE – Long Build-Up present, indicating institutional downside play
✅ Best Buy: 56500 CE – if reversal above 57,100 is confirmed with price action
🟢 Demand Zone: NA
🔴 Supply Zone: NA
⚠️ Invalidation Below:
Any bullish view becomes invalid if BANKNIFTY breaks and holds below 56,750 with high volume
⚠️ Disclaimer:
This post is for educational purposes only.
STWP is not a SEBI-registered advisor.
This is not a buy/sell recommendation.
Please consult your financial advisor before trading.
STWP is not responsible for any trading outcomes.
💬 Found this helpful?
Drop your thoughts in the comments ⬇️
🔁 Share with fellow traders
✅ Follow STWP for zone-based price action & option chain insights
🚀 Let’s boost awareness of smart & patient trading!
Institutional Master class
Option Trading Explained
Options are financial derivatives that provide the right, but not the obligation, to buy or sell an underlying asset at a predetermined price within a specific period.
Types of Options:
Call Option: Right to buy the underlying asset.
Put Option: Right to sell the underlying asset.
Components of an Option Contract:
Strike Price: The agreed price to buy/sell.
Premium: Price paid to acquire the option.
Expiration Date: Date when the option contract ends.
Option Trading Strategies:
Buying Calls/Puts: Simple directional bets.
Covered Call: Holding stock while selling a call option to generate income.
Protective Put: Buying a put option to hedge a long stock position.
Spreads: Combining options to limit risk and cost.

BANKNIFTY : Trading levels and plan for 02-Jul-2025
\ 📊 BANKNIFTY TRADING PLAN – 2-Jul-2025\
📍 \ Previous Close:\ 57,443
📏 \ Gap Opening Consideration:\ ±200 points
🧭 \ Key Zones to Watch:\
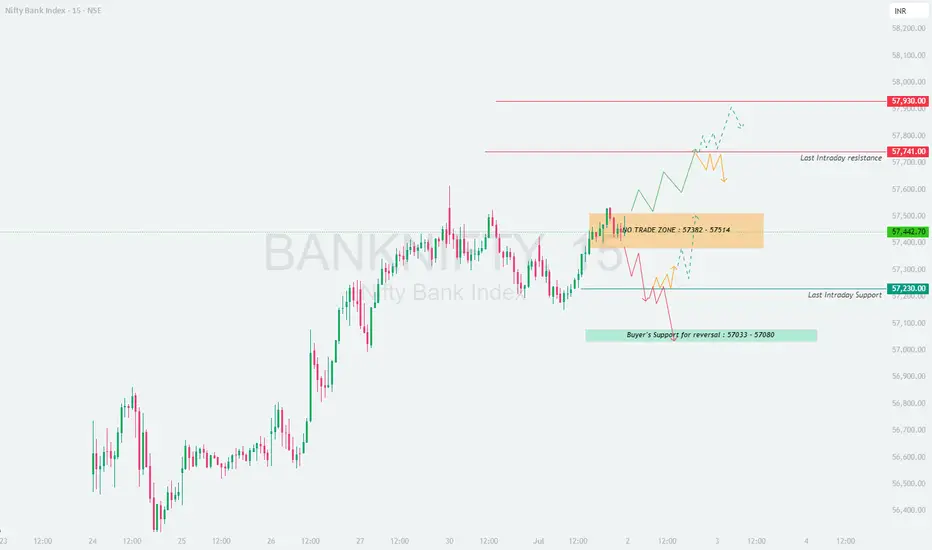
🔸 \ No Trade Zone:\ 57,382 – 57,514
🔺 \ Last Intraday Resistance:\ 57,741
🔻 \ Last Intraday Support:\ 57,230
🟦 \ Buyer’s Support for Reversal:\ 57,033 – 57,080
🟥 \ Sharp Resistance for Profit Booking:\ 57,930
---
\
\ \ 🚀 GAP-UP OPENING (Above 57,741):\
A gap-up above \ 57,741\ breaks the intraday resistance and enters a zone where further upside is likely if momentum sustains. However, the \ profit-booking zone near 57,930\ may act as a supply zone.
✅ \ Plan of Action:\
• If price sustains above 57,741 with volume, initiate long trades targeting 57,930
• Watch for signs of exhaustion near 57,930 — trailing stop-loss or partial booking is advised
• Avoid fresh shorts unless reversal candles appear near 57,930
🎯 \ Trade Setup:\
– \ Buy above:\ 57,741 with SL below 57,690, Target: 57,930
– \ Sell only if reversal spotted at 57,930 with SL above 57,960
📘 \ Tip:\ Use trailing stop-loss once in green zone to protect profits.
\ \ ⚖️ FLAT OPENING (Between 57,382 – 57,514):\
Flat opening near the \ No Trade Zone\ suggests indecisiveness. Let the price move outside this range before taking directional trades.
✅ \ Plan of Action:\
• Avoid trading inside 57,382–57,514; fakeouts are likely
• Wait for a breakout above 57,514 to go long or breakdown below 57,382 to go short
• Keep trades light in early session unless trend is clear
🎯 \ Trade Setup:\
– \ Buy above 57,514], SL: 57,440, Target: 57,741
– \ Sell below 57,382], SL: 57,440, Target: 57,230
📘 \ Tip:\ Flat opens often trap early option buyers. Wait for clean structure before entering.
\ \ 📉 GAP-DOWN OPENING (Below 57,230):\
A gap-down below \ 57,230\ brings the price into critical buyer’s support zone between \ 57,033–57,080\ . Expect sharp reversals or further downside based on price action.
✅ \ Plan of Action:\
• Observe price behavior in 57,033–57,080 zone
• Reversal here offers good R\:R long setups
• Breakdown of this zone may trigger fast decline
🎯 \ Trade Setup:\
– \ Buy near 57,050], SL: 57,000, Target: 57,230 / 57,382
– \ Sell below 57,030], SL: 57,080, Target: 56,880
📘 \ Tip:\ Don’t preempt reversals. Wait for candle confirmation or bullish engulfing near support.
---
\ 📌 SUMMARY & TRADE LEVELS:\
✅ \ Bullish Above:\ 57,514 → 57,741 → 57,930
🔽 \ Bearish Below:\ 57,382 → 57,230 → 57,033
🟧 \ No Trade Zone:\ 57,382–57,514 (stay cautious inside this range)
📍 \ Major Action Zones:\
– 🔺 \ Resistance:\ 57,741 & 57,930
– 🔻 \ Supports:\ 57,230 & 57,033–57,080
---
\ 💡 OPTIONS TRADING RISK MANAGEMENT:\
🛡️ \ Do's:\
• Use hedged strategies like Bull Call Spreads in high IV
• Position sizing should be <2% of capital per trade
• Wait for momentum candles to enter directional trades
🚫 \ Don'ts:\
• Avoid naked option selling in volatile zones
• Never average losers
• Don’t rush entry at opening candle
📘 \ Bonus Tip:\ On flat openings, try neutral strategies like Iron Condors if volatility expected to drop.
---
\ ⚠️ DISCLAIMER:\
I am not a SEBI-registered analyst. The above content is purely for educational and illustrative purposes. Always consult your financial advisor before taking any trade. Trade at your own risk and always use stop-loss to protect your capital.
BANKNIFTY : TRADING LEVELS AND PLAN FOR 01-JUL-2025
\ 📊 BANK NIFTY TRADING PLAN – 1-Jul-2025\
📍 \ Previous Close:\ 57,278
📏 \ Gap Opening Consideration:\ ±200 points
📈 \ Chart Timeframe:\ 15-min
🧭 \ Zones to Watch:\
🔴 Resistance for Sideways/Profit Booking: \ 57,808 – 57,980\
🔺 Last Intraday Resistance: \ 57,494\
🟦 Opening Support/Resistance Zone: \ 57,198 – 57,166\
🟩 Last Intraday Support Zone: \ 56,801 – 56,882\
---
\
\ \ 🚀 GAP-UP OPENING (Above 57,680):\
If Bank Nifty opens above \ 57,680\ , it directly enters the \ Sideways/Profit Booking Zone\ (57,808–57,980). This area has high chances of resistance or reversal due to past selling pressure and overbought signals.
✅ \ Plan of Action:\
• Wait for price confirmation with a 15-min candle close above 57,980
• Consider short trades near the upper range if price gets rejected
• Avoid fresh longs unless breakout above 57,980 sustains with volume
🎯 \ Trade Setup:\
– \ Sell near:\ 57,950 with tight SL above 58,000
– \ Target:\ 57,494 or lower
– \ Buy above breakout zone 58,000 with SL below 57,800
📘 \ Tip:\ After strong gap-ups, wait for consolidation or trap confirmation before acting.
\ \ ⚖️ FLAT OPENING (Between 57,200 – 57,300):\
If the index opens flat, it will trade near the \ Opening Support/Resistance Zone\ of \ 57,198 – 57,166\ . Expect initial indecision. Price action near this zone will guide the day’s trend direction.
✅ \ Plan of Action:\
• Wait for a clear break above 57,494 for bullish confirmation
• If price holds above 57,166 and makes higher lows, look for longs
• Breakdown below 57,166 = short opportunity targeting 56,882
🎯 \ Trade Setup:\
– \ Buy above:\ 57,494 with SL below 57,300
– \ Sell below:\ 57,166 with SL above 57,300
📘 \ Tip:\ Don’t trade within the 57,166–57,494 chop zone unless a breakout confirms.
\ \ 📉 GAP-DOWN OPENING (Below 57,050):\
Gap-downs can attract dip buyers, but only if the \ 56,801 – 56,882\ support zone holds. Below that, the market turns weak again.
✅ \ Plan of Action:\
• Wait for reversal signs (e.g., hammer candle) at the 56,801 zone
• Avoid long trades unless price reclaims 57,166
• A clean break below 56,800 can trigger panic selling
🎯 \ Trade Setup:\
– \ Buy at reversal near:\ 56,801 with SL below 56,700
– \ Sell below breakdown of:\ 56,800 with SL above 56,950
– \ Target:\ 56,500 or trailing based on structure
📘 \ Tip:\ Avoid buying early in a falling market. Let buyers show strength.
---
\ 🧭 IMPORTANT LEVELS FOR 1-Jul-2025:\
🔺 \ Resistance:\ 57,494 / 57,808 – 57,980
🟧 \ Neutral Zone:\ 57,166 – 57,494 (choppy range)
🟩 \ Support Zones:\ 57,166 / 56,882 / 56,801
---
\ 💡 OPTIONS TRADING – RISK MANAGEMENT TIPS:\
✅ Use \ weekly ATM straddles or strangles\ only after a range breakout
✅ Don’t overpay for premiums on gap-ups or IV spikes
✅ Follow the \ 2:1 risk-reward\ rule strictly
✅ Size your trade based on volatility
✅ Consider spreads (like bull put or bear call) to manage risk in premium decay environments
🛑 Avoid selling naked options on event or trending days.
---
\ 📌 SUMMARY – QUICK ACTION RECAP:\
• ✅ \ Bullish above:\ 57,494 → Target 57,808+
• ❌ \ Bearish below:\ 57,166 → Target 56,882 and 56,801
• ⚠️ \ Neutral chop zone:\ 57,166 – 57,494 → Avoid indecisive trades
🎯 \ Top Opportunity Zones:\
– Long breakout trade above 57,494
– Short breakdown trade below 57,166
– Reversal play from 56,801 if support holds
---
\ ⚠️ DISCLAIMER:\
I am not a SEBI-registered analyst. This trading plan is shared purely for educational purposes. Please consult with your financial advisor before taking any trade. Always manage risk with stop-loss and position sizing. Trade responsibly.
