Institutional TradingInstitutional Investment Process
Setting Objectives: Determining risk tolerance, return targets, and time horizons.
Asset Allocation: Dividing the portfolio among different asset classes.
Security Selection: Choosing individual investments.
Portfolio Monitoring: Continuously reviewing performance and risk.
Institutional Trading
Institutional trading refers to the buying and selling of securities in large volumes by institutions.
Types of Institutional Traders
Proprietary Traders: Trade with the institution's own money.
Agency Traders: Execute trades on behalf of clients.
Program Traders: Use algorithms to trade baskets of stocks.
Trading Venues
Exchanges: NYSE, NASDAQ, etc.
Dark Pools: Private exchanges for large orders.
Over-the-Counter (OTC): Direct trading without an exchange.
Bankniftyanalysis

BANK-NIFTY LEVELS FOR INTRADAY (EDUCATIONAL PURPOSE) 01/07/2025🔷 Bank Nifty Intraday Trade Plan – 1 July
📊 Analysis: 15-min TF | Execution: 1-min TF
🔸 GAP-UP Opening (Above 57,400)
📌 Plan: Avoid aggressive buying. Watch for rejection signs near highs
🔁 Entry: Sell if price breaks 5-min low with volume
🛑 SL: 25–30 pts above high
🎯 Target: 57,150 – 57,200
🔹 GAP-DOWN Opening (Below 57,100)
📌 Plan: Avoid panic shorts. Look for strong reversal pattern
🔁 Entry: Buy if 5-min opening high is reclaimed
🛑 SL: 25–30 pts below swing low
🎯 Target: 57,250 – 57,300
⚫ NORMAL Opening (Between 57,100–57,400)
📌 Range Play Setup
🔸 Sell Zone: Near 57,360–400 (resistance zone)
🔹 Buy Zone: Near 57,120–150 (support zone)
🛑 SL: 25–30 pts beyond trigger level
🎯 Target: 40–60 pts
🔺 Breakout Trade Setup
🔁 Entry: Above 57,400 breakout with momentum
🛑 SL: Below breakout bar
🎯 Target: 57,480 – 57,550
📌 Note: Stick to price action. Avoid overtrading. Follow setup rules strictly.
🧠 React to the market, not to your bias

BANKNIFTY : Trading levels and plan for 30-JUN-2025
\ 📊 BANK NIFTY TRADING PLAN – 30-Jun-2025\
📍 \ Previous Close:\ 57,400
📏 \ Gap Reference Threshold:\ ±200 points
🕒 \ Timeframe:\ 15-Min
📈 \ Chart Zones Used:\ No Trade Zone, Support & Resistance areas
---
\
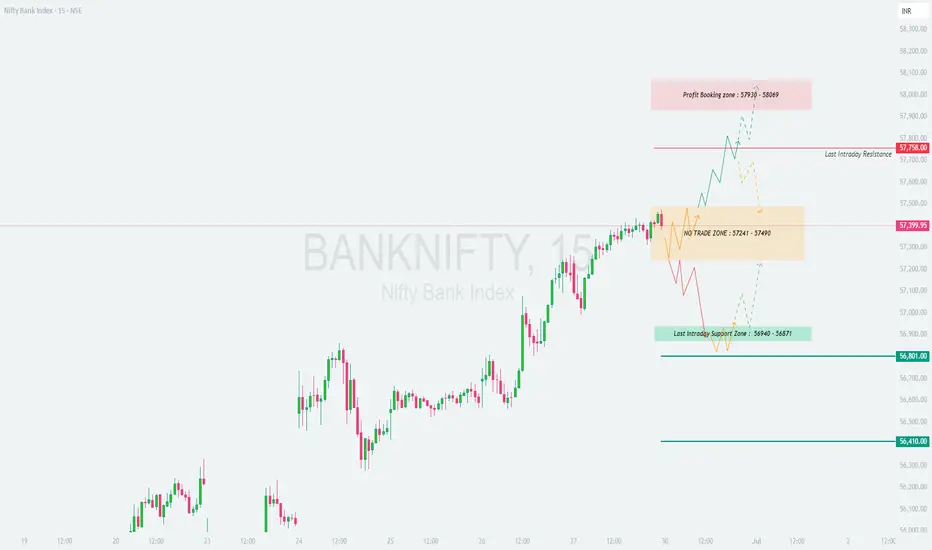
\ \ 🚀 GAP-UP OPENING (Above 57,785):\
If Bank Nifty opens with a gap-up above \ 57,785\ , it will immediately enter the \ Profit Booking Zone (57,930 – 58,069)\ . In this case, traders should be alert for potential exhaustion or consolidation in that zone. Avoid chasing the move unless a breakout is clean with strong follow-through volume.
✅ \ Plan of Action:\
• Wait for price to test 57,930–58,069
• Enter long only if price consolidates and breaks out above 58,069 with good volume
• Watch for profit booking candles or bearish reversal near 58,000 zone
🎯 \ Trade Setup:\
– \ Buy:\ Only above 58,069 (confirmed breakout)
– \ Target:\ 58,300+
– \ SL:\ Below 57,785
📘 \ Tip:\ Opening spikes often trap traders. Wait 15–30 mins before entering a trade after a gap-up.
\ \ ⚖️ FLAT OPENING (Between 57,241 – 57,490):\
This area is defined as a \ No Trade Zone\ due to expected choppy price action. Markets may consolidate or trap both bulls and bears. Best to avoid any directional trades here unless a breakout occurs with conviction.
✅ \ Plan of Action:\
• No trade inside the zone (wait for breakout)
• If price breaks above 57,490 with volume → Long setup
• If price breaks below 57,241 → Short setup initiated
🎯 \ Trade Setup Options:\
– \ Buy:\ Only above 57,490
– \ Sell:\ Only below 57,241
– \ Targets:\ 57,785 (upside), 56,940 (downside)
– \ SL:\ Opposite end of the zone or recent 15-min swing
📘 \ Tip:\ In flat opens, structure develops post 9:30 AM. Be patient and follow only clear breakouts with volume.
\ \ 📉 GAP-DOWN OPENING (Below 56,940):\
A gap-down below \ 56,940\ pushes the market into the \ Last Intraday Support Zone (56,940 – 56,871)\ . If this zone fails to hold, the next major support is at \ 56,410\ . This setup favors sellers but must be executed after observing initial rejection or acceptance of the lower levels.
✅ \ Plan of Action:\
• Short below 56,871 if initial candle confirms breakdown
• If price quickly reclaims 56,940, avoid shorts — it could trap bears
• Watch reversal pattern near 56,410 for potential long
🎯 \ Trade Setup:\
– \ Sell:\ Below 56,871
– \ Target:\ 56,410
– \ SL:\ Above 56,940
📘 \ Tip:\ Don’t rush short trades. Let the price confirm failure of support before initiating.
---
\ 🧩 KEY ZONES TO TRACK:\
🔴 \ Profit Booking:\ 57,930 – 58,069
🔴 \ Last Intraday Resistance:\ 57,785
🟧 \ No Trade Zone:\ 57,241 – 57,490
🟩 \ Last Intraday Support:\ 56,940 – 56,871
🟦 \ Major Support:\ 56,410
---
\ 💡 OPTIONS TRADING TIPS (For Intraday Traders):\
✅ Prefer ATM strikes in high IV zones to avoid time decay
✅ Use spreads (Bull Call / Bear Put) in low volatility conditions
✅ Avoid deep OTM buying on Friday due to Theta erosion
✅ Keep SL fixed: Options can lose value quickly after reversals
✅ Hedge naked options with proper risk-defined trades
✅ Monitor Open Interest buildup around support/resistance levels
---
\ 📌 SUMMARY – STRATEGY AT A GLANCE:\
• ✅ \ Bullish above:\ 57,490 → Potential up move till 57,785 and 58,069
• ⛔️ \ Sideways inside:\ 57,241 – 57,490 → Avoid trades in this zone
• ❌ \ Bearish below:\ 56,871 → Breakdown setup with next support at 56,410
• 🧠 \ Core Idea:\ Let price lead. React, don’t predict blindly.
---
\ ⚠️ DISCLAIMER:\
I am not a SEBI-registered advisor. This analysis is meant purely for educational purposes. Traders are advised to consult their financial advisor and manage risk strictly. Always use stop-loss and proper position sizing.
BANK NIFTY LEVELS FOR INTRADAY ( EDUCATIONAL PURPOSE) 30/06/202
🔷 Bank Nifty Intraday Trade Plan – 30 June
📊 Analysis: 15-min TF | Execution: 1-min TF
🔷 GAP-UP Opening (Above 57,500)
📍 Plan: Avoid chasing price at open. Look for rejection or reversal pattern.
🔁 Entry: Sell on breakdown below 5-min candle low
🛑 SL: 30–40 pts above the swing high
🎯 Target: 57,300–57,350
🔷 GAP-DOWN Opening (Below 57,150)
📍 Plan: Avoid panic selling. Look for reversal candle with confirmation
🔁 Entry: Buy if price reclaims 5-min opening high
🛑 SL: 30–40 pts below swing low
🎯 Target: 57,350–57,450
🔷 NORMAL OPEN (Between 57,150–57,500)
📍 Range Play Setup:
🔁 Sell Zone: Near 57,450–57,500 (resistance zone)
🔁 Buy Zone: Near 57,150–57,200 (support zone)
🛑 SL: 30–40 pts beyond the level
🎯 Target: 50–70 pts
🔺 Breakout Trade Setup
🔁 Entry: Buy above 57,520 breakout candle (with volume)
🛑 SL: Below breakout candle
🎯 Target: 57,600–57,680
📌 Note: All entries based on confirmation in 1-min chart with proper risk management. Avoid impulsive trades.

Nifty Continued to Rise, Bank Nifty Stands Tall at New Highs◉ Nifty Analysis NSE:NIFTY
Indian equity markets broke out of a five-week consolidation last week, powered by easing geopolitical tensions, which helped boost investor sentiment.
A Pole & Flag breakout on the charts signals a continuation of the uptrend, with strong bullish momentum building up.
Open Interest (OI) Snapshot
● 25,000 – Strong Base: Heavy put writing indicates strong support; bulls defending this level aggressively.
● 25,500 – Immediate Support: A secondary cushion with notable put buildup—short-term buyers watching this zone.
● 26,000 – Immediate Resistance Zone: Call writers active here; a breakout above this level could trigger a fresh leg up.
Outlook: The index looks set to maintain a bullish tone, with a possible move toward 26,000 in the coming sessions.
◉ Bank Nifty Analysis NSE:BANKNIFTY
The banking sector continues to lead the market’s strength, acting as a major driver behind the recent rally.
Fundamentally, optimism is being driven by lower funding costs, supported by banks cutting fixed deposit rates and the RBI’s recent cut in the Cash Reserve Ratio (CRR)—both of which have boosted liquidity and improved the outlook for lenders.
The index has confirmed a breakout from a Pole & Flag formation, aligning with Nifty’s bullish setup and further validating strength in the banking space.
Open Interest (OI) Snapshot
● 56,000 – Strong Support Zone: Significant put writing shows strong bullish conviction around this level.
● 57,000 – Immediate Support: Fresh positions being built; dip-buyers may step in here.
● 58,000 – Key Resistance Ahead: Call writers are holding the line—watch for breakout signals.
Outlook: As long as Bank Nifty holds above 57,000, the bullish momentum is expected to continue, with possible testing of 58,000 in the near term.

BANNK-NIFTY LEVELS FOR INTRADAY (EDUCATIONAL PURPOSE) 27/05/2025📊 Bank Nifty Intraday Trading Plan (27th June)
🕐 Chart: 15-min (analysis) | 1-min (execution)
🔍 Trend: Strong breakout above 57100
📈 If Gap-Up Opening above 57200:
✅ Buy on 1-min bullish candle close above 57250
🎯 Target: 57350 / 57420
🛑 SL: 57160
⚠️ Avoid chasing — wait for retest & strength confirmation.
📉 If Gap-Down Opening below 57000:
✅ Sell below 56950 with breakdown confirmation
🎯 Target: 56800 / 56650
🛑 SL: 57060
⚠️ Avoid shorting if 56800 is defended strongly.
💡 Golden Tip:
Use VWAP & Volume on 1-min for entry validation.
No trade = Best trade if there's no clarity.

BANKNIFTY : Trading levels and plan for 27-Jun-2025
\ 📊 BANK NIFTY TRADING PLAN – 27-Jun-2025\
📍 \ Previous Close:\ 57,174
📏 \ Gap Reference:\ ±200 points
🕓 \ Timeframe:\ 15-Min
🎯 \ Focus:\ Structured trading based on volatility zones with breakout/breakdown follow-through setups
---
\
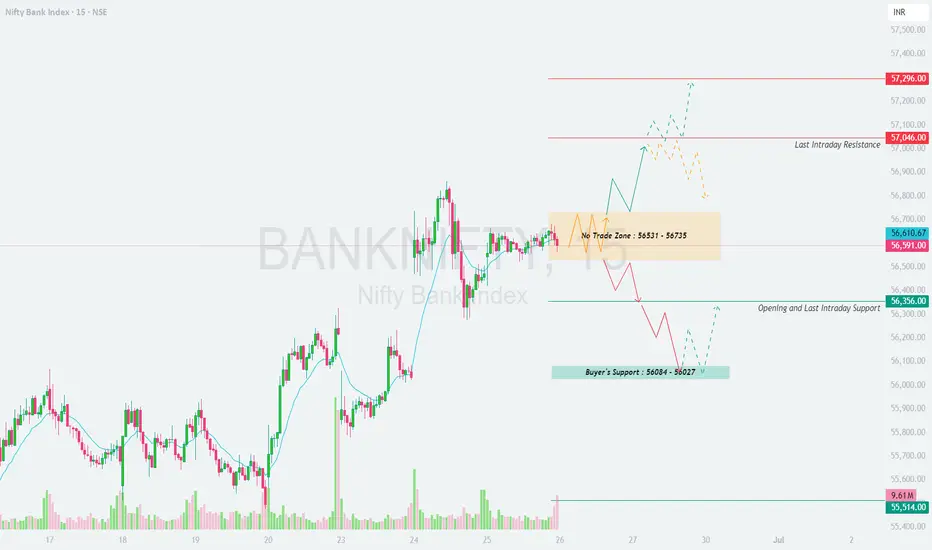
\ \ 🚀 GAP-UP OPENING (Above 57,297):\
If Bank Nifty opens above \ 57,297\ , it will breach the \ Opening Resistance Zone\ and move into the \ Intraday Resistance area (57,513)\ . Momentum-driven traders must stay alert for quick profit-taking near \ 57,700+\ — marked as a \ Sharp Profit Booking Zone\ .
✅ \ Plan of Action:\
• Watch early 5–15 minute candle behaviour
• If strong green candle above 57,297 with follow-through → go long
• Avoid aggressive longs near 57,513 – 57,700 zone unless volume breakout seen
🎯 \ Trade Setup:\
– \ Buy\ above 57,297
– \ Target:\ 57,513 → 57,700
– \ Stop-loss:\ Below 57,180 (spot closing basis)
📘 \ Tip:\ Don't chase the opening spike. Let price stabilize and confirm with retest of 57,297 zone for lower-risk entry.
\ \ ⚖️ FLAT OPENING (Between 57,047 – 57,297):\
Flat opening inside the \ No Trade Zone\ (highlighted range) signals indecision. Price may oscillate between support and resistance — breakout trades only after the range is broken on either side.
✅ \ Plan of Action:\
• If price breaks above 57,297 with strong candle → bullish continuation
• If price breaks below 57,047 → look for quick short setups
• Avoid trading within 57,047–57,297 until clarity emerges
🎯 \ Trade Setup Options:\
– Long: Only above 57,297 with candle close
– Short: Below 57,047 with momentum
– \ Target:\ 57,513 (upside) or 56,822 (downside)
– \ Stop-loss:\ Based on opposite zone breakout
📘 \ Tip:\ Let market show direction post 9:30 AM. Trade with candle confirmation to reduce fake breakout risk.
\ \ 📉 GAP-DOWN OPENING (Below 56,822):\
Gap-downs below \ 56,822\ place Bank Nifty near the \ Last Intraday Support zone\ . If this level is breached, the next watch area is around \ 56,626\ — expect potential bounce or sharp fall from here based on sentiment.
✅ \ Plan of Action:\
• If first candle sustains below 56,822 → short on pullback
• Avoid longs until 56,822 is reclaimed
• Watch price action closely near 56,626 for buyer reaction
🎯 \ Trade Setup:\
– \ Sell\ below 56,822
– \ Target:\ 56,626
– \ SL:\ Above 56,900 or candle close back inside support
📘 \ Tip:\ Avoid fresh longs in a falling gap-down market. Always wait for signs of reversal before considering bullish trades.
---
\ 📌 KEY ZONES TO WATCH:\
🔴 \ Sharp Profit Booking:\ 57,700
🔴 \ Intraday Resistance:\ 57,513
🟧 \ Opening Resistance:\ 57,297
🟨 \ No Trade Zone:\ 57,297 – 57,047
🟩 \ Opening Support:\ 57,047
🟦 \ Intraday Support:\ 56,822
🟫 \ Deep Support:\ 56,626
---
\ 💡 OPTIONS TRADING TIPS & RISK MANAGEMENT:\
✅ Use \ spread strategies\ like Bull Call or Bear Put to reduce premium decay
✅ Avoid \ buying deep OTM options\ without clear momentum
✅ \ Protect capital:\ Risk max 1.5%–2% per trade
✅ \ Never average losers\ ; re-enter with better structure
✅ \ Exit on time:\ Don’t hold trades beyond trend invalidation — follow candle structure
✅ Keep eye on \ Open Interest buildup\ near key zones
---
\ 🧾 SUMMARY:\
• 🔼 \ Bullish above:\ 57,297 → potential breakout toward 57,513 / 57,700
• ⚠️ \ Sideways inside:\ 57,297 – 57,047 → no trade zone
• 🔽 \ Bearish below:\ 56,822 → fall may extend till 56,626
• 🧠 \ Key Message:\ Let price show the path. React to confirmation, not assumptions.
---
\ ⚠️ DISCLAIMER:\
I am not a SEBI-registered advisor. This trading plan is solely for educational purposes. Please consult your financial advisor before taking any trades. Always use proper risk management, stop-loss, and position sizing strategies.

Institutional Option Trading Part -3Institutional Investment Process
Setting Objectives: Determining risk tolerance, return targets, and time horizons.
Asset Allocation: Dividing the portfolio among different asset classes.
Security Selection: Choosing individual investments.
Portfolio Monitoring: Continuously reviewing performance and risk.
Institutional Trading
Institutional trading refers to the buying and selling of securities in large volumes by institutions.
Types of Institutional Traders
Proprietary Traders: Trade with the institution's own money.
Agency Traders: Execute trades on behalf of clients.
Program Traders: Use algorithms to trade baskets of stocks.
Trading Venues
Exchanges: NYSE, NASDAQ, etc.
Dark Pools: Private exchanges for large orders.
Over-the-Counter (OTC): Direct trading without an exchange.

Institutional Option Trading Part -6Institutional trading and investing significantly differ from retail activities. Institutions trade in large volumes, use complex strategies, and have access to exclusive information and tools. This guide will provide a comprehensive overview of institutional option trading, investing, and general trading practices, detailing their methodologies, tools, and market impacts.
Understanding Institutional Investors
Institutional investors include mutual funds, hedge funds, pension funds, insurance companies, and large banks. These entities manage vast sums of money, often on behalf of others, and possess substantial market influence.
Key Characteristics:
Large Capital Base: Institutions trade in millions or billions.
Market Influence: Their trades can impact prices significantly.
Professional Resources: Access to cutting-edge research, proprietary algorithms, and high-speed trading platforms.

BANK NIFTY Levels For Intraday ( Educational Purpose) 26/06/2025🚨 Bank Nifty Intraday Plan (for 1-Min Traders) – 26th June
🟢 If Gap-Up Opening
✅ Buy above: 56,650
🎯 Target: 56,820 / 56,950
🛑 SL: 56,550
🚫 Avoid trade if no volume or false breakout at high.
🔴 If Gap-Down Opening
✅ Sell below: 56,500
🎯 Target: 56,320 / 56,150
🛑 SL: 56,600
🚫 Avoid short if price recovers above 56,600.
📍 Use 1-min chart with confirmation of 3 candles & volume surge.
BANKNIFTY : Trading Levels and Plan for 26-Jun-2025
\ 📊 BANK NIFTY TRADING PLAN – 26-Jun-2025\
📍 \ Previous Close:\ 56,591
📏 \ Gap Opening Threshold:\ ±200 Points
🕒 \ Chart Reference:\ 15-min Time Frame
📦 \ Volume Snapshot:\ 9.61M (suggesting trader participation)
---
\
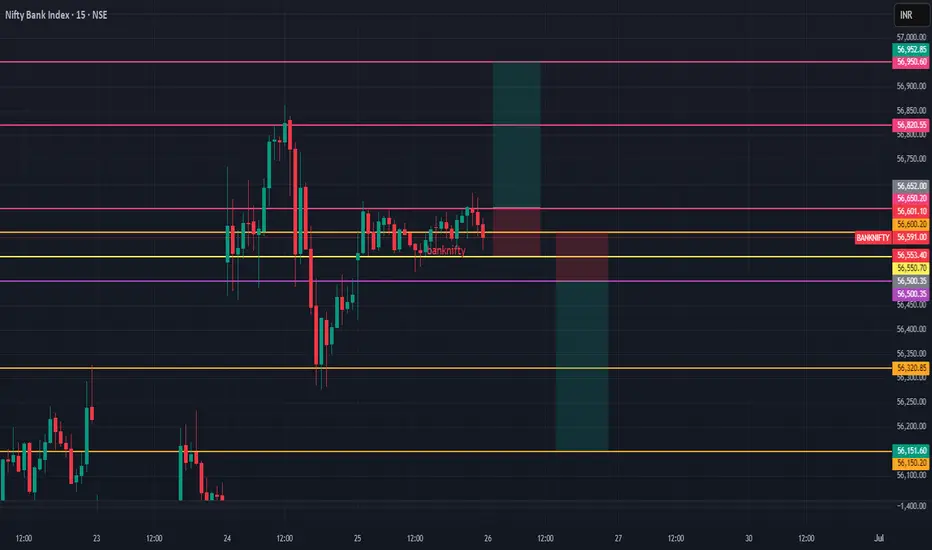
\ \ 🚀 GAP-UP OPENING (Above 56,735):\
If Bank Nifty opens above the \ No Trade Zone (56,531 – 56,735)\ , it may attempt to test the \ Last Intraday Resistance Zone – 57,046\ . A strong push above this level can open up room till \ 57,296\ .
✅ \ Plan of Action:\
• Allow first 15–30 minutes for confirmation
• A breakout and sustained strength above 57,046 can trigger a directional move
• Watch for price action (e.g. rejection wicks) near 57,046 before entering
🎯 \ Trade Setup:\
– Long above 57,046 (on bullish candle close)
– Target: 57,296
– SL: Below 56,735
– Avoid shorts unless price gives rejection confirmation at 57,046–57,296 zone
📘 \ Pro Tip:\ Momentum trades work best here — avoid small SLs due to wide range.
\ \ ⚖️ FLAT OPENING (Within 56,531 – 56,735):\
This is a \ No Trade Zone\ and should be approached with caution. Prices may consolidate or trap early buyers/sellers.
✅ \ Plan of Action:\
• Observe price action for breakout above 56,735 or breakdown below 56,531
• Avoid trading inside the zone — it's prone to fake moves
• Structure your entry after the breakout is confirmed with volume
🎯 \ Trade Setup:\
– Long above 56,735 → Target 57,046
– Short below 56,531 → Target 56,356
– SL: Just above/below the zone boundary
📘 \ Pro Tip:\ If stuck inside this zone, wait. Reacting early leads to poor entries and whipsaws.
\ \ 📉 GAP-DOWN OPENING (Below 56,356):\
Opening below this zone places immediate focus on the \ Buyer’s Support Zone (56,084 – 56,027)\ . If this level holds, a bounce could be expected, else 55,514 may come into play.
✅ \ Plan of Action:\
• If a bullish candle forms near 56,027–56,084, go long for reversal scalps
• Breakdown below 56,027 = potential strong sell-off
• Avoid trying to bottom fish unless reversal is evident with volume spike
🎯 \ Trade Setup:\
– Long: Only on reversal from 56,027 with SL below zone
– Short: Below 56,027 with confirmation
– Target: 55,514
– SL: 50–60 pts based on volatility
📘 \ Pro Tip:\ Buyer zones often lead to sharp reversal moves — play small and safe until confirmed.
---
\ 💡 RISK MANAGEMENT & OPTIONS TRADING TIPS:\
✅ Use \ Spread Strategies\ when IV is high — e.g., Bear Put Spread
✅ Avoid buying options inside \ No Trade Zone\ due to theta decay
✅ Strict \ 15-min candle close SL\ to validate exits
✅ Never risk more than \ 2% of your capital\ on a single trade
✅ Size options position based on premium — not lot count alone
---
\ 📌 KEY LEVELS TO WATCH:\
🟧 \ No Trade Zone:\ 56,531 – 56,735
🟥 \ Last Intraday Resistance:\ 57,046
🔺 \ Profit Booking Resistance:\ 57,296
🟩 \ Opening Support:\ 56,356
🟦 \ Buyers Support Zone:\ 56,084 – 56,027
🟥 \ Breakdown Support:\ 55,514
---
\ 🎯 SUMMARY – GAME PLAN FOR THE DAY:\
• 🔼 \ Bullish Above:\ 56,735 → Watch 57,046
• ⏸️ \ Avoid Inside Zone:\ 56,531 – 56,735
• 🔽 \ Bearish Below:\ 56,356 → Target Buyer’s Zone
• ⚠️ \ Breakdown Below:\ 56,027 = Trend Reversal Risk
---
\ ⚠️ DISCLAIMER:\
I am not a SEBI-registered advisor. This content is purely for educational purposes. Please consult a qualified financial advisor before acting on any trades. Use strict stop-loss and trade management techniques at all times.
Learn Institutional Trading Pros and Cons
Pros: Early signals, useful for reversals.
Cons: Requires confirmation, may produce false signals.
Technical Trading
What is Technical Trading?
Technical trading focuses on using historical price data, volume, and technical indicators to predict future price movements. Traders use charts and patterns instead of company fundamentals.
Key Tools in Technical Trading
Price Charts: Candlestick, line, bar charts.
Indicators: Moving averages, RSI, MACD, Bollinger Bands.
Chart Patterns: Head and Shoulders, Triangles, Double Tops, Flags.
Support and Resistance Levels: Key price points where stocks reverse.

Why People Trade OptionsKey Components of Options
Strike Price: The pre-agreed price at which the option can be exercised.
Premium: The price you pay to buy the option contract.
Expiration Date: The date until which the option is valid.
Why People Trade Options
Leverage: Small investment, potential for large returns.
Hedging: Protects portfolio from losses.
Speculation: Betting on price movements.
Example
If a stock is currently priced at ₹500, you can buy a call option with a strike price of ₹550, expiring in one month, by paying a premium of ₹5. If the stock price rises to ₹600, you can buy at ₹550 and immediately sell at ₹600, making a profit.

Learn Institutional Trading Part-2What is Investing?
Investing involves committing your money to various assets like stocks, mutual funds, gold, real estate, or bonds to grow your wealth over time. Investing is generally a long-term strategy, focusing on the gradual accumulation of wealth.
Key Types of Investments
Stock Market Investments: Buying shares of companies.
Mutual Funds: Pooling money with other investors.
Bonds: Lending money to companies or governments for interest.
Gold & Real Estate: Physical assets that typically grow over time.
Investment Strategies
Value Investing: Buying undervalued stocks.
Growth Investing: Investing in companies with high growth potential.
Dividend Investing: Investing in companies that pay regular dividends.
Benefits of Investing
Builds wealth over time.
Helps fight inflation.
Provides financial security.

BANKNIFTY levels for Intraday ( Educational Purpose ) 25/06/2025🚨 Bank Nifty Intraday Plan – 25/06/2025
⏱️ Based on 15-min chart | Executed on 1-min
🔼 Buy Above: 56,510
🎯 Target: 56,650 / 56,750
🛑 SL: 56,440
🔽 Sell Below: 56,300
🎯 Target: 56,160 / 56,020
🛑 SL: 56,370
📉 Gap-Up Opening:
🔹 Wait for price rejection near 56,650–56,750
🔹 Avoid chasing highs — confirm 5-min candle reversal
📈 Gap-Down Opening:
🔹 Look for base near 56,160–56,100
🔹 Buy only if strong bounce on volume seen
📌 Note:
✅ Use 1-min candle confirmation for entry
❌ Don’t enter blindly on open
🧠 Stick to 1:2 RR | Strict SL Discipline
Banknifty : Trading Plan and levels for 25-Jun-2026
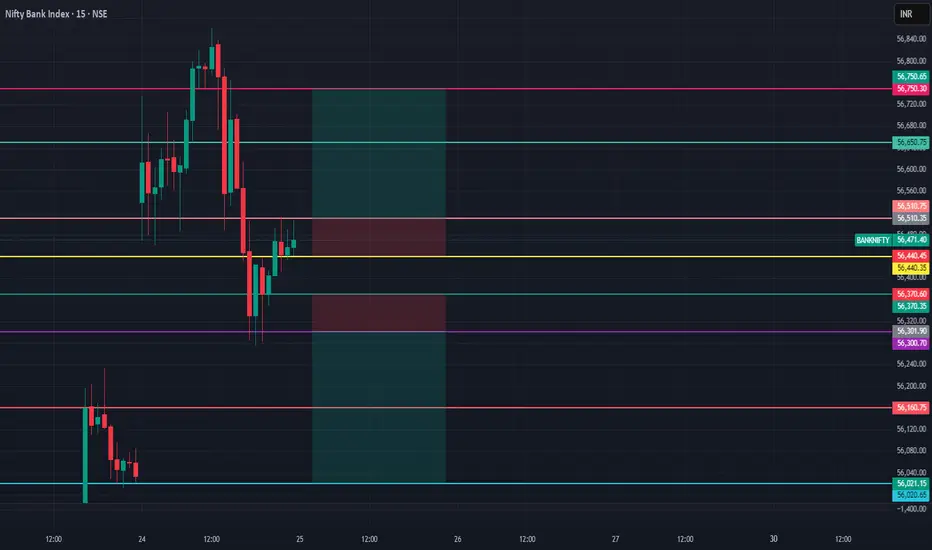
\ 📊 BANKNIFTY TRADING PLAN – 25-Jun-2025\
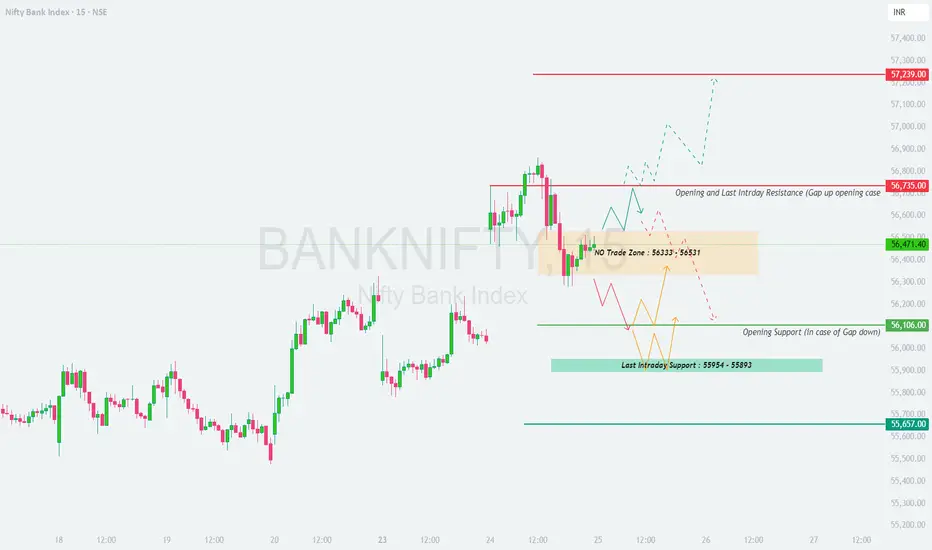
📍 \ Previous Close:\ 56,471.40
📏 \ Gap Threshold Considered:\ 200+ points
📉 \ Chart Basis:\ 15-min Timeframe
📌 \ Volume Watch:\ 11M (important for confirmation near key levels)
---
\
\ \ 🚀 GAP-UP OPENING (Above 56,735):\
If BankNifty opens above \ 56,735\ , it enters the prior \ Last Intraday Resistance and Opening Resistance Zone\ , which could act as a potential supply area. A further move toward \ 57,239\ (upper target) is possible only on sustained momentum.
✅ \ Plan of Action:\
• Let the price stabilize for 15–30 minutes.
• A breakout above 56,735 with volume can attract follow-up buying.
• However, any hesitation near this zone may trigger intraday profit booking.
🎯 \ Trade Setup:\
– Long above 56,735 (only if candle sustains with strength)
– Target: 56,900 / 57,239
– SL: 56,550
– Short opportunity arises if price reverses from 56,735 zone with bearish wick
📘 \ Pro Tip:\ Use trailing SL when riding bullish momentum post-gap-up.
\ \ ⚖️ FLAT OPENING (Between 56,333 – 56,531):\
This zone is marked as a \ No Trade / Decision Zone\ . The market might consolidate here before a decisive move either way.
✅ \ Plan of Action:\
• Avoid early trades in this choppy zone.
• Watch for breakout above 56,531 = bullish signal
• Breakdown below 56,333 = early weakness
🎯 \ Trade Setup:\
– Long above 56,531
– Short below 56,333
– SL: 40–60 pts depending on volatility
– Prefer breakout + retest pattern
📘 \ Pro Tip:\ Patience pays here — don't get trapped in false moves inside the range.
\ \ 📉 GAP-DOWN OPENING (Below 56,106):\
A gap-down below \ 56,106 (Opening Support)\ will shift the focus to the \ Last Intraday Support Zone – 55,954 to 55,893\ . If these supports fail, deeper correction may follow toward \ 55,657\ .
✅ \ Plan of Action:\
• Watch reaction at 55,954–55,893
• If price bounces here with volume, expect a quick intraday reversal trade
• A breakdown here confirms bearish grip toward 55,657
🎯 \ Trade Setup:\
– Short below 55,893 with confirmation
– Target: 55,657
– SL: 56,050
– Long only if strong bullish reversal candle forms in green zone
📘 \ Pro Tip:\ Avoid knife-catching. Let the support prove itself before going long.
---
\ 💼 OPTIONS RISK MANAGEMENT TIPS:\
✅ \ 1. Avoid buying options blindly on gap opens—wait for confirmation\
✅ \ 2. Use spreads in consolidation zones to minimize theta loss\
✅ \ 3. Track volume + price together; high IV = better premium opportunity\
✅ \ 4. Never risk more than 2% of capital in a single trade\
✅ \ 5. For index options, always define SL by candle close (15-min preferred)\
---
\ 📌 SUMMARY – KEY LEVELS TO WATCH:\
🔴 \ Major Resistance:\ 57,239
🟥 \ Opening & Intraday Resistance:\ 56,735
🟧 \ No Trade Zone:\ 56,333 – 56,531
🟩 \ Opening Support:\ 56,106
🟦 \ Intraday Support Zone:\ 55,954 – 55,893
🟫 \ Major Breakdown Level:\ 55,657
---
\ 🧭 CONCLUSION:\
• 🔼 \ Above 56,735:\ Bullish if sustains — target 57,239
• ⏸ \ Between 56,333–56,531:\ Avoid trading until breakout/breakdown
• 🔽 \ Below 56,106:\ Weak bias — eyes on supports at 55,954 and 55,657
Stick to process, not prediction. Observe structure, manage risk, and stay adaptable. 🎯📊💼
---
\ ⚠️ DISCLAIMER:\
I am not a SEBI-registered analyst. This trading plan is shared for educational purposes only. Please consult your financial advisor before making any trading decisions. Always use strict risk management and stay disciplined. 📉📚🛡️
Banknifty Levels for Intraday ( Educational Purpose) 24/06/2025📈 BANKNIFTY Intraday Levels
🟢 Opening: 56,529.45
📊 Trend Bias: Bullish momentum, watch for resistance near swing highs
🔼 Buy Above: 56,600
🎯 Targets: 56,750 / 56,880
🛑 SL: 56,420
🔽 Sell Below: 56,350
🎯 Targets: 56,180 / 56,000
🛑 SL: 56,500
BANKNIFTY : TRADING LEVELS AND PLAN FOR 24-JUN-2025
\ 🏦 BANKNIFTY TRADING PLAN – 24-Jun-2025\
📍 \ Previous Close:\ 56,034.55
📏 \ Gap Definition:\ 200+ points
📊 \ Chart Timeframe:\ 15-min
---
\
\ \ 🚀 GAP-UP OPENING (Above 56,210):\
If BankNifty opens above the \ Opening Resistance – 56,210\ , it enters a crucial intraday resistance zone between \ 56,394 – 56,476\ , marked as a potential \ Consolidation Zone\ .
✅ \ Plan of Action:\
• Allow 15–30 minutes for price to settle.
• If it sustains above 56,394, buyers can push it toward 56,689+.
• If reversal signs appear in the zone, expect selling pressure to pull it back below 56,210.
🎯 \ Trade Setup:\
– Buy on breakout + sustain above 56,476
– Target: 56,689
– SL: 56,150
– Or short near 56,476 if reversal candle forms
📘 \ Pro Tip:\ Avoid chasing moves directly on open—wait for structure to form.
\ \ 📘 FLAT OPENING (Between 55,874 – 56,210):\
This is the volatile range, where \ 55,874\ acts as an intraday pivot (support/resistance flip zone).
✅ \ Plan of Action:\
• Avoid trading in the first 15 mins—likely sideways movement.
• Break above 56,210 = bullish momentum
• Break below 55,874 = weak structure, may test lower support
🎯 \ Trade Setup:\
– Buy above 56,210 with confirmation
– Sell below 55,874 only if retested & failed
– SL: 50–75 pts depending on volatility
📘 \ Pro Tip:\ Focus more on retest trades here instead of breakout chases.
\ \ 📉 GAP-DOWN OPENING (Below 55,874):\
A gap-down below \ Opening Support/Resistance 55,874\ could trigger a sell-off toward \ Last Intraday Support at 55,544\ and potentially deeper into the green zone – \ Buyer’s Support for Consolidation: 55,081 – 55,241\ .
✅ \ Plan of Action:\
• Observe price action near 55,544
• A bounce from there can give quick intraday long scalp
• Breakdown below 55,544 = strong selling toward 55,081
🎯 \ Trade Setup:\
– Short below 55,544 with confirmation
– Target: 55,300 / 55,150
– SL: 55,600
– Consider long only if strong reversal at 55,081–55,241 zone
📘 \ Pro Tip:\ In gap-downs, don't average losers—wait for clear reversal.
---
\ 💼 OPTIONS RISK MANAGEMENT TIPS:\
✅ \ 1. Always wait for a directional bias before entering options\
✅ \ 2. Avoid buying OTM options in low IV conditions (choose ATM/ITM)\
✅ \ 3. Use spreads in consolidation zones to limit theta decay\
✅ \ 4. Trade with defined SL based on 15-min closing candle\
✅ \ 5. Don't overtrade – clarity matters more than quantity\
---
\ 📌 SUMMARY – KEY LEVELS TO WATCH:\
🔴 \ Major Resistance:\ 56,689
🟥 \ Intraday Resistance / Consolidation Zone:\ 56,394 – 56,476
🟧 \ Opening Resistance:\ 56,210
🟨 \ Opening Support/Resistance Flip:\ 55,874
🟩 \ Last Intraday Support:\ 55,544
🟦 \ Buyer's Demand Zone:\ 55,081 – 55,241
---
\ 📚 CONCLUSION:\
• 🔼 \ Above 56,210:\ Watch for resistance at 56,394–56,476; breakout = bullish
• ⏸ \ Between 55,874 – 56,210:\ Volatile range; play retest setups
• 🔽 \ Below 55,874:\ Weak bias; eyes on support 55,544 → 55,081 zone
Stick to the plan. Observe before you react. Clarity and confirmation > prediction and emotion. 🧠💼📉
---
\ ⚠️ DISCLAIMER:\
I am not a SEBI-registered analyst. This analysis is intended purely for educational purposes. Please consult your financial advisor before taking any positions. Always trade with a proper risk management plan. 📊🛡️

Learn Institutional Option Trading Part-5Stock Market Investing:
Stock investing involves buying shares of publicly traded companies listed on NSE or BSE.
Why Indians Invest in Stocks:
Potential for higher returns.
Dividend income.
Portfolio diversification.
Approaches to Investing:
Fundamental Analysis: Based on financial health, growth potential, and management quality.
Technical Analysis: Based on price patterns, volumes, and charts.
Long-Term Investing: Holding stocks for years to build wealth.
Short-Term Trading: Buying and selling stocks within days or weeks.

Learn Institutional Option Trading Part-4Recent Growth of Options in India:
Retail participation has surged.
Weekly expiry options (especially on Bank Nifty) have become extremely popular.
SEBI introduced lot size and margin regulations to control excessive speculation.
Investing in India
What is Investing?
Investing means allocating money into assets like stocks, mutual funds, bonds, gold, or real estate to earn returns over time.
Major Investment Options in India:
Equities (Shares)
Mutual Funds
Fixed Deposits
Public Provident Fund (PPF)
Gold (Physical and Digital)
Real Estate
Bonds and Debentures

Learn Institutional Option Trading Part-2Option Greeks in India:
Delta: Measures sensitivity to price changes.
Theta: Measures time decay.
Vega: Measures sensitivity to volatility.
Gamma: Measures change in Delta.
Indian traders use these Greeks to manage risk and optimize strategies.
Risks in Indian Option Trading:
Premium Decay: Loss in value as expiry approaches.
High Volatility: Can cause sudden losses.
Liquidity Risk: Some options have low trading volume.
Complexity: Requires deep market knowledge.

Learn Institutional Option Trading Part-10Popular Option Strategies in India:
Buying Call Options: Profit when the market rises.
Buying Put Options: Profit when the market falls.
Covered Call: Holding a stock and selling a call option to earn premiums.
Protective Put: Buying a put option to safeguard stock holdings.
Iron Condor: Earning from a range-bound market using multiple options.
Straddle and Strangle: Benefiting from high volatility.

Learn Institutional Option Trading Part-3In India, options are traded primarily on:
NSE (National Stock Exchange)
BSE (Bombay Stock Exchange)
The Securities and Exchange Board of India (SEBI) regulates the derivatives market and ensures fair practices.
Why is Option Trading Popular in India?
Leverage: Traders can control large positions with small capital.
Hedging: Investors use options to protect their portfolios from market fluctuations.
Income Generation: Strategies like covered calls can provide regular income.
Speculation: Traders can bet on price movements with limited risk.
