Institutions Option Database Trading Part-5 Risk Management in Option Trading
Even with data, risk control is key:
Max 2% capital risk per trade.
Hedge with opposite option.
Avoid low liquidity options.
Always track IV, PCR, OI live.
Building a Custom Option Scanner
With databases and logic, you can create a personal scanner for:
High IV options
OI breakout zones
PCR + Max Pain alert
Theta-rich expiry trades
Bankniftyanalysis

Institutions Option Database Trading Part-6Deep Dive into Options Basics (For Data Traders)
Options are contracts giving the right but not the obligation to buy or sell an asset at a certain price before a set date. They are used for hedging, speculation, and generating income.
🛠️ Two Types:
Call Option: Right to buy an asset.
Put Option: Right to sell an asset.
Backtesting means testing a strategy using past data to check performance. Key for data-driven option trading.
Example:
Load 1-year option chain data for BANKNIFTY.
Apply rules: Buy Call when IV drops by 10% & PCR < 0.8.
Check PnL for each trade.
Filter for success rate > 65%.

Institutions Option Database TradingDatabase Option Trading is a powerful blend of market logic and data science. With structured data, intelligent scanning, and strategic execution, traders gain a massive edge over emotional/manual decisions. This approach is ideal for traders aiming for consistent performance, lower drawdowns, and systematic growth. The more you code, automate, and analyze—the better you trade.
Sample Strategy - PCR + OI Spike
Strategy Logic:
If PCR > 1.3 and Call OI Spike at ATM > 15%, initiate a Put Sell.
Exit when PCR drops below 1.1 or OI unwinds.
Backtest Results (NIFTY Options):
Win Rate: 72%
Avg Profit per Trade: ₹4800
Max Drawdown: ₹9800

Long Term Database TradingHow Institutions Use Option Databases
🔍 Institutional Insights:
Banks & HFTs (High-Frequency Traders) run option strategies over petabytes of data.
Real-time arbitrage opportunities are found using option databases.
They model Vega, Theta & IV impact per stock and expiry.
Example Institutional Workflow:
Pull 10 years of NIFTY options.
Train ML model to predict next-day IV.
Execute based on high-probability straddles/strangles.
Exit before expiry using trailing delta hedge.

BANKNIFTY : Trading levels and plan for 20-Jun-2025
\ 📊 BANK NIFTY TRADING PLAN – 20-Jun-2025\
📍 \ Previous Close:\ 55,497.05
📏 \ Gap Opening Threshold:\ 200+ points
🕰 \ Chart Timeframe:\ 15-min
---
\
\ \ 🚀 GAP-UP OPENING (Above 55,694):\
If Bank Nifty opens above 55,694 with a 200+ points gap-up, the index may trigger a breakout attempt.
✅ \ Plan of Action:\
• Watch for sustained move above \ Opening Resistance (55,694)\
• First resistance lies in the \ Last Intraday Resistance zone (56,049–55,991)\
• A breakout above 56,049 can fuel momentum toward \ 56,274\
• In case of rejection from resistance zone, be ready for intraday pullback to 55,694 or even 55,497
• Ideal entries:
– Long above 56,049 after 15–30 min consolidation
– SL for longs: Below 55,850
– Exit zone: Trail to 56,274 or book near swing highs
📘 \ Tip:\ Avoid aggressive buying immediately on gap-ups — instead, wait for candle confirmation and continuation above resistance.
\ \ 🔁 FLAT OPENING (Between 55,497 – 55,694):\
Flat opens within this range indicate indecision and may lead to a breakout or breakdown depending on volume.
✅ \ Plan of Action:\
• Wait for first 15-min range breakout
• \ Bullish case:\ Break above 55,694 → Target 56,049–56,274
• \ Bearish case:\ Break below 55,497 → Sell toward 55,123
• Avoid trades inside \ 55479 – 55528\ (Opening Support) unless clear trend develops
• SLs must be strictly based on candle closing outside the zones
📘 \ Tip:\ Flat openings are high-reward only when you play post-breakout moves. Wait for structure → trade with momentum.
\ \ 📉 GAP-DOWN OPENING (Below 55,123):\
Gap-downs offer opportunity for short trades and potential bounces near key support levels.
✅ \ Plan of Action:\
• Below 55,123, bearish sentiment strengthens.
• Next level to watch: \ 54,849 (Support zone)\
• If 54,849 breaks decisively, expect further downside, else consolidation likely
• Ideal trades:
– Short below 55,123 with SL above 55,200
– Long only if strong bullish reversal seen from 54,849
• Risk increases if price whipsaws around 55,123 — trade lighter or avoid overtrading
📘 \ Tip:\ In gap-down cases, avoid panic shorts. Look for breakdown candles with volume for confidence.
---
\ 🛡 RISK MANAGEMENT & OPTIONS TRADING TIPS:\
✅ \ 1. Avoid trading first 5-min candles — observe initial volatility\
✅ \ 2. Use defined SL based on structure (like 15-min close below level)\
✅ \ 3. Avoid buying deep OTM options in sideways zones — theta decay eats premiums\
✅ \ 4. Use spreads like Bear Call / Bull Put when IV is high or movement is limited\
✅ \ 5. Always trail stop-loss once trade is in profit zone\
---
\ 📌 SUMMARY – KEY LEVELS FOR 19-Jun-2025:\
• 🟩 \ Buyer’s Support Zone:\ 54,849 – key reversal area
• 🟦 \ Opening Support:\ 55479 – 55428
• 🟥 \ Opening Resistance:\ 55,694
• 🟧 \ Last Intraday Resistance:\ 55,991 – 56,049
• 🚩 \ Breakout Level:\ 56,274
💡 \ Above 56,049 = Buy strength | Below 55,123 = Sell weakness\
---
\ 📢 DISCLAIMER:\ I am not a SEBI-registered analyst. This trading plan is shared for educational purposes only. Please consult your financial advisor before making any trade decisions based on this content.
BANKNIFTY : Trading plan and levels for 21-JUN-2025
\ 📊 BANK NIFTY TRADING PLAN – 21-Jun-2025\
📍 \ Previous Close:\ 56,216.50
📏 \ Gap Opening Threshold:\ 200+ points
🕒 \ Timeframe:\ 15-minute chart (price action-based planning)
---
\
\ \ 🚀 GAP-UP OPENING (Above 56,664):\
If Bank Nifty opens above 56,664, it will be entering fresh bullish territory. This level marks the **breakout zone**, and caution is needed for confirmation trades.
✅ \ Plan of Action:\
• Monitor price action for 15–30 minutes.
• If price sustains above 56,664, the index may show follow-through up-move.
• Potential upside targets: \ 56,800 – 56,950\ range.
• However, if the index gets rejected from 56,664 with selling pressure, watch for a pullback toward the **NO TRADE ZONE (56,261–56,109)**.
🎯 \ Trade Setup:\
– Long only if 15-min candle closes above 56,664
– Stop-loss: below 56,500
– Target: 56,800 and trail higher
📘 \ Tip:\ Don’t buy aggressively at open. Let the breakout be confirmed with volume. Gaps often retrace if broader market doesn't support.
\ \ 📘 FLAT OPENING (Between 56,044 – 56,261):\
This is the **NO TRADE ZONE** where indecision is high. Price can whipsaw both sides and create traps.
✅ \ Plan of Action:\
• Stay patient in first 15 minutes — let price choose direction.
• \ Bullish Setup:\ Buy only if price sustains above 56,261 and shows strength toward 56,664
• \ Bearish Setup:\ Sell if price breaks below 56,044 with a convincing close
• Avoid random trades inside 56,109–56,261 zone
🎯 \ Trade Setup:\
– Long > 56,261 or Short < 56,044
– Use tight SLs and quick profit-booking in such zones
📘 \ Tip:\ Range trades can fail here. Let levels break before initiating positions.
\ \ 📉 GAP-DOWN OPENING (Below 55,889):\
If the index opens below the previous support of 55,889, expect weakness to prevail.
✅ \ Plan of Action:\
• Immediate support lies at \ 55,652\ . A bounce may be seen from this level.
• Breakdown below 55,652 can lead to 55,400–55,250 zones
• Watch for reversal candles if testing support, else shorting opportunities emerge
🎯 \ Trade Setup:\
– Sell below 55,652 with SL above 55,800
– Only go long if price sharply reverses from 55,652 with volume
📘 \ Tip:\ Gaps to the downside are usually accompanied by panic. Don’t chase trades, wait for structure to develop.
---
\ 🛡 RISK MANAGEMENT & OPTIONS TRADING TIPS:\
✅ \ 1. Avoid first 5-min trades – let volatility settle\
✅ \ 2. Prefer ATM or slightly ITM options to avoid high theta decay\
✅ \ 3. Don’t over-leverage after gap opens – premiums are inflated\
✅ \ 4. Use trailing SL once in profit – lock gains smartly\
✅ \ 5. Avoid blind straddles in NO TRADE ZONES – wait for directional clarity\
---
\ 📌 SUMMARY – LEVELS TO WATCH FOR 21-Jun-2025:\
• 🟠 \ NO TRADE ZONE:\ 56,109 – 56,261
• 🟥 \ Breakout Resistance:\ 56,664
• 🟩 \ Opening Support:\ 56,044
• 🟦 \ Last Intraday Support:\ 55,889
• 🔻 \ Support for Breakdown:\ 55,652
💡 \ Strategy Recap:\
• 🔼 Above 56,664 = Bullish
• ⏸ Inside 56,109–56,261 = Wait & watch
• 🔽 Below 55,889 = Caution for shorts
---
\ 📢 DISCLAIMER:\
I am not a SEBI-registered analyst. This plan is shared for educational purposes only. Please consult your financial advisor before making trading decisions. Trade responsibly. 💹

Nifty Bank Intraday levels(For Education Purpose)20.05.2025📉 Bearish (Sell) Setup:
Sell Below: ₹55,480 (confirmed breakdown)
Targets:
🎯 Target 1: ₹55,400
🎯 Target 2: ₹55,300
🎯 Target 3: ₹55,180 (if heavy selling continues)
Stop Loss: ₹55,580 (or ₹55,600 for conservative SL)
///📈 Bullish (Buy) Setup – Only if Reversal Happens:
Buy Above: ₹55,600 (strong reversal with volume & green candles)
Targets:
🎯 Target 1: ₹55,700
🎯 Target 2: ₹55,800
🎯 Target 3: ₹55,900
Stop Loss: ₹55,480

Support and Resistance ExplainedWhat is Support?
Support is a price level where a stock tends to stop falling due to increased buying interest. Traders view it as a demand zone where bulls often enter the market.
Example: If Reliance repeatedly bounces from ₹2,700, that level is acting as support.
🔹 What is Resistance?
Resistance is a level where a stock tends to stop rising due to selling pressure. It's a supply zone where bears usually take control.
Example: If Nifty keeps failing to cross 23,500, it's a resistance level.
🔹 Why They Matter:
Help in identifying entry and exit points
Show where trend reversals may occur
Aid in setting stop-loss and targets
🔹 How to Spot Them:
Look for price bounces or rejections
Use tools: horizontal lines, moving averages, Fibonacci retracements
Confirm with volume spikes
🔹 Key Strategy:
Buy near support (low risk)
Sell near resistance (high probability)
Trade breakouts or reversals with confirmation

Advanced Institutions Option Trading - Part 6 Volatility Tools in Options
Understanding volatility is central to success in option trading:
🌀 Types of Volatility:
Historical Volatility (HV): Based on past prices
Implied Volatility (IV): Market’s expectation of future movement
📊 Volatility-Based Strategies:
High IV: Sell premium – strategies like Iron Condor, Credit Spreads
Low IV: Buy premium – strategies like Long Straddle, Long Call/Put
Tools like IV Rank and IV Percentile help traders choose the right strategy based on volatility regime.

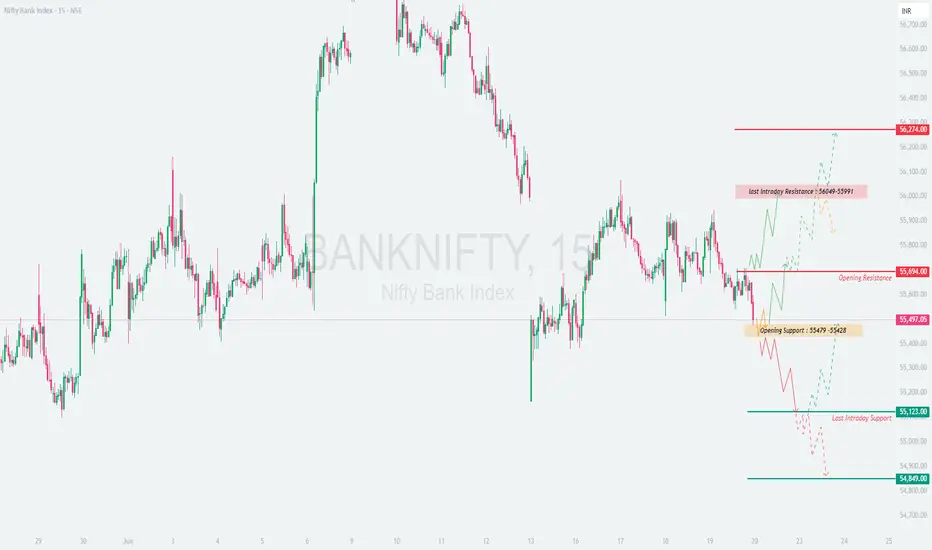
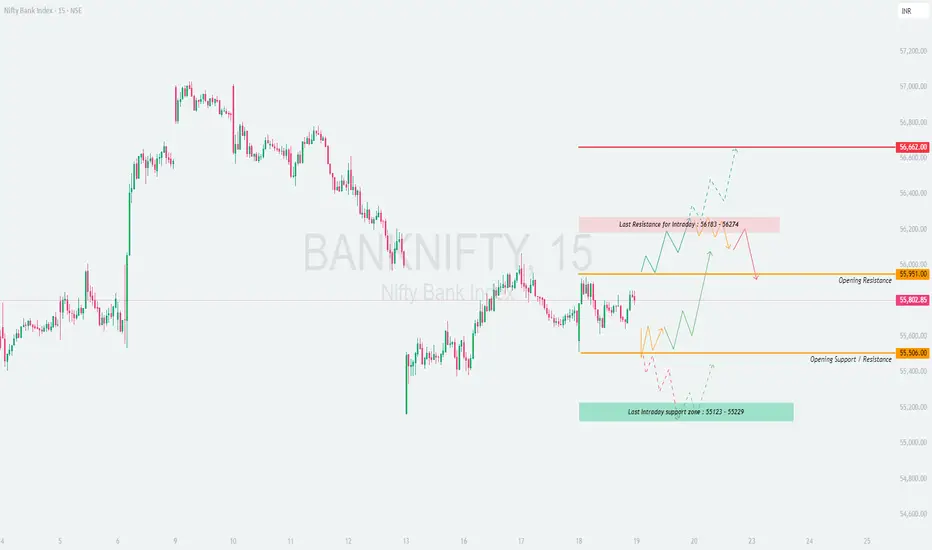
BANKNIFTY : Trading levels and plan for 19-Jun-2025🏦 BANK NIFTY TRADING PLAN – 19-JUNE-2025
📊 Previous Close: 55,802.85 | ⏱️ Timeframe: 15-min
📏 Gap Classification: 200+ points
🚀 GAP-UP OPENING (Above 56,151+):
A 200+ point gap-up above 56,151 would bring prices near or into the Last Intraday Resistance Zone: 56,183 – 56,274.
✅ Plan of Action:
• If price sustains above 56,274, consider long entries toward the next major level at 56,662.
• Look for consolidation or flag breakout on 5/15-min charts before entry.
• Stop-loss: Below 56,150 on 15-min closing basis.
• If price fails near resistance zone, watch for reversal setups (like bearish engulfing or evening star) to take short trades back toward 55,951 (Opening Resistance).
📘 Tip: Avoid impulsive longs into resistance. Let breakout candles confirm move, especially post initial volatility window (9:15–9:45 AM).
⚖️ FLAT OPENING (Between 55,506 – 55,951):
This is the equilibrium area between support and resistance. Expect range-bound or breakout trades.
✅ Plan of Action:
• Wait for breakout above 55,951 to go long toward 56,274, with SL below 55,880.
• A breakdown below 55,506 may trigger short trades toward 55,229, SL above 55,600.
• Avoid trading within the range unless price forms a clear structure (e.g., bullish/bearish flag, wedge).
📘 Tip: In tight ranges, capital preservation is key. Be reactive — not predictive — until direction is confirmed.
📉 GAP-DOWN OPENING (Below 55,300):
If Bank Nifty opens below 55,300, it will be near or inside the Last Intraday Support Zone: 55,123 – 55,229.
✅ Plan of Action:
• If the index holds above 55,123 and shows reversal candles, consider long trades back toward 55,506, SL below 55,100.
• If price breaks below 55,123 and sustains, expect further downside toward 54,850 or lower — initiate short trades .
• Confirm with 15-min structure — avoid entering against the trend.
📘 Tip: Don't try to "guess the bottom" in a gap-down. Let price reclaim and hold a key level before reversal trades.
🛡 OPTIONS TRADING – RISK MANAGEMENT TIPS:
✅ 1. Position Sizing: Use only 1–2% of capital per trade, especially during volatile openings.
✅ 2. Use OTM Spreads: Instead of buying naked options, use bull call or bear put spreads to limit risk.
✅ 3. Don’t Chase IV Spikes: Gaps often increase premiums. Wait for IV cooling or use spreads.
✅ 4. Exit on Time Decay: If your option hasn’t moved favorably within 30–45 mins post breakout, consider exiting.
✅ 5. Trade with Confirmation: Don’t react solely to gap openings — let price settle and show structure.
📌 SUMMARY – KEY LEVELS TO WATCH:
🟩 Support Zones:
• Opening Support / Resistance: 55,506
• Last Intraday Support Zone: 55,123 – 55,229
🟥 Resistance Zones:
• Opening Resistance: 55,951
• Last Intraday Resistance: 56,183 – 56,274
• Next Upside Target: 56,662
📈 Trade Bias Zones:
• Above 55,951 → Trend shifts to bullish
• Below 55,506 → Weakness sets in
• Below 55,123 → Aggressive bearish pressure likely
📢 DISCLAIMER: I am not a SEBI-registered analyst. This trading plan is for educational purposes only. Please consult with your financial advisor or conduct your own analysis before making any investment or trading decisions.
Bank Nifty intraday levels ( educational purpose only)Upside Prediction (Bullish Scenario):
Condition to Go Long (Buy):
If Bank Nifty breaks and sustains above 55,800 with volume.
Confirmation if it crosses 55,850 zone convincingly.
Targets:
Target 1: 55,950
Target 2: 56,050
Target 3: 56,160
Stop Loss: 55,700 (or 55,650 for conservative traders)
📉 Downside Prediction (Bearish Scenario):
Condition to Go Short (Sell):
If Bank Nifty breaks below 55,600, especially with red candles in early session.
Stronger confirmation below 55,500.
Targets:
Target 1: 55,400
Target 2: 55,250
Target 3: 55,100
Stop Loss: 55,750 (or 55,800 if taking early entry)

BANKNIFTY : Trading plan for 18-Jun-2025📘 BANK NIFTY – TRADING PLAN for 18-Jun-2025
🕒 Chart Timeframe: 15-min | 📍 Previous Close: 55,678.70
📏 Gap Opening Threshold: 200+ points
🔼 GAP-UP OPENING (Above 55,878):
If Bank Nifty opens above the No Trade Zone (55,856) by more than 200 points, price would be near or above the Last Intraday Resistance at 56,193 . Immediate upside momentum can push it toward the Profit Booking Zone between 56,316 – 56,391 .
✅ Plan of Action:
• Wait 15–30 mins to avoid emotional entry near resistance.
• If price sustains above 56,193 with strength (volume + higher lows), consider long trades for target zones of 56,316 – 56,391.
• If price gets rejected at 56,193 or forms bearish reversal patterns, consider short scalps with SL above 56,250, targeting back to 55,856.
• Only aggressive buyers may look for momentum above 56,391, but avoid chasing at extended zones.
📘 Educational Note: Gaps near known resistance zones are tricky. Most profits are made not by predicting, but by reacting to clean confirmation .
⚖️ FLAT OPENING (Between 55,678 – 55,856):
Flat opening inside the No Trade Zone (55,696 – 55,856) indicates a possible sideways session at the open. This zone can act as both resistance and support depending on the first breakout direction.
✅ Plan of Action:
• Avoid trading inside this zone initially — it’s designed to trap both sides.
• For Bullish Bias: Wait for price to break and hold above 55,856. Then consider longs toward 56,193 with SL below 55,800.
• For Bearish Bias: Breakdown below 55,696 with rejection candles is an opportunity to short for target 55,483. SL can be set above 55,750.
• First 15–30 mins are crucial for range direction setup — let price develop a trend.
📘 Educational Note: When trading inside a No Trade Zone, always let one side break clearly, then ride the direction with confirmation candles .
🔽 GAP-DOWN OPENING (Below 55,478):
A 200+ point gap-down would place Bank Nifty below the Opening Support (55,483) , possibly into the Buyer’s Support Zone (55,123 – 55,232) . This zone is critical and can trigger sharp rebounds or panic drops depending on sentiment.
✅ Plan of Action:
• If opening occurs near 55,123 – 55,232, look for bullish reversal signals (hammer, bullish engulfing) for long scalps with SL below 55,100, targeting 55,483.
• If price bounces from 55,123 and reclaims 55,483, buyers may get aggressive, opening room till 55,696.
• However, if price breaks below 55,123, avoid longs. Ride the downside till next major support emerges on higher timeframes.
• Avoid shorting directly into support—wait for a breakdown and retest.
📘 Educational Note: Buyer’s zones are where institutions might enter. So always confirm strength before buying and avoid shorting unless support fails convincingly.
🛡 RISK MANAGEMENT TIPS for OPTIONS TRADERS:
✅ 1. Time Entry Smartly: Avoid first 15 mins on high-gap days. Let structure build.
✅ 2. Focus on Breakout + Retest Entries — More reliable than pure breakout scalps.
✅ 3. Hedge Long Option Positions with spreads (e.g., Call Spread) to offset IV drops.
✅ 4. Always have a Stop Loss on Candle Close Basis — Prefer 15-min or hourly closes.
✅ 5. Adjust size with volatility: Higher the gap, smaller the lot size to manage risk better.
📊 SUMMARY & LEVELS TO WATCH:
• 🟢 Bullish Scenario:
– Above 55,856 → Target: 56,193 → 56,316 – 56,391
– SL below 55,800 on longs
• 🔴 Bearish Scenario:
– Below 55,696 → Target: 55,483 → 55,232 → 55,123
– Breakdown SL above 55,750
• 🟧 No Trade Zone: 55,696 – 55,856 — Wait for breakout
• 🟩 Support Zones: 55,483 / 55,232 / 55,123
• 🟥 Resistance Zones: 56,193 / 56,391
📌 Decision Point: Break of 55,856 or 55,696 decides intraday direction
⏱ Tip: Use confirmation candles + volume analysis to filter entries and exits.
📢 DISCLAIMER: I am not a SEBI-registered analyst. The above analysis is intended for educational and informational purposes only. Kindly consult your registered financial advisor before making any trading or investment decision.

Option Trading Master class Part -7Fundamentals of Stock Investing
Types of Investors:
Value Investors: Focus on undervalued companies
Growth Investors: Target high-growth potential stocks
Dividend Investors: Prefer regular income from dividends
Research Parameters:
Earnings per Share (EPS)
Price-to-Earnings Ratio (P/E)
Return on Equity (ROE)
Debt-to-Equity Ratio
Industry Trends
Tools for Investing:
Demat and Trading Account
Research Platforms (e.g., TradingView, Screener.in)
Portfolio Tracker (e.g., Zerodha Console)

Learn institutional Trading Part -5Option Buying vs Selling
Option Buyers
Pay premium
Unlimited profit, limited risk
Need strong directional movement
Option Sellers (Writers)
Receive premium
Limited profit, unlimited risk
Thrive in sideways or range-bound markets
Need deep knowledge of Greeks and risk management
6. Popular Option Trading Strategies
Beginner Strategies
Long Call/Put – Directional trades
Protective Put – Hedge stock losses
Covered Call – Generate income from holdings
Intermediate Strategies
Bull Call Spread – Buy and sell calls of different strikes
Bear Put Spread – Buy and sell puts
Straddle – Buy both call and put at same strike (high volatility)
Strangle – Buy OTM call and put (cheaper than straddle)
Advanced Strategies
Iron Condor – Neutral strategy with 4 legs
Butterfly Spread – Limited risk range strategy
Calendar Spread – Exploiting time decay differences
Ratio Spread – More contracts sold than bought

Master class 9. Introduction to Option Trading
Options are powerful derivative instruments that give buyers the right (not obligation) to buy or sell an underlying asset at a predetermined price within a specific time. They are commonly used for hedging, speculation, and income strategies.
There are two basic types:
Call Options: Right to buy
Put Options: Right to sell
Options derive value from stocks, indices (Nifty, Bank Nifty), commodities, or currencies and are traded on platforms like NSE in India.
2. Key Terminology in Option Trading
Strike Price: Price at which the option can be exercised
Premium: Cost of buying the option
Expiry: Last day the option is valid
Lot Size: Fixed number of underlying units (e.g., 50 for Nifty)
Intrinsic Value: Real value of an option if exercised now
Time Value: Portion of premium linked to time left before expiry
ATM/ITM/OTM: At The Money, In The Money, Out of The Money – defines moneyness of options

360 ONE – Bullish breakout360 ONE (NSE: 360ONE), a leading wealth and asset management firm in India, is showing strong bullish momentum backed by:
✅ Consistent Growth in AUM: The company continues to scale its assets under management with high-net-worth and ultra-HNI client acquisition.
✅ Strong Quarterly Results: Robust revenue growth and improving profit margins signal efficient operations and increased demand for wealth management services.
✅ Technically Sound Setup:
The stock has broken out from a key resistance zone with rising volumes.
Trading above all major EMAs (20/50/200), confirming a strong uptrend.
RSI is in bullish territory (>60), indicating momentum is intact.
✅ Sectoral Tailwind: The shift from traditional investments to managed wealth products is boosting firms like 360 ONE.
🟢 Price Action Suggests Further Upside
With growing investor confidence and institutional interest, the stock is poised for a potential 10–15% move in the near term, if it sustains above the breakout level.

Institution Option Trading Part-6Introduction to Institutional Option Trading
Institutional option trading refers to the use of options by large financial institutions such as hedge funds, pension funds, insurance companies, mutual funds, and proprietary trading desks to manage risk, enhance returns, or speculate on price movements. Unlike retail traders, institutions bring scale, research, and complex strategies to the options market.
Slide 2: Key Characteristics of Institutional Traders
Large Capital Base: Institutions trade in bulk with millions or billions of dollars.
Data Advantage: Access to premium data, analytics, and predictive algorithms.
Advanced Infrastructure: High-frequency execution systems, smart order routing.
Risk Management Focus: Use options for hedging equity, credit, FX, or commodity exposure.
Regulatory Boundaries: Subject to risk limits, compliance, and disclosures

Power of India VixWhy India VIX Matters?
✅ Predicts Market Sentiment: Spikes in VIX often precede sharp market moves.
✅ Option Pricing Insight: High VIX = Expensive Options; Low VIX = Cheaper Options.
✅ Helps Strategy Selection:
High VIX: Favor credit strategies (Iron Condor, Strangle Sell).
Low VIX: Favor debit strategies (Buy Call/Put, Spread Buy).
✅ Risk Management Tool: Helps gauge when to reduce exposure or go aggressive.
Option trading is a financial strategy where traders buy and sell options contracts — financial instruments that derive value from underlying assets like stocks or indices. Each option gives the buyer the right (not obligation) to buy (Call) or sell (Put) at a specified price before expiry.

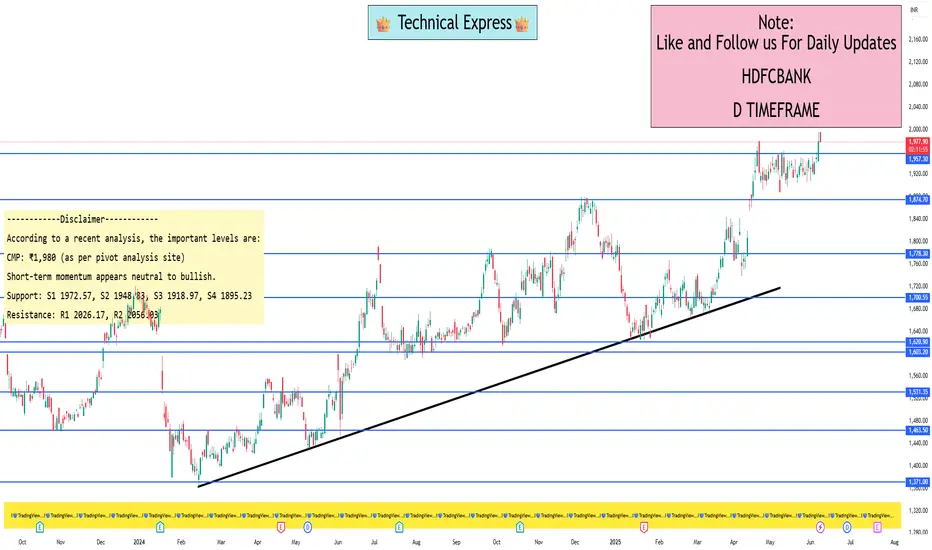
HDFC Bank levels for swing tradingAccording to a recent analysis, the important levels are:
CMP: ₹1,980 (as per pivot analysis site)
Short-term momentum appears neutral to bullish.
Daily Pivot (Classic Standard) – significant for intraday/swing entries
Pivot: 2002.43
Support: S1 1972.57, S2 1948.83, S3 1918.97, S4 1895.23
Resistance: R1 2026.17, R2 2056.03
CPR (Daily):
BC: 1969.50
P: 1972.57
TC: 1975.63
Weekly Pivot – key for multi‑day swing setups
Pivot: 1961.00
Support: S1 1925.70, S2 1872.70, S3 1837.40
Resistance: R1 2049.30, R2 2102.30
CPR (Weekly):
BC: 1952.15
P: 1961.00
TC: 1969.85
Dividend Investing & High-Yield StocksTopic: Dividend Investing & High-Yield Stocks
Slide 1: Introduction to Dividend Investing
What is Dividend Investing?
Dividend investing involves buying shares of companies that regularly pay out a portion of their earnings to shareholders. These payments, called dividends, are usually distributed quarterly and serve as a steady income source.
Why It Matters:
Generates passive income
Offers compounding returns when reinvested
Often signals strong, stable companies
Ideal For:
Long-term investors
Income-focused portfolios
Retirees looking for stable cash flow
Slide 2: Understanding High-Yield Stocks
Definition:
High-yield stocks offer a dividend yield significantly higher than the market average. Yield = Dividend per Share ÷ Share Price.
Pros:
Higher income returns
Potential price appreciation
Strong incentive for holding
Risks:
Yield traps (unsustainable payouts)
Sector-specific concentration (REITs, utilities)
Sensitivity to interest rate changes
Slide 3: Key Metrics to Analyze
1. Dividend Yield – High isn't always better; compare with industry peers.
2. Payout Ratio – % of earnings paid as dividends (ideal: <60%).
3. Dividend History – Consistent and increasing dividends show reliability.
4. Free Cash Flow – Enough cash to support future dividends.
5. Debt Levels – Too much debt may affect dividend sustainability.
Slide 4: Popular High-Yield Sectors
REITs (Real Estate Investment Trusts)
Utilities
Telecom
Energy/Oil & Gas
MLPs (Master Limited Partnerships)
These sectors often have regulated income or asset-backed cash flow streams, making them stable dividend payers.
Slide 5: Example High-Yield Stocks (India & Global)
India:
Coal India
Power Grid Corp
REC Ltd
ITC Ltd
Global:
AT&T
Verizon
Realty Income Corp (O)
Altria Group (MO)
Ensure to check for recent financial updates before investing.
Slide 6: Dividend Growth vs High Yield
Dividend Growth Stocks: Lower yield, but consistent increases (e.g., Infosys, HDFC Bank)
High-Yield Stocks: High immediate income, but riskier if growth lags
Balanced Approach: Combine both types for income and capital growth.

Advance Institutions Option Trading - Lecture 3Options trading might feel like gambling on a single trade, but informed decisions make it fundamentally different. Reckless trading without a plan can resemble gambling but is not the proper way to trade. With discipline and skill, options trading stands apart from luck-based activities.
Options involve risk and are not suitable for all investors. Certain requirements must be met to trade options. Before engaging in the purchase or sale of options, investors should understand the nature of and extent of their rights and obligations and be aware of the risks involved in investing with options.

Advance Institutions Option Trading - Lecture 1Institutional traders are professionals trading for large entities like mutual funds, hedge funds, etc. Oftentimes they will trade options to hedge their positions, but they may also trade options as pure speculation.
Equirus Securities is one of the leading domestic institutional equities brokerage firms in India with more than 180 companies under over coverage and empanelment with almost all domestic institutions and many leading FIIs.

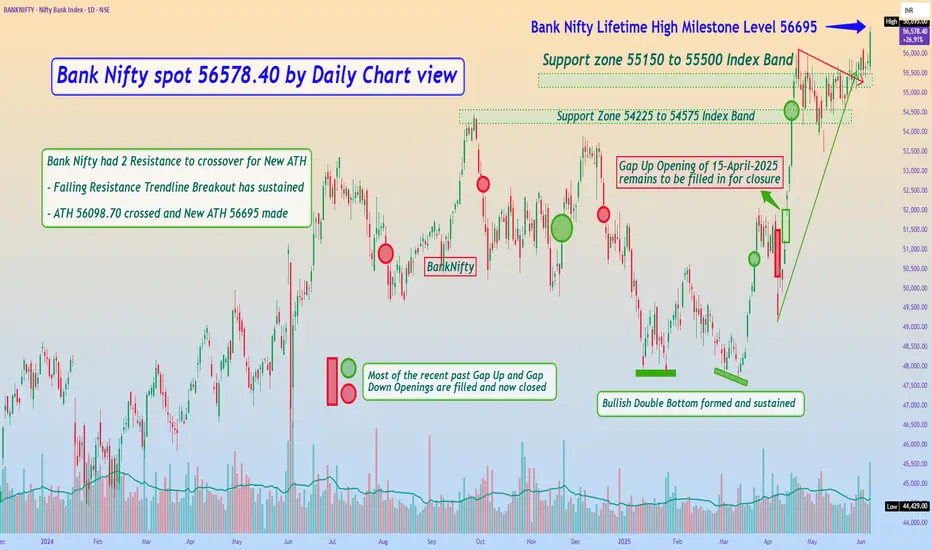
Bank Nifty spot 56578.40 by Daily Chart view - Weekly UpdateBank Nifty spot 56578.40 by Daily Chart view - Weekly Update
- *Bank Nifty creates a New Lifetime High Milestone Level 56695*
- Support zone 55150 to 55500 Index Band
- Next Support Zone 54225 to 54575 Index Band
- Bank Nifty had 2 Resistance to crossover for New ATH
- Falling Resistance Trendline Breakout has been sustained
- ATH 56098.70 has been crossed and New ATH 56695 made
- *Gap Up Opening of 15-April-2025 remains to be filled in for closure*
- Resistance just at ATH 56695 to breach and create another new milestone