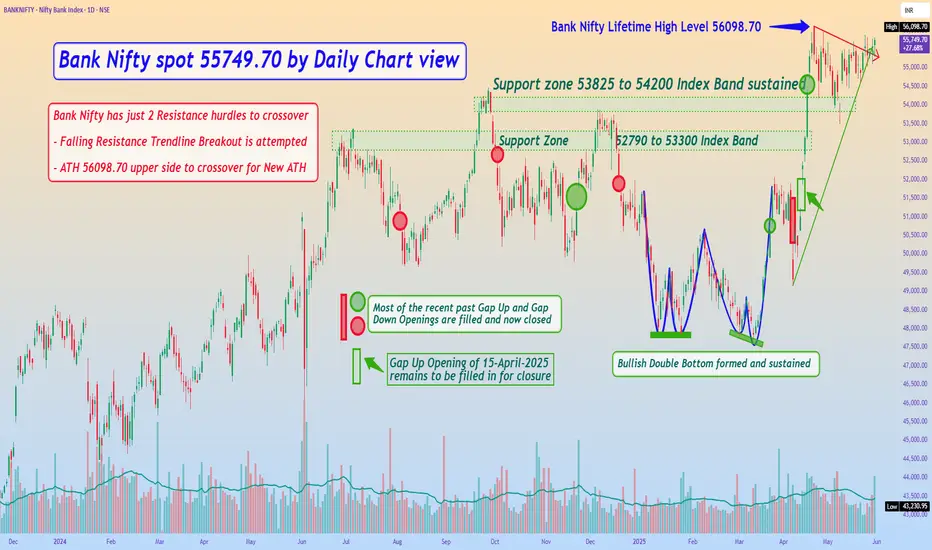
Bank Nifty spot 55749.70 by Daily Chart view - Weekly UpdateBank Nifty spot 55749.70 by Daily Chart view - Weekly Update
- Bank Nifty has just 2 Resistance hurdles to cross for New ATH creation
- Falling Resistance Trendline Breakout is attempted
- ATH 56098.70 upper side to crossover for New ATH
- Support zone 53825 to 54200 Index Band well sustained
- Bank Nifty Index is a stones throw away literally for New ATH in the makin process
- Bank Nifty Index trending well and opposite to Nifty Index which is kind of struggling to go towards the ATH
Bankniftyanalysis
MRF: Inverted Head & Shoulders Breakout |Targets Ahead! MRF has confirmed a breakout from an Inverted Head & Shoulders pattern on the daily chart, signaling a potential bullish trend reversal. The breakout has occurred with strong volumes, adding conviction to the move.
🔍 Trade Setup:
Buy Above: ₹115,579
Stop Loss: ₹111,230 (Closing Basis)
Targets:
🎯 Target 1: ₹118,028
🎯 Target 2: ₹120,443
🎯 Target 3: ₹123,358
🎯 Target 4: ₹126,157
🎯 Target 5: ₹129,019
The pattern structure aligns well with Fibonacci extension levels and previous resistance zones, providing a favorable risk-to-reward ratio.
📌 Chart Highlights:
Breakout above neckline with volume surge
Positive RSI momentum confirming breakout strength
Price sustaining above key moving averages
⚠️ Disclaimer:
I am not a SEBI-registered advisor. This analysis is shared for educational and informational purposes only. Please consult your financial advisor before making any investment or trading decisions. Trade at your own risk.

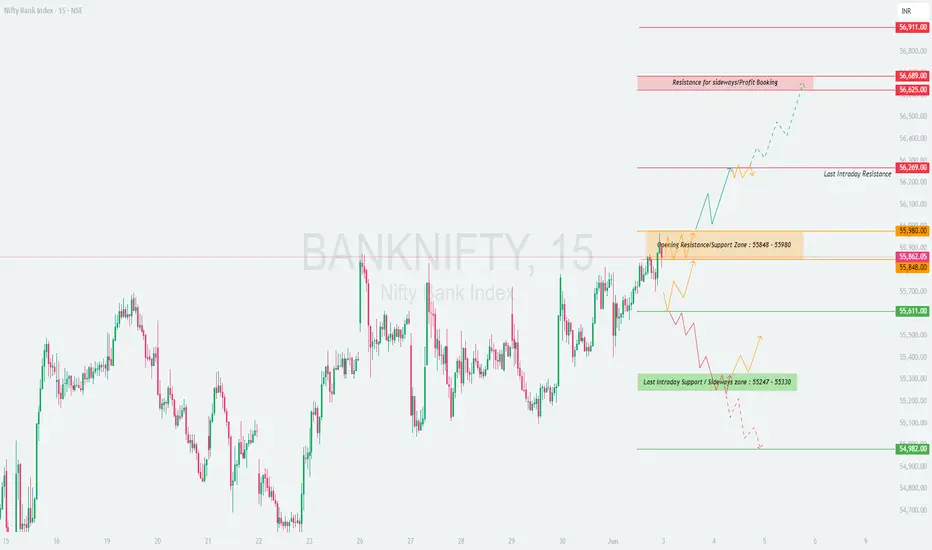
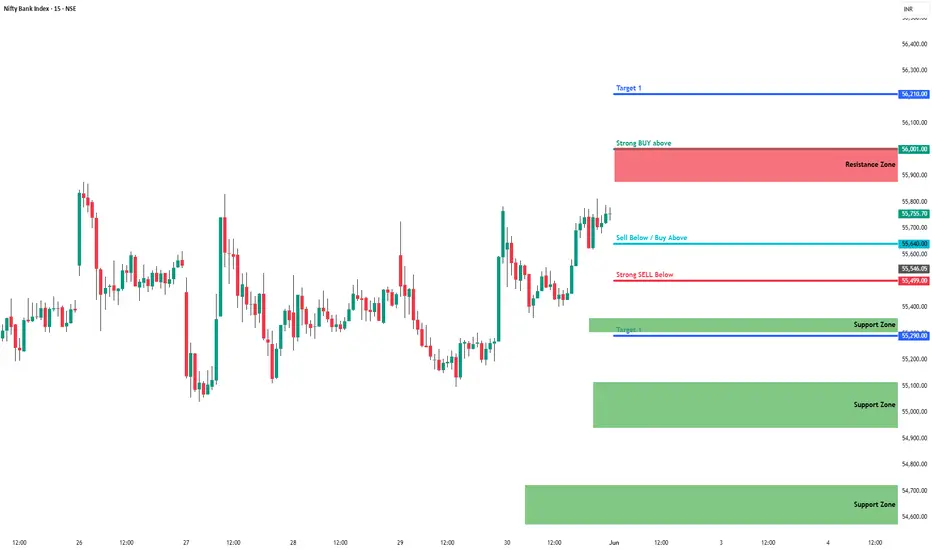
BANKNIFTY : Trading levels and Plan for 03-Jun-2025📘 BANK NIFTY – TRADING PLAN for 03-Jun-2025
🕒 Timeframe: 15-minute Chart Structure
📍 Gap Opening Threshold: 300+ points from previous close of 55,862.05
🔼 GAP-UP OPENING (Above 56,180):
A gap-up beyond 300 points will likely place Bank Nifty near or above the Last Intraday Resistance at 56,269 . This region has historically witnessed profit booking or reversal patterns. If price continues to hold above this resistance, it may aim for the Resistance for Sideways/Profit Booking at 56,625 – 56,689 . Above that lies the final upside target of 56,911.
✅ Plan of Action:
• Wait for 15–30 minutes post-open to confirm sustainability above 56,269.
• If price forms a base and breaks above 56,300 with volume support, look for a breakout trade toward 56,625 – 56,689.
• If rejection is seen at 56,269, with bearish reversal patterns like shooting star / bearish engulfing, consider short trades targeting back to 56,000 – 55,980 with SL above the day’s high.
• Only aggressive breakout buyers may consider continuation trades above 56,689, targeting 56,911, but only after a clear consolidation or retest.
🧠 Educational Insight: In strong gap-ups, always remember: the first move is often emotional. Let structure develop. Avoid chasing strength at known resistance without a base.
⚖️ FLAT OPENING (Between 55,848 – 55,980):
A flat or minor gap open in this zone places price inside the Opening Resistance/Support Zone . This is a zone of indecision, often characterized by choppy price action and traps.
✅ Plan of Action:
• Avoid jumping into trades at the open. Let a clear directional bias form.
• For Long Trades: Wait for a breakout and sustained price action above 55,980, with at least 1–2 bullish candles holding above it. Target would be 56,269, then 56,625.
• For Short Trades: If price fails to sustain above 55,980 and forms lower highs, consider shorts below 55,848, aiming for 55,611, and potentially 55,330 if momentum builds.
• Avoid trading inside this boxy range unless a decisive 15-min candle gives direction.
🧠 Educational Insight: Price in resistance/support zones often consolidates. The smart move is to let the direction emerge and avoid the urge to catch every minor bounce or dip.
🔽 GAP-DOWN OPENING (Below 55,560):
A gap-down of over 300 points will place price below the Last Intraday Support Zone (55,330 – 55,247) , or possibly near the panic support level of 54,982. This area becomes critical for intraday sentiment.
✅ Plan of Action:
• Let the initial panic selling settle in the first 15–30 mins.
• For Reversal Longs: If price reaches 54,982 and shows reversal signs (bullish hammer, engulfing), one can attempt a long scalp toward 55,247 – 55,330, with a tight SL below 54,960.
• For Breakdown Shorts: If price breaks and sustains below 55,247 – 55,330 zone without any signs of demand, you can short with SL above 55,330, for a move towards 54,982 and further if broader markets also remain weak.
• Be ready for false breakdowns in such setups—always rely on candle close confirmation.
🧠 Educational Insight: Gap-downs are often driven by fear or news. Instead of chasing fear, let the market show whether it's real selling or a trap. Trade reactively, not emotionally.
🛡 RISK MANAGEMENT TIPS FOR OPTIONS TRADERS:
✅ 1. Don’t trade the first 5–15 mins on gaps — wait for structure confirmation.
✅ 2. Avoid naked option buying after IV spike on big gaps — prefer spreads or directional futures with hedge.
✅ 3. Use time-based exits — if trade doesn’t move in 20–25 mins after breakout, re-evaluate.
✅ 4. Use proper position sizing — risk only 1–2% of your capital per trade.
✅ 5. Don’t trade breakouts blindly near resistance/support — look for confluence (price + volume + structure).
📊 SUMMARY & CONCLUSION:
• 🟢 Bullish Above: 55,980, Target: 56,269 → 56,625 → 56,911
• 🔴 Bearish Below: 55,848, Target: 55,611 → 55,330 → 54,982
• 🟧 Opening Resistance/Support Zone: 55,848 – 55,980 (Wait for clarity)
• 🟩 Support Zones: 55,330 / 54,982
• 🟥 Resistance Zones: 56,269 / 56,625 / 56,911
• ⏱ Time-based strategy: Let 15–30 mins develop, then decide based on clear structure
✨ Final Thought: Trade what you see, not what you feel. Level-based structure with time confirmation gives the best entries. Avoid emotional trades on gaps.
📢 DISCLAIMER: I am not a SEBI-registered analyst. This trading plan is for educational and informational purposes only. Please consult a SEBI-registered financial advisor before taking any investment or trading decision.
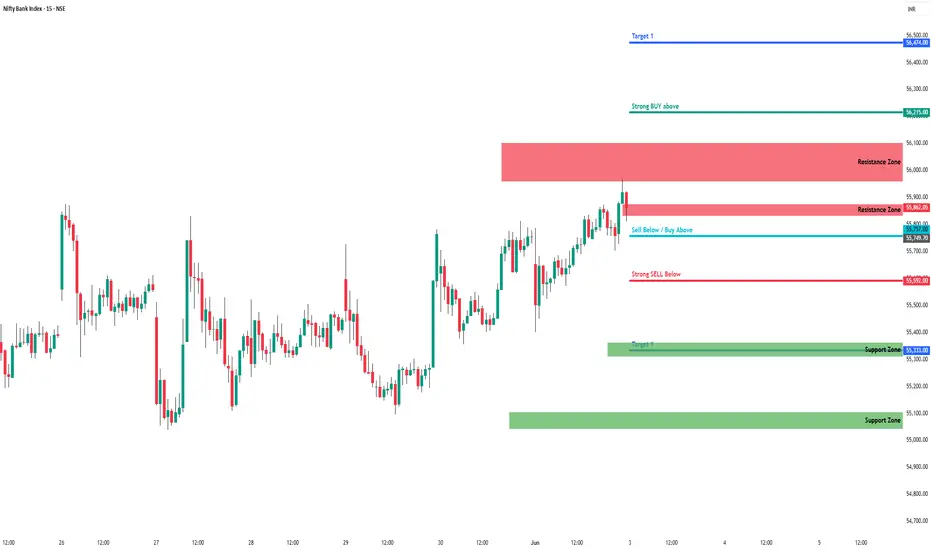
Bank Nifty - Intraday levels & Prediction for - 03 Jun 2025Bank Nifty Prediction for Tomorrow:
Trend : Mod. BEARISH
Sentiment : Positive
Expectation : BEARISH Trend Continuation upto 55000 Target
BN Trend is still BEARISH.. its just a short covering rally today. BULLISH only above 56100
Look for Buy/Sell at Demand and Supply zone for profitable trades.
Demand and Supply Zones - When price breaks the zone, Demand zone will become Resistance and Supply zone will become Support.
Refer the chart for detailed Intraday Support and Resistance levels.
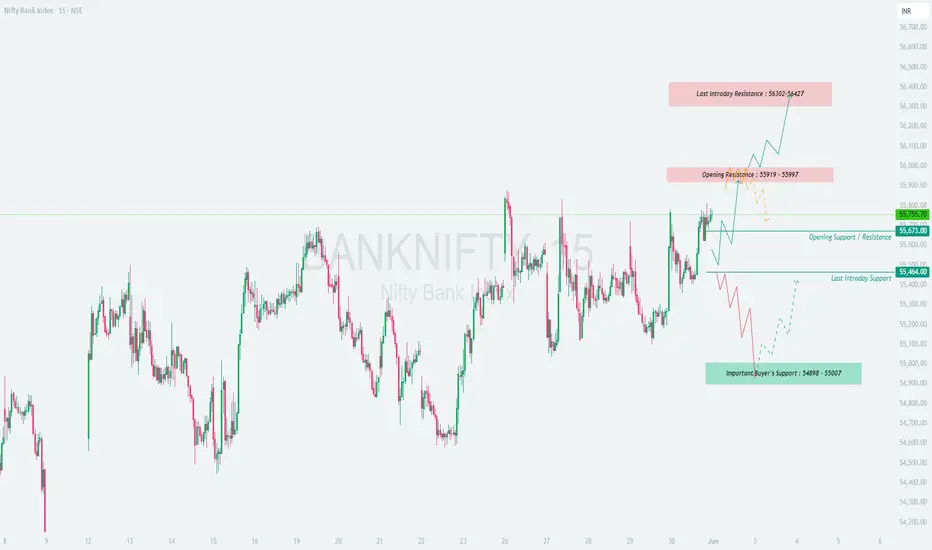
BANKNIFTY : Trading levels and plan for 02-Jun-2025📘 BANK NIFTY – TRADING PLAN for 02-Jun-2025
🕒 Timeframe: 15-minute Chart Structure
📍 Gap Opening Threshold: 200+ points from previous close of 55,755.70
🔼 GAP-UP OPENING (Above 55,997):
If Bank Nifty opens above the Opening Resistance zone (55,919 – 55,997) , the bulls will hold an early advantage. This signals potential breakout strength, but traders must stay cautious of the Last Intraday Resistance (56,302 – 56,427) .
✅ Plan of Action:
• If the opening candle sustains above 55,997, look for bullish price action confirmation (e.g., a strong green candle with follow-through).
• Go long above 55,997 targeting:
→ 56,302 (first resistance)
→ 56,427 (profit-booking zone)
• Stop-loss can be placed just below the breakout candle low or under 55,919 zone.
• Be cautious of exhaustion near 56,302–56,427; if prices spike too fast, avoid fresh longs and wait for pullback/retest.
🧠 Educational Tip: Gap-up breakouts often trap late buyers. Ensure breakout is supported by volume and structure; look for follow-through candles before entering trades.
⚖️ FLAT OPENING (Between 55,673 – 55,919):
A flat open in this neutral zone keeps both breakout and breakdown scenarios alive. The price is likely to consolidate or form a directional move after the first 15–30 minutes.
✅ Plan of Action:
• Watch the upper resistance at 55,919 – 55,997 and lower support near 55,673 – 55,464.
• A break and close above 55,997 can initiate a breakout rally (as discussed above).
• A break and close below 55,673 may lead to a test of lower supports:
→ 55,464 (Last Intraday Support)
→ 55,007 – 54,898 (Major Buyer’s Support Zone)
• Avoid trading within the 55,673–55,919 range unless a clear structure forms (like bullish/bearish engulfing or rejection wicks).
🧠 Educational Tip: During flat openings, most whipsaws occur. Patience is your biggest edge. Let market participants reveal their intent before committing to a direction.
🔽 GAP-DOWN OPENING (Below 55,464):
If Bank Nifty opens more than 200 points lower and breaches the 55,464 level, it signals immediate weakness. Bears may attempt to drag prices down to the strong demand zone at 54,898 – 55,007.
✅ Plan of Action:
• Observe how price reacts at 55,007 – 54,898:
→ If strong bullish reversal candles appear (hammer, bullish engulfing), a long reversal trade may be attempted toward:
• 55,464** (first resistance)
→ If the zone is breached, bearish momentum may accelerate toward deeper levels.
• For aggressive shorts, look for confirmation with a bearish candle below 54,898, targeting lower levels intraday (use tight stop-loss).
• Avoid emotional entries at the open; wait 15–30 mins for structure clarity.
🧠 Educational Tip: Demand zones are best traded on confirmation, not anticipation. Look for price rejection and structure. Don’t catch falling knives without confirmation.
🛡 RISK MANAGEMENT TIPS FOR OPTIONS TRADERS:
✅ Avoid buying far OTM options post-gap openings; stick with near ATM options or spreads.
✅ Use spreads like bull call/bear put spreads to control theta decay, especially if price stalls after the move.
✅ Stick to defined risk per trade (e.g., 1–2% of capital) and don’t double down on losing positions.
✅ Avoid revenge trading if the first trade fails; instead, reassess structure and re-enter only on confirmation.
✅ Always respect stop-loss based on 15-min close , not just spikes or volatility wicks.
📊 SUMMARY & CONCLUSION:
• 🟢 Bullish Scenario: Above 55,997 → Targets: 56,302 / 56,427
• 🔴 Bearish Scenario: Below 55,464 → Targets: 55,007 / 54,898
• 🟧 Neutral Zone: 55,673 – 55,919 → Wait for breakout or breakdown
• 🟩 Support Levels: 55,673 / 55,464 / 54,898
• 🟥 Resistance Levels: 55,919 / 55,997 / 56,427
• 🧠 Key Strategy: Let the first 15–30 minutes unfold. Follow price structure and risk management, not emotions.
✨ Final Word: The best trades come from waiting. Let the chart confirm your bias and stick to your plan.
📢 DISCLAIMER: I am not a SEBI-registered analyst. This trading plan is for educational purposes only. Please consult with a SEBI-registered financial advisor before making any trading or investment decisions.
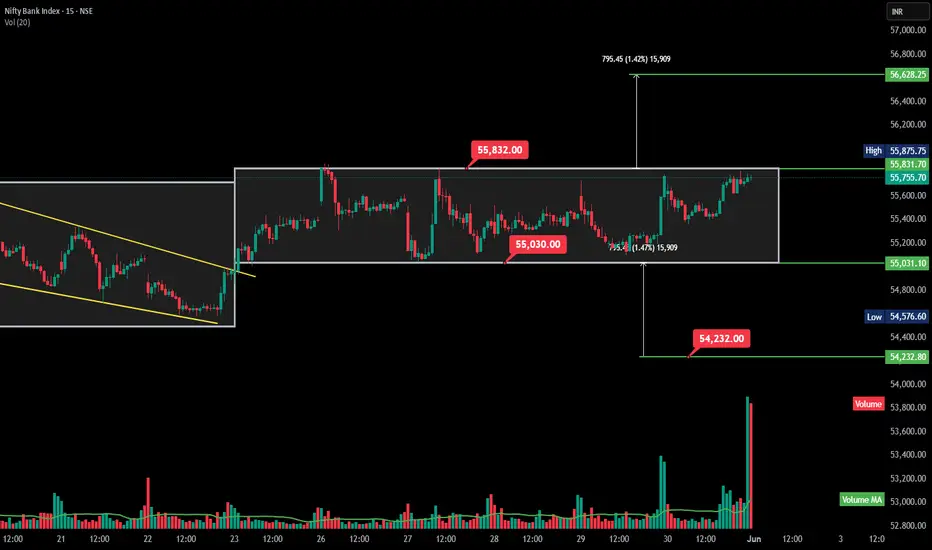
Bank Nifty Analysis 1 June 2025 | Key Levels, OI Data, and BO Bank Nifty levels and chart patterns for 2nd June 2025.
Bank Nifty consolidating within a range of 795 points, which is 55,030 to 55,832.
Currently we have resistance at 55,830 and support at 55,030.
A breakout above 55,832 can test 56,628, while a breakdown below 55,031 may bring more downside pressure to 54,232
As we have RBI policy on June 6th we may see good movement on either side. I am biased towards the higher side.
Option Chain Analysis
Looking at the Bank Nifty options open interest data, the 56,000 strike has the highest Call OI of around 1.9 million and Put OI of around 1.5 million, This suggests a strong resistance will be 56,000.
and this also show Bank Nifty not able move above 55830 range which is acting as resistance.
Moving to the volume data, there’s a noticeable spike around the 55,000 level, which indicates strong buying interest.
Watch for shifts in OI to confirm the next move.
Bank Nifty - Intraday levels & Prediction for - 02 Jun 2025Bank Nifty Prediction for Monday 02 June 2025:
Trend : Mod. BEARISH
Sentiment : Negative
Expectation : BEARISH Trend Continuation upto 55000 Target
Look for Buy/Sell at Demand and Supply zone for profitable trades.
Demand and Supply Zones - When price breaks the zone, Demand zone will become Resistance and Supply zone will become Support.
Refer the chart for detailed Intraday Support and Resistance levels.
Poonawalla Fincorp | Probable Bullish Flag Breakout Candidate📊 Technical Analysis Overview:
Poonawalla Fincorp is showing strong bullish momentum and is currently a probable flag breakout candidate. The stock has crossed the 200-day EMA with high volume, indicating strong institutional participation. Additionally, RSI is above 70, confirming bullish strength.
📌 Trade Setup & Key Levels
✅ Buy Entry: ₹357
🚨 Stop Loss: ₹333
🎯 Target Levels:
🔹 Target 1: ₹399.10
🔹 Target 2: ₹414.20
🔹 Target 3: ₹429.85
🔹 Target 4: ₹570.50
🔹 Target 5: ₹584.55
📈 Technical Observations
🔹 Flag Breakout Formation: The stock is attempting a breakout from a bullish flag pattern, which often leads to strong uptrends.
🔹 Volume Confirmation: A surge in volume alongside the breakout increases the probability of sustained upside.
🔹 200 DEMA Crossover: The price has successfully crossed the 200-day EMA, a strong bullish signal.
🔹 RSI Above 70: Indicates strong momentum, though a short-term pullback cannot be ruled out.
⚠️ Risk Management & Final Thoughts
Always use proper risk management to protect capital. The stop loss at ₹333 ensures a controlled downside, while the upside targets provide a strong risk-reward ratio.
📢 Watch for Retest: If the price retests the ₹357 level after the breakout and holds, it could provide another buying opportunity.
📊 What do you think? Will Poonawalla Fincorp continue its rally? Share your thoughts in the comments! 👇

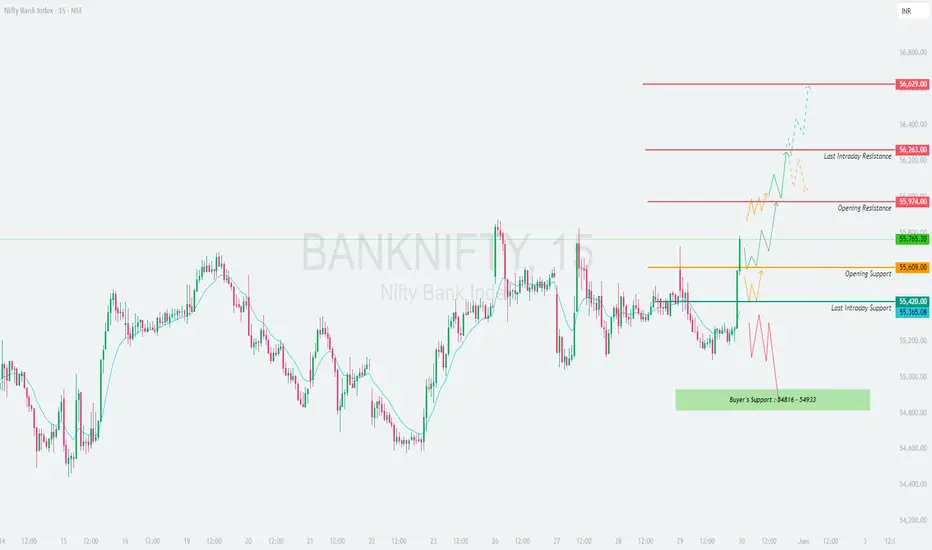
BANKNIFTY : How to trade on 30-May-2025📘 BANK NIFTY – TRADING PLAN for 30-May-2025
📊 Based on 15-min Chart Structure Analysis
📍 Gap Opening Threshold: 200+ points from previous close of 55,765
🔼 GAP-UP OPENING (Above 55,974+):
If Bank Nifty opens above the Opening Resistance zone (55,974+) , it will likely step into bullish continuation territory, with strong momentum carryover from the previous session.
✅ Plan of Action:
• Watch for a 15-min candle close above 55,974 to confirm strength.
• Once confirmed, traders can look for long trades targeting:
→ 56,263 (Last Intraday Resistance)
→ 56,629 (Breakout Extension Target)
• Ideal stop-loss would be just below 55,974, or under the candle that confirms the breakout.
• Be cautious if the index approaches 56,263 quickly after the open — some rejection is likely due to prior supply.
• Trailing SL is crucial as price nears higher resistance zones.
🧠 Educational Tip: Never chase a gap-up move in the first 5 minutes. Let price establish a base or retest breakout level before entry. Momentum needs follow-through volume, not emotion-based entries.
⚖️ FLAT OPENING (Between 55,609 – 55,974):
A flat open between Opening Support (55,609) and Opening Resistance (55,974) keeps the market in a neutral to mildly bullish state.
✅ Plan of Action:
• Avoid trading in the first 15 mins unless there’s clear direction.
• Wait for price to either:
→ Break above 55,974 for long entry (targets: 56,263 → 56,629)
→ Break below 55,609 for short entry (targets: 55,420 → 55,365)
• If Bank Nifty oscillates within this band, treat it as a “No Trade Zone” and wait for range breakout.
• Ideal setup would be a breakout-retest pattern for confirmation and cleaner entry.
🧠 Educational Tip: Consolidation zones often trap both bulls and bears. It’s smarter to sit out and conserve capital than to participate in chop. Precision is more profitable than prediction.
🔽 GAP-DOWN OPENING (Below 55,365):
A significant gap-down of over 200 points may bring the index near the Last Intraday Support (55,365 – 55,420) or even into the Buyer’s Demand Zone: 54,816 – 54,933 .
✅ Plan of Action:
• If Bank Nifty opens around 55,365 – 55,420, look for a bullish reversal pattern. If seen, you may go long with targets:
→ 55,609 (Opening Support Retest)
→ 55,765 (Previous Close)
• A breakdown below 54,933 with 15-min close opens up shorting opportunities toward:
→ 54,816 (Lower Support Edge)
→ 54,630 or lower if panic unfolds
• Avoid shorting right at open. Let the first 15-min candle show whether demand absorbs the selling or not.
• In case of sharp rejection wicks near support, expect a bounce.
🧠 Educational Tip: Demand zones are battlefields. Watch how price reacts to them — does it pierce through or bounce hard? Let the candle tell the story, not your bias.
🛡 RISK MANAGEMENT TIPS FOR OPTIONS TRADERS:
✅ Always wait for 15-min candle confirmation. It filters noise and reduces emotional triggers.
✅ Use spreads (like Bull Call/Bear Put) on event days or high IV environments. It limits losses and defines risk.
✅ Don't average into a losing trade, especially in options. It leads to poor risk-reward and capital drain.
✅ Stick to 1–2 high-quality trades per day. More trades = more exposure to noise.
✅ Book profits near resistance/support levels and trail SL. Greed kills more trades than fear.
✅ Always define a fixed loss limit per day/week. Walk away when it's hit — protect your mental capital.
📊 SUMMARY & CONCLUSION:
• 🟢 Bullish Scenario: Above 55,974 → Targets: 56,263 / 56,629
• 🔴 Bearish Scenario: Below 54,933 → Targets: 54,816 / 54,630
• 🟧 No Trade Zone: Between 55,609 – 55,974 → Wait for breakout
• 🟩 Support Zones: 55,420 / 55,365 / 54,933 / 54,816
• 🟥 Resistance Zones: 55,974 / 56,263 / 56,629
• 🎯 Strategy Focus: React to structure, respect zones, and enter only on confirmation.
✨ Final Thought: The goal is not to trade every move. The goal is to trade high-probability moves with clarity and discipline.
📢 DISCLAIMER: I am not a SEBI-registered analyst. This trading plan is shared purely for educational purposes. Please consult your financial advisor before making any trading or investment decisions. Trade responsibly. 📉📈💼
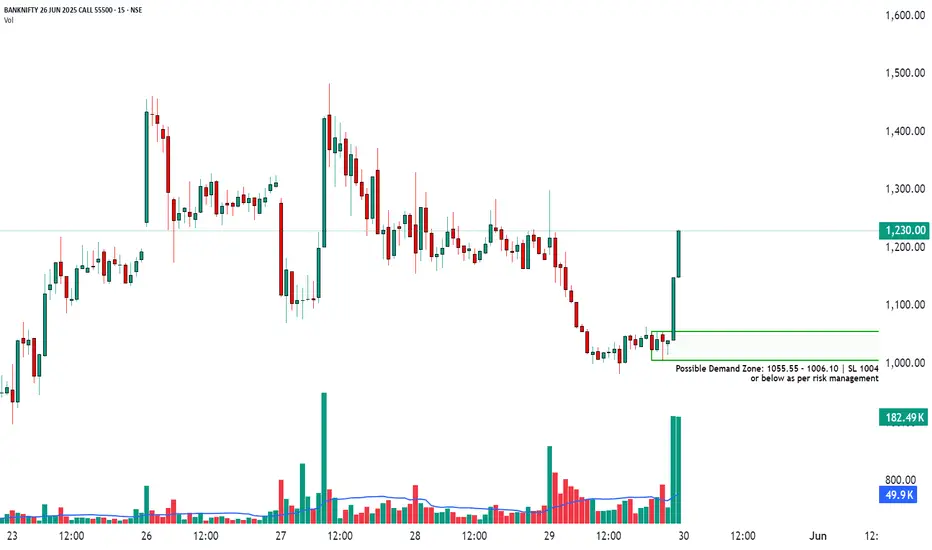
How to Trade Bank Nifty Options Using Demand Zones📈 BANKNIFTY 55500ce
📆 Date: May 29, 2025
🔍 Timeframe: 15 minute
How to Trade Bank Nifty Options Using Demand Zones
Understanding and effectively applying demand zones can significantly improve your success in trading Bank Nifty options. This approach provides a structured method to identify high-probability trades and implement disciplined risk management.
________________________________________
Why Use Demand Zones in Options Trading?
• Enables entry closer to strong support, improving reward-to-risk ratios
• Acts as a key confluence area for price action and volume
• Encourages disciplined entries based on market structure
• Helps set clear, logical stop-loss levels
________________________________________
Strategy: Two Ways to Trade Demand Zones
1. Conservative Approach – Wait for Price to Enter the Zone
Steps:
• Allow price to dip into the defined demand zone (between 1055.55 – 1006.10)
• Wait for reversal confirmation, such as:
• Bullish engulfing or a strong green candle
• Increased volume or optional bullish divergence
• Enter a Call Option (CE) position once confirmation is visible
• Place stop-loss just below the zone (e.g., ₹1004)
• Target 1: Immediate resistance or recent swing high
• Target 2: Option premium expansion based on implied volatility and price momentum
Why this works: Buying at a value zone aligns you with potential institutional demand and provides a favorable entry with limited downside.
________________________________________
2. Aggressive Approach – Trade From the Top of the Zone
Steps:
• Enter when the price first touches the top of the demand zone (around 1055.55)
• Use a tight stop-loss just below the zone (e.g., 1004)
• Consider smaller position sizing to adjust for higher entry risk
• Monitor for immediate bounce—exit quickly if no reaction follows
Why this works: Offers better reward if the demand zone holds and price reacts quickly. This is suitable for experienced traders who can act decisively.
________________________________________
Risk Management – Non-Negotiable
• Always follow stop-loss discipline based on the demand zone
• Keep position sizing conservative, risking only 1%–2% of your total capital
• Avoid overtrading; focus on high-quality, high-probability setups
• Select ATM or slightly OTM options (e.g., 55500 CE or 55600 CE) for better delta and responsiveness
________________________________________
Volume Confirmation – An Extra Edge
• Volume spikes near the demand zone strengthen the validity of the level
• If volume is absent, avoid the trade or reduce your size
• Institutional buying often reveals itself through volume near key support levels
________________________________________
Trade Entry Checklist
• Is price currently in or very near the marked demand zone?
• Is volume showing increased activity?
• Is the overall market trend favorable for calls?
• Are external/global market cues supportive (especially for intraday trades)?
• Is the risk-to-reward ratio at least 1:2?
________________________________________
Educational Recap
• Demand zones act as critical areas where strong buying interest may emerge
• Wait for price to enter the zone; avoid chasing entries
• Focus on structured risk control over trying to predict every move
• Use candlestick structure, volume analysis, and context to improve your setup quality
________________________________________
Final Thoughts
Trading Bank Nifty options with demand zones instills structure, clarity, and discipline. This approach is ideal for intraday or short-term swing traders who rely on technical precision.
The objective is not to trade frequently, but to trade at the right levels with defined risk and potential reward. Let the market come to your setup and respond with a plan—never react emotionally.
This framework reduces noise, avoids emotional trades, and helps you align with institutional buying zones with a strong edge.
⚠️ Risk Management Tip: Always trade with a clearly defined stop loss. Avoid entering positions impulsively. It is advisable to start with a smaller quantity and increase your exposure only if the price action confirms the continuation of the trend. Capital protection should always be the priority.
📢 Disclaimer
This content is created purely for educational and informational purposes. It is not intended as investment advice, stock recommendations, or trading tips. Trading and investing in the stock market involves risk. Please consult with a SEBI-registered financial advisor before making any investment decisions. The author/creator is not registered with SEBI and shall not be held responsible for any losses incurred based on this information. Always do your own research and use proper risk management.
👉 If you found this analysis helpful, don’t forget to Follow, so you never miss out on a trade-worthy setup, breakout opportunity, or valuable educational insight again. Stay updated and trade smarter! 💡📈
BANKNIFTY : Trading levels and plan for 29-May-2025📘 BANK NIFTY – TRADING PLAN for 29-May-2025
📈 Based on 15-min chart structure
📍 Gap Opening Threshold: 200+ points from previous close of 55,447
🔼 GAP-UP OPENING (Above 55,696+):
A gap-up opening above 55,696 places Bank Nifty directly above the Opening Resistance Zone (55,208 – 55,467) and into a breakout territory.
✅ Plan of Action:
• Wait for the first 15-min candle to close above 55,696 for confirmation. If sustained, it may indicate fresh bullish momentum.
• You can initiate long trades (Calls/Futures) with targets at:
→ 55,975 (Last Intraday Resistance)
→ 56,299 (Next Upside Zone)
• Ideal stop-loss would be below the breakout candle or under 55,696 .
• Avoid impulsive entries on the very first 5-min candle – let price stabilize.
• If there’s an early rejection near 55,975, partial profit-booking is advised and trailing SL becomes essential.
🧠 Educational Tip: A gap-up above resistance works well only if volume and momentum sustain. Otherwise, traps may form and fadeouts are common.
⚖️ FLAT OPENING (Between 55,208 – 55,467):
A flat open in this No Trade Zone often leads to choppy movement and wicks on both sides.
✅ Plan of Action:
• Wait for either a clear breakout above 55,467 or breakdown below 55,208 with a 15-min candle close.
• Bullish breakout above 55,467 may lead to movement toward 55,696+ .
• Bearish breakdown below 55,208 may push price toward 54,862 → 54,793 .
• Avoid taking trades within this sideways box; false breakouts are common here.
🧠 Educational Tip: Sideways zones are where most traders lose money. Let market give clarity before taking any action.
🔽 GAP-DOWN OPENING (Below 55,000):
A 200+ point gap-down opening will place Bank Nifty near or below the support zone of 54,862 – 54,793.
✅ Plan of Action:
• If Bank Nifty opens near 54,793 – 54,862 , watch this Last Intraday Support zone closely.
→ If it holds and shows bullish reversal (hammer, bullish engulfing), consider long trades for bounce to 55,208 .
• If price breaks and sustains below 54,793 , downside pressure may increase.
→ Target: 54,415 (Next Key Demand Zone)
• Shorting opportunities arise only below 54,793 with 15-min close confirmation and strict SL above breakdown candle.
• Avoid shorting blindly at open – early volatility is high after gap-downs.
🧠 Educational Tip: Major reversals happen from gap-down openings. Don’t assume trend continuation — react to structure.
🛡 RISK MANAGEMENT TIPS FOR OPTIONS TRADERS:
✅ Follow 15-min candle close for confirmations. This helps reduce false entries and noise.
✅ Avoid overtrading inside No Trade Zones. Burnout and losses often happen due to boredom trades.
✅ Use spreads (Bull Call, Bear Put) on volatile days. They help in limiting risk and optimizing returns.
✅ Keep maximum 1–2 trades/day with predefined SL. Overtrading usually leads to emotional mistakes.
✅ Always trail your profits as key levels hit. Lock-in profits as price progresses in your direction.
✅ Never average your losses in options. Respect your SL. Capital protection is the top priority.
📊 SUMMARY & CONCLUSION:
• 🟢 Bullish Above: 55,696 → Target: 55,975 / 56,299
• 🔴 Bearish Below: 54,793 → Target: 54,415
• 🟧 No Trade Zone: 55,208 – 55,467 → Avoid trading until breakout/breakdown
• 🟩 Support Zone: 54,793 – 54,862
• 🟥 Opening Resistance: 55,696
• 🔻 Major Demand Zone: 54,415
✨ Golden Rule: Trade what you see, not what you feel. Stay objective and wait for confirmations.
📢 DISCLAIMER: I am not a SEBI-registered analyst. This trading plan is shared purely for educational purposes. Please consult your financial advisor before making any trading or investment decisions. Trade at your own risk. 📉📈💼

BANKNIFTY : TRADING LEVELS AND PLAN FOR 28-MAY-2025📘 BANK NIFTY TRADING PLAN – 28 MAY 2025
🕒 Based on 15-minute price structure & major zones
📍 Gap Opening Threshold: 200+ points from previous close of 55,352
🔼 GAP-UP Opening (Above 55,552):
If Bank Nifty opens above 55,552+ , it opens beyond the No Trading Zone (55,206 – 55,459) and heads towards Last Intraday Resistance (55,697) .
✅ Plan of Action:
• Let price settle in the first 15–30 minutes. Avoid jumping in immediately.
• If Bank Nifty sustains above 55,697 on a 15-min candle close, initiate long positions (CEs) with potential targets at 55,993 → 56,299 → 56,426 (Profit Booking Zone) .
• If the price struggles near 55,993 with weak momentum, consider booking partial profits or tightening SL.
• A failed breakout above 55,697 that quickly reverses can be a trap — observe for bearish price action before considering reversal trades.
• Ideal pullback entries can come between 55,552 – 55,697 , if retested with bullish confirmation.
🧠 Educational Insight: After a gap-up into resistance, confirmation through volume and candle strength is essential to validate trend continuation. Don't chase blindly.
⚖️ FLAT Opening (Between 55,206 – 55,459):
In this scenario, Bank Nifty opens inside the NO TRADING ZONE (55206 – 55459) .
✅ Plan of Action:
• This is a tricky and uncertain zone — mark it as a NO TRADE ZONE unless a clear breakout or breakdown occurs.
• Wait for a 15-min candle close above 55,459 and then re-entry over 55,552 for a bullish setup targeting 55,697 – 55,993 .
• If price breaks below 55,206 and sustains, bearish bias activates. You can initiate PE entries with downside targets at 54,943 – 54,825 .
• Avoid placing trades within this zone — options premium decay is likely to kill both sides without direction.
🧠 Educational Insight: Sideways or indecisive zones must be avoided for directional trades. Breakouts and retests offer better reliability and risk/reward setups.
🔽 GAP-DOWN Opening (Below 55,152):
If Bank Nifty opens 200+ points lower (below 55,152 ), it's opening beneath the No Trading Zone and potentially closer to Last Intraday Support: 54,943 – 54,825 .
✅ Plan of Action:
• Let the market stabilize and watch how it reacts to the Support Zone (54,943 – 54,825) .
• If this zone holds and a bullish reversal (like hammer, bullish engulfing) appears, a bounce back toward 55,206+ is likely — ideal for intraday CEs with tight SLs.
• A breakdown and sustained trade below 54,825 will activate downside targets toward 54,411 . In such cases, PEs with SL above 54,943 retest can be considered.
• Reversals are common around support zones; don't be the first to jump in short — let price action lead your decision.
🧠 Educational Insight: Support zones are where bears get trapped if not confirmed with breakdown. Confirmation and patience are keys to catching trend continuation.
🛡 RISK MANAGEMENT TIPS FOR OPTIONS TRADERS:
📌 Use 15-min candle close SL – not random stop-losses.
📌 Avoid trading in the first 5–10 minutes unless it’s a clean breakout/breakdown.
📌 Avoid trading inside the No Trading Zone (55206 – 55459) .
📌 Don’t overtrade. Stick to 1–2 high-conviction trades .
📌 For high IV days, consider spreads (Bull Call/Put Spread) instead of naked options.
📌 Always calculate risk-reward ratio ≥ 1:2 before entering.
📌 Stay away from emotional averaging or revenge trading.
📊 SUMMARY & CONCLUSION:
• 🟢 Bullish Above: 55,697 → Targets: 55,993 / 56,299 / 56,426
• 🔴 Bearish Below: 54,825 → Targets: 54,411
• 🟧 No Trade Zone: 55,206 – 55,459
• 🟩 Support Zone: 54,825 – 54,943
• 🟥 Resistance Zone: 55,697 – 55,993
✨ Be patient — let the market come to your levels instead of chasing. Confirmation through candle patterns and volume will increase your success probability. Focus on capital protection above all.
📢 DISCLAIMER: I am not a SEBI-registered analyst. This trading plan is for educational purposes only. Please consult your financial advisor before making any trading or investment decisions. Trade responsibly. 💼📉📈

BANKNIFTY : Trading levels and Plan for 27-May-2025📘 BANK NIFTY TRADING PLAN – 27 MAY 2025
🕰 Based on 15-min chart structure and key support/resistance zones
📍 Gap opening considered if movement is 200+ points from previous close (55,558)
🔼 GAP-UP Opening (Above 55,777 – 200+ points):
If Bank Nifty opens with a strong gap-up above the Last / Opening Resistance Zone (55,745 – 55,777) , it will enter an extended bullish territory.
✅ Plan of Action:
• Avoid aggressive entries in the first 15–30 minutes as volatility can trap buyers.
• If price sustains above 55,777 on a 15-min candle close, we may see a bullish move toward 55,999+ .
• A pullback to retest 55,745–55,777 zone with a strong bullish candle can offer a good long opportunity (buy CE).
• On failure to hold above 55,777 and signs of rejection, scalpers can attempt PE trades targeting 55,558–55,454.
🧠 Educational Tip: Gap-ups into resistance zones require confirmation. Patience for price action saves traders from emotional entries.
⚖️ FLAT Opening (Between 55,454 – 55,745):
A flat opening within this band means Bank Nifty is trading between Opening Support / Resistance (55,454) and Initial Resistance (55,745) .
✅ Plan of Action:
• This is a NO TRADE ZONE initially. Wait for price to break out above 55,745 or break down below 55,454.
• Avoid option buying here – premiums will decay due to time and volatility crush.
• If price breaks above 55,745 with volume and retests successfully, consider CE buying for 55,777 / 55,999 targets.
• If price breaks down below 55,454, we may move to test 55,136–55,225 Buyer’s Support. This can be a scalp PE opportunity.
🧠 Educational Tip: Sideways opens often trap both sides. Let the market reveal its direction before jumping in.
🔽 GAP-DOWN Opening (Below 55,136 – 200+ points):
A gap-down opening below the Buyer’s Support Zone (55,136 – 55,225) would indicate potential weakness.
✅ Plan of Action:
• Watch how price behaves at or near Last Intraday Support – 54,856 .
• If price bounces strongly from 54,856–55,136 area, look for bullish reversal candles for scalping CE.
• Breakdown and 15-min close below 54,856 can intensify selling pressure – can test lower support zones (not marked on chart).
• Avoid aggressive PE entry immediately on open; wait for retest or sideways consolidation to build position.
🧠 Educational Tip: Support zones are where smart money accumulates. Observe candle wicks and volume reactions to time entries.
🛡 RISK MANAGEMENT TIPS FOR OPTIONS TRADERS:
• Always use Stop Loss on candle close basis ; avoid emotional exits.
• Stick to 1–2 trades max in a day. Overtrading kills discipline and capital.
• Avoid chasing premiums right after the opening bell; IV crush and spread wideness can hit you hard.
• Use Option Spreads (Bull Call / Bear Put) to reduce premium decay and risk.
• Don’t trade without a clear setup – Plan your trade, then trade your plan!
📊 SUMMARY & CONCLUSION:
• 🔼 Bullish Breakout Zone: Above 55,777 → Target: 55,999+
• 🔽 Bearish Breakdown Zone: Below 55,136 → Target: 54,856 / lower
• 🟧 Neutral Zone (No Trade Early): 55,454 – 55,745
• 💚 Buyers’ Support Zone: 55,136 – 55,225
• 🟥 Sellers’ Resistance Zone: 55,745 – 55,777
📌 Be flexible but not reckless. Observe the structure, respond with discipline. Great trades come from waiting, not chasing.
📢 DISCLAIMER: I am not a SEBI-registered analyst. The above plan is purely for educational purposes. Please consult your financial advisor before making any investment decisions. Trade wisely. 💼📉📈

Banknifty 2025-2026 (Expected level)Banknifty. (Only for Experienced traders" )
Enter after " Breakout and Retracement ".
Leave a " Like If you agree ".✌.
Follow for regular updates 👍
.
For " long "
entry: 56000 / 56500
target: 60000- 62350
stoploss: 54800
Enter only if market Breaks
"Yellow box" mentioned.
.
.
For " Short"
entry: 54000
target:51000- 49500
stoploss: 54600
Enter only if market Breaks
"Yellow box" mentioned.
.
Wait for proper reversal and conformation.
.
Don't make complicated trade set-up.📈📉
Keep it " Simple, Focus on Consistency "💹.
Refer our old ideas for accuracy rate🧑💻.
Valuable comments are welcomed-✌️
.
.
Disclaimer:
Our Trading style is not to capture "10-20" points per trade.📊
We take entry only for min "200-300" points without any distractions.💹
So, our ideas may not be preferable for small traders, who just focusing on too much of support and resistance.📈📉📈
So, please consider others ideas.
This is for educational purposes.🧑💻

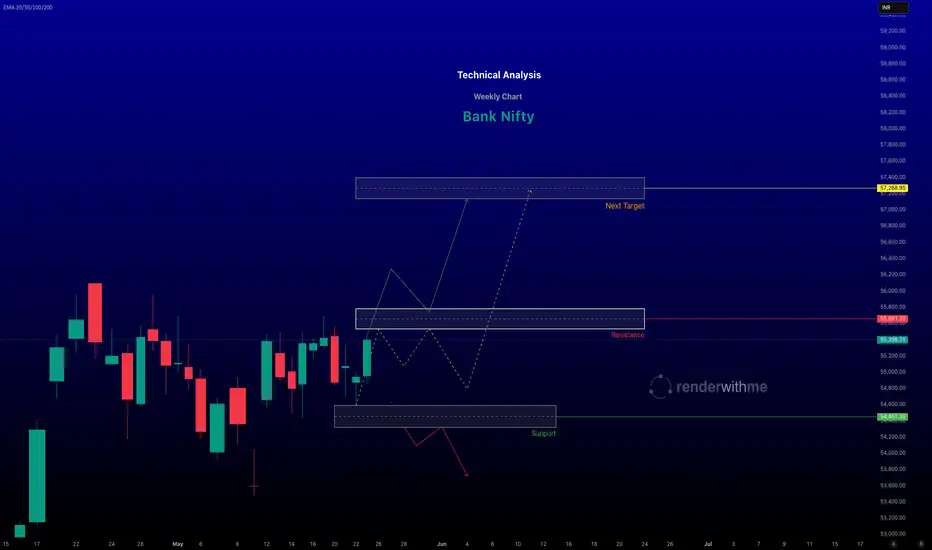
Bank Nifty Weekly Technical Analysis for May 26–30, 2025Bank Nifty Technical Analysis for May 26–30, 2025
# Current Market Context
Recent Performance: As of May 23, 2025, the Bank Nifty index closed at approximately 55,389, up 456.94 points in the prior session, reflecting bullish momentum. The index is trading within a broken descending channel, indicating potential for further upside if key levels are sustained.
Market Sentiment: I suggest a neutral to bullish bias, with some analysts expecting a breakout above 55,900 or a move toward 56,500–57,500 in the near term. However, signs of distribution and weak open interest (OI) build-up indicate caution, as momentum may stall if support levels break.
#Key Technical Levels
- Support Levels:
Immediate support lies at 54,800–54,850, coinciding with the 20-day EMA zone. A break below 54,850 could trigger selling pressure, with further support at 54,700, 54,450, and 54,250.
Weekly pivot support is noted at 54,600, with a stronger support at 54,300 if a deeper correction occurs.
- Resistance Levels:
Immediate resistance is at 55,520 - 55,700 . A sustained break above this could lead to short covering and targets of 56,000 - 57,500
## Disclaimer
- This analysis is based on recent technical data and market sentiment from web sources. It is for informational purposes only and not financial advice. Trading involves high risks, and past performance does not guarantee future results. Always conduct your own research or consult a SEBI-registered advisor before trading.
BANKNIFTY : Trading levels and Plan for 23-May-2025📊 Bank Nifty Trading Plan – 23-May-2025
Chart Timeframe: 15 Min | Reference Spot Price: 54,963.25
Gap Opening Threshold: 200+ points
🚀 Gap-Up Opening (200+ Points Above Previous Close)
If Bank Nifty opens around 55,150+, it will enter directly into the Opening Resistance Zone: 55,149 – 55,257 .
🟥 This zone is marked as a high supply area. Price tends to react with either consolidation or reversal due to trapped buyers/sellers from previous sessions.
✅ Plan of Action:
– Avoid aggressive longs right at the open in the resistance zone.
– Wait for a 15-min bullish candle to close above 55,257 for confirmation. This could open the upside to 55,455, the last intraday resistance.
– Bearish rejection patterns (like shooting star, bearish engulfing) in this zone can be used for sell-on-rise trades targeting back to 54,963 or even 54,788.
– Ideal stop loss should be just above 55,300–55,350 zone for short trades.
🎓 Educational Note: Zones like this often act as reversal points for intraday traders. Waiting for confirmation helps avoid traps.
📈 Flat Opening (within ±200 Points)
If Bank Nifty opens between 54,770 – 55,100, it opens near the mid-level or inside the indecisive No Trade Area around 54,963.
🟧 This area lacks clear directional bias. Choppiness, fakeouts, and whipsaws are common.
✅ Plan of Action:
– Stay out during the first 15–30 minutes. Observe trend formation.
– If price breaks and sustains above 55,149, it can give a clean move toward 55,257 – 55,455.
– If price slips below 54,788 and sustains, it may revisit Opening Support Zone: 54,661 – 54,778.
– Breakdown of 54,661 opens the gates for testing 54,416, the last intraday support.
🎓 Educational Note: Inside-range opens are often manipulated zones. Avoid premature entries and let price show strength or weakness beyond known key levels.
📉 Gap-Down Opening (200+ Points Below Previous Close)
If Bank Nifty opens near or below 54,750, we are entering the critical Opening Support Zone: 54,661 – 54,778 .
🟩 This is a demand area where buyers previously supported the market.
✅ Plan of Action:
– Watch price behavior closely near 54,661.
– If bullish reversal patterns (like hammer, bullish engulfing) form and sustain, one can consider a reversal long trade with upside potential to 54,963 and above.
– However, a breakdown and 15-min candle close below 54,661 indicates seller dominance. In that case, target is Last Support: 54,416, and potentially 54,099 if the fall continues.
🎓 Educational Note: Don’t blindly buy dips in support zones. Confirm trend reversal before entering. Always have stop-loss in place.
🛡️ Options Trading Risk Management Tips
✅ Use ATM or slightly ITM options for better price movement and less theta decay.
✅ Always trade with stop-loss based on spot levels, not option premiums.
✅ Avoid trading in No Trade Zones or during sideways market—wait for breakout or breakdown levels.
✅ Book partial profits near intermediate levels and trail SL to protect gains.
✅ Avoid overleveraging. Limit capital exposure to 1–2% per trade.
✅ Control emotions. Don’t revenge trade after stop-loss hits.
📌 Summary & Conclusion
🔹 Opening Resistance Zone: 55,149 – 55,257
🔹 Last Intraday Resistance: 55,455
🔹 Opening Support Zone: 54,661 – 54,778
🔹 Last Support Zone: 54,416
🔹 Deeper Support (Breakdown Only): 54,099
📈 Direction bias will be clear once price exits either support or resistance zone with volume.
⏱️ Wait for first 15–30 minutes before entering trades to avoid false breakouts.
🎯 High probability setups lie near breakout from resistance or breakdown from support.
⚠️ Disclaimer:
I am not a SEBI-registered analyst. This trading plan is shared only for educational and informational purposes. Please consult with a registered financial advisor before making any trading or investment decisions.
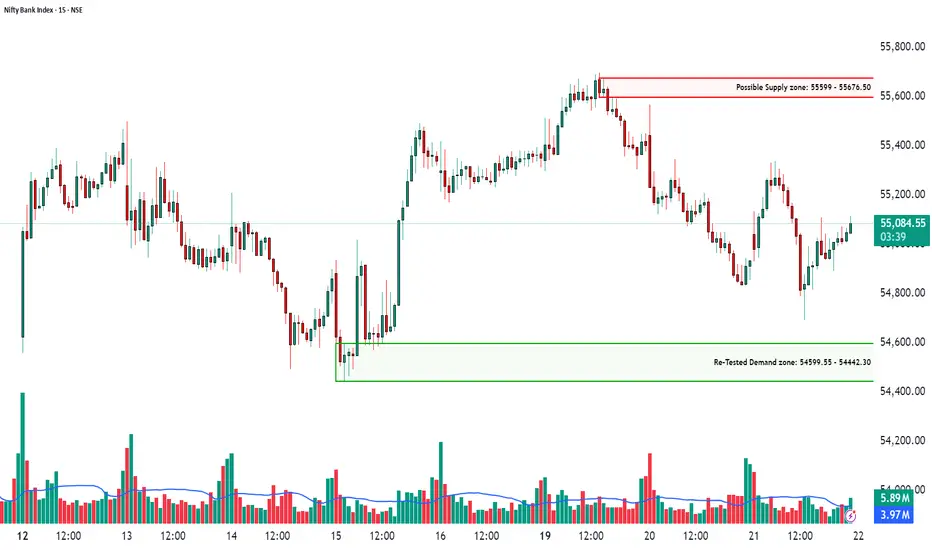
Supply & Retested Demand Zone in Play!🟣 Bank Nifty Index – Supply & Retested Demand Zone in Play! | 15-Min Chart Breakdown
📅 Date: May 21, 2025 | 🕒 Timeframe: 15-Minute
Hello Traders 👋
Today's Bank Nifty chart presents a textbook scenario of supply rejection and demand zone defense. These key zones could drive the next directional move, especially as price hovers in a narrow intraday range after sharp volatility earlier in the session.
🔲 Possible Supply Zone: 55,599 – 55,676.50
This zone formed after a strong rally got rejected with aggressive selling. The wick rejections and follow-up red candles confirm the presence of institutional sellers. If price revisits this level, look for shorting opportunities only with confirmation like bearish engulfing or volume spike.
🔲 Re-Tested Demand Zone: 54,599.55 – 54,442.30
A powerful base that sparked a strong reversal rally. The demand zone was successfully retested on May 21 with clear buying interest. Buyers defended this zone again, forming a bullish rejection wick on rising volume – indicating accumulation.
📊 Volume Context:
✅ Spike in volume seen during the bounce from the demand zone – bullish strength confirmed.
✅ Low volume chop as price consolidates near 55,000 – suggests a bigger move is brewing.
📌 Watch for a volume breakout above 3.5M to validate any directional move.
🧠 What Should Traders Watch For?
Short Trade Setup near 55,600–55,675: Look for rejection candles + selling volume.
Long Trade Setup near 54,600–54,450: Wait for bullish confirmation + rising volume.
Avoid entering mid-range without confirmation – it’s a trap zone.
Respect the supply and demand boundaries – this is a range-to-breakout transition phase.
📌 Note: Supply and demand zones are not magic levels—they are high-probability areas where past buyer/seller action can repeat. Combine with price action and volume for precision entries.
💬 Drop your thoughts, questions, or your zone levels below. Follow for more real-time chart education and actionable breakdowns!
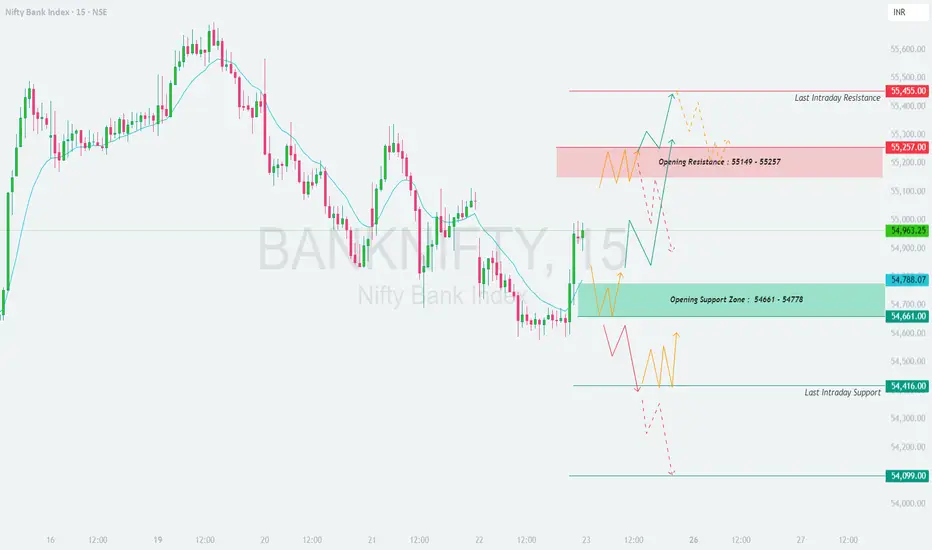
BANKNIFTY : Trading levels and Plan for 22-May-2025📊 Bank Nifty Trading Plan – 22-May-2025
Chart Timeframe: 15 Min | Reference Spot Price: 55,065.60
Gap Opening Threshold: 200+ points
🚀 Gap-Up Opening (200+ Points Above Previous Close)
If Bank Nifty opens around 55,265+, price will likely open near or inside the Last Intraday Resistance Zone: 55,415 – 55,510 .
🟥 This is a critical supply zone and may trigger profit-booking or reversal. Price action near this zone must be observed carefully before making any decision.
✅ If price breaks above 55,510 with strength and closes a 15-min candle above it, you may enter a long trade with a potential upside towards 55,816. This is the next probable target, as per price structure and wave projection.
🚫 If price shows rejection in the resistance zone (long upper wick, indecision candle, or bearish engulfing), consider this a sell-on-rise opportunity . The target on downside would be back to the “No Trade Zone” (55,009 – 55,197).
🎯 Plan of Action:
– Long only on confirmed breakout above 55,510.
– Short if price gets rejected and slips back below 55,265.
– Avoid indecisive price action; wait for clarity.
📈 Flat Opening (within ±200 Points)
If Bank Nifty opens between 54,870 – 55,200, it opens inside the No Trade Zone: 55,009 – 55,197 .
🟧 This zone is usually filled with indecision, tight consolidation, and choppy price moves. Avoid initiating trades immediately in this range. Let the market break out or down from this zone for better clarity.
🟢 A bullish move above 55,197, followed by a strong candle close above 55,265, sets up a trade toward 55,415 – 55,510.
🔻 A breakdown below 55,009 and confirmation below 54,900 may trigger a short trade. You can then expect price to slide toward 54,777, and if this level breaks, further downside opens up to 54,412 – 54,481 (Buyer’s Support).
🎯 Plan of Action:
– Do not trade inside No Trade Zone.
– Trade breakout above 55,197 with target 55,415+.
– Trade breakdown below 55,009 with target 54,777 and 54,412.
📉 Gap-Down Opening (200+ Points Below Previous Close)
If Bank Nifty opens around 54,850 or lower, it is opening just above or inside the Opening Support: 54,777 .
🟩 This level could act as short-term support. Watch for any reversal signs like bullish engulfing or hammer pattern near 54,777. If confirmed, a bounce toward 55,000 – 55,100 is possible.
⚠️ However, if price breaks and sustains below 54,777, you may see a fast fall toward the Last Buyer’s Support: 54,412 – 54,481 . This is a major demand zone and could again offer reversal or bottom-fishing trades.
🔴 If even this green zone breaks, avoid longs and let price structure stabilize before considering re-entries.
🎯 Plan of Action:
– Look for reversal near 54,777 or 54,412–54,481 with proper bullish candles.
– Short trade below 54,777 if price sustains with volume.
– Avoid bottom-fishing unless clear reversal is visible.
🛡️ Risk Management Tips for Options Traders
✅ Avoid trading deep OTM options right after the open, especially if inside the No Trade Zone. Premium decay is faster in such zones.
✅ Set Stop Loss based on spot price action (not option premium). Let candles confirm your bias.
✅ Wait for breakout candle close (15-min/1-hour) before initiating trades.
✅ Position sizing is crucial —do not risk more than 1-2% of your capital on a single trade.
✅ Avoid revenge trading —if SL hits, wait and re-analyze instead of forcing trades.
✅ Book partial profits and trail SL in your favor to lock in gains on momentum moves.
📌 Summary & Conclusion
– No Trade Zone: 55,009 – 55,197
– Resistance Zone: 55,415 – 55,510 | Target Above: 55,816
– Opening Support: 54,777 | Major Buyer's Support: 54,412 – 54,481
– Avoid trading in choppy zones —wait for directional moves and confirmations.
– Let the first 15–30 minutes play out, especially in gap-up/gap-down scenarios.
💡 Key Principle: Patience is profitable. React to price, don’t predict it.
⚠️ Disclaimer:
I am not a SEBI-registered analyst. This trading plan is shared purely for educational and informational purposes. Please consult with a registered financial advisor before making any investment or trading decisions.
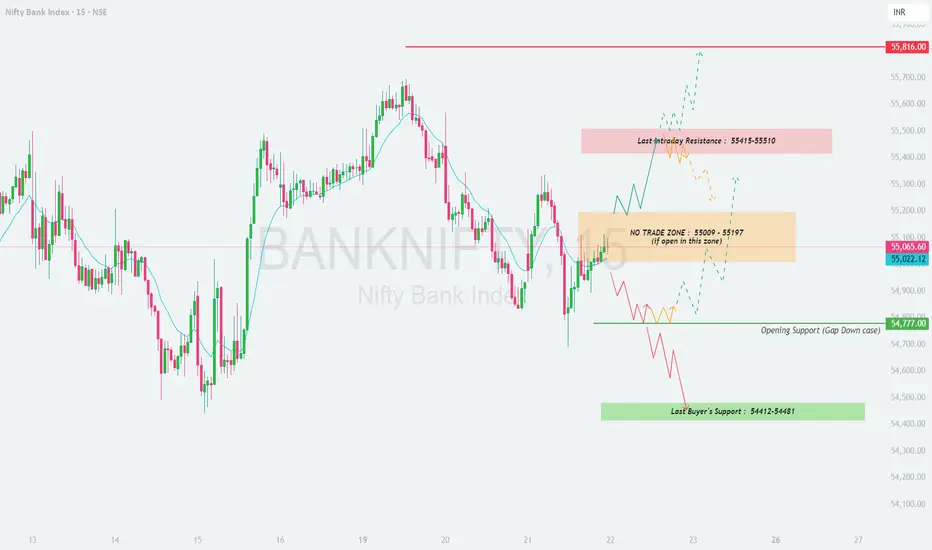
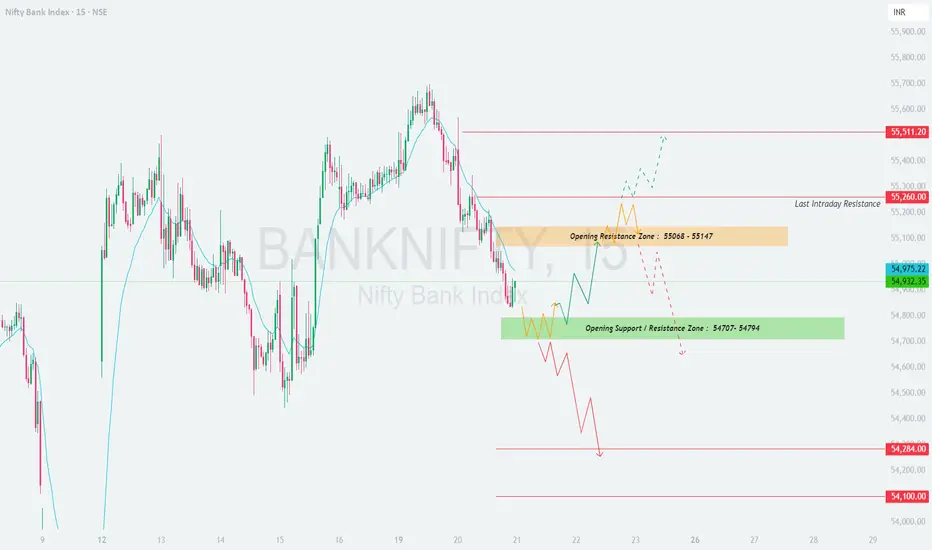
BANKNIFTY : Trading levels and Plan for 21-May-2025🧠 Bank Nifty Trading Plan for 21-May-2025
Chart Timeframe: 15 min | Reference Price: 54,932
Gap Threshold: 200+ points
📈 Gap-Up Opening (200+ Points Above Previous Close)
If Bank Nifty opens above 55,130+, prices will likely open inside or just near the Opening Resistance Zone of 55,068 – 55,147.
🟧 In this case, avoid aggressive long entries at the open. Let the index first test this resistance zone. Only if an hourly candle closes above 55,147 , you may consider going long for a target towards the Last Intraday Resistance of 55,260, and then possibly 55,511 if momentum continues.
🚫 However, if price fails to hold above the zone and shows rejection candles or breaks back below 55,000, consider short opportunities with confirmation for a downside toward the 54,800–54,700 zone.
🎯 Plan of Action:
– Watch price behavior around 55,068 – 55,147.
– Hourly close above → Longs with SL below zone.
– Rejection → Wait for confirmation, short with SL above zone.
📊 Flat Opening (within ±200 points)
A flat open near 54,900–55,000 keeps both breakout and breakdown possibilities active.
🟢 Wait and observe for the first 30 minutes. If Bank Nifty begins to trend upward with strong bullish candles, then 55,068–55,147 becomes the crucial breakout zone to watch for intraday longs.
🟩 On the downside, if prices drift into the Support Zone of 54,707 – 54,794 and show a reversal sign (bullish engulfing or pin bar), it can offer a good long opportunity with tight SL.
❌ But if the support breaks convincingly with an hourly close below 54,707, expect a potential decline towards 54,284, and even 54,100 in extended weakness.
🎯 Plan of Action:
– Avoid early trades, allow structure to form.
– Long above resistance with hourly close.
– Short below 54,707 with candle confirmation.
📉 Gap-Down Opening (200+ Points Below Previous Close)
If the index opens near or below the support zone at 54,700 or lower, especially in the range of 54,500–54,600, watch closely for a retest of the green zone (54,707–54,794) from below.
🔁 If it retests and fails to reclaim, you can look for shorting opportunities for targets of 54,284 and then 54,100.
🟢 If the price stabilizes above 54,707 and shows strength, it may turn into a quick reversal trade back toward 55,000. But this needs early confirmation and discipline.
🎯 Plan of Action:
– Below 54,707 → Bearish bias.
– Reclaim with strength → Intraday reversal possible.
– Avoid trading right at open in panic; wait 15–30 mins.
💡 Options Trading Risk Management Tips
✅ Always define your maximum loss per trade and stick to it. Use predefined SL, especially on option buys.
✅ Avoid trading large position sizes in weekly expiry weeks unless direction is clear.
✅ Avoid averaging losing trades ; instead, wait for proper re-entry points.
✅ Use ATM or slightly OTM options for directional trades—avoid deep OTM options unless you are scalping with experience.
✅ If taking multiple trades, follow 1-2% rule on capital per trade risk for better capital preservation.
📌 Summary & Conclusion
– Market structure remains volatile with a bearish short-term bias, unless 55,147+ is reclaimed.
– 55,068–55,147 is the crucial resistance zone.
– 54,707–54,794 acts as a major support for intraday direction.
– Any move below 54,707 could trigger deeper fall toward 54,284 & 54,100.
Stay nimble, respect levels, and always trade the reaction, not the prediction. Let price action guide your entry/exit.
⚠️ Disclaimer:
I am not a SEBI-registered analyst. This trading plan is shared purely for educational and informational purposes. Please consult your financial advisor before making any trading decisions.
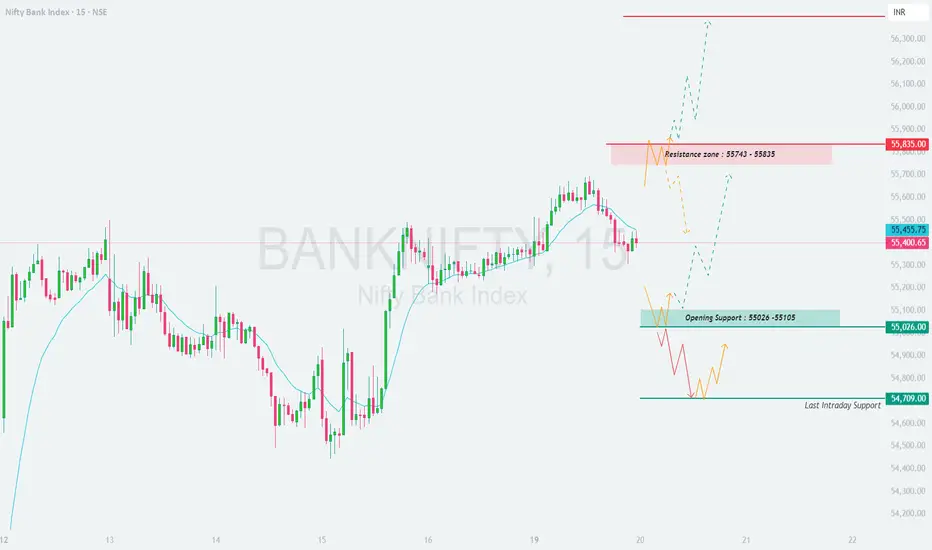
BANKNIFTY : Trading Levels and Plan for 20-May-2025📅 BANK NIFTY Trading Plan – 20th May 2025
🕒 Timeframe: 15-Minute | 🎯 Strategy: Price Action + Reaction Zones + Risk Management Principles
📌 Key Intraday Levels:
🔴 Resistance Zone: 55,743 – 55,835
🟦 Opening Support Zone: 55,026 – 55,105
🟫 Last Intraday Support: 54,709
📈 Scenario 1: GAP UP Opening (🔺 +200 points or more) – Opening Above 55,743
If Bank Nifty opens directly inside or above the resistance zone of 55,743–55,835 , it's crucial not to chase the move blindly. This zone can act as a strong supply area where profit-booking or shorting by institutions may occur.
Wait for a clear 15-minute candle close above 55,835 with strong momentum and volume to confirm breakout strength.
Once confirmed, target upside zones like 56,000 → 56,200+ can be achievable in intraday.
However, if Bank Nifty opens in the resistance zone and shows rejection (e.g., long upper wicks, bearish candles), this becomes a high-probability short setup back toward 55,600 → 55,450 .
Risk-to-reward is often unfavorable on immediate buying after a gap-up unless confirmation is present.
📌 Educational Tip: A gap-up into resistance isn’t a buy signal by default. It's a “wait & watch” zone. Let smart money reveal its hand.
⚖️ Scenario 2: FLAT Opening (Within ±100 points) – Between 55,300 – 55,500
A flat or minor gap opening inside the midpoint of the prior range creates a neutral setup, allowing for price discovery in either direction.
Avoid aggressive trades in the first 15–30 minutes. Wait for directional clarity.
A breakout above 55,743 with a strong candle can lead to an intraday up-move toward 55,835 → 56,000+ .
On the downside, a break below 55,300 can drag the index toward 55,100 → 55,026 .
Let price retest the support/resistance zone for safer risk-reward setups.
Consider using straddles or non-directional strategies if the index consolidates for 30–45 minutes with low volume.
📌 Educational Tip: Flat opens are common traps for impatient traders. Observe the first move, then plan the second move — it’s often more rewarding.
📉 Scenario 3: GAP DOWN Opening (🔻 -200 points or more) – Below 55,026
A gap-down below the opening support range (55,026–55,105) creates a bearish sentiment, but it must be confirmed with price action.
If price opens below 55,026 and sustains below 54,950 , a fall toward 54,709 (last intraday support) is highly probable.
Break below 54,709 with volume opens the path to 54,500 → 54,350 . Use this zone cautiously for fresh shorts only after confirmation.
Watch for possible bounce-back if price sharply reverses from 54,709 with a bullish pattern (like hammer or bullish engulfing). This could trigger a reversal toward 55,100+ .
Avoid bottom-fishing in the first 15 minutes unless you see solid reversal candles with volume confirmation.
📌 Educational Tip: Gap-downs into key support areas often fake breakdowns before a reversal. Only act when price confirms with conviction.
🛡️ Options Trading – Risk Management Tips:
✅ Define Maximum Risk: Only use capital you can afford to lose. Never go all-in on directional option trades.
✅ Avoid Illiquid Strikes: Stick to ATM/1-step ITM or OTM strikes with good liquidity to avoid slippage.
✅ Use Spreads to Your Advantage: Credit spreads (Bear Call, Bull Put) work well in rangebound days.
✅ Don’t Chase Premiums: Avoid overpaying for options after the move. Wait for cooling off or structure risk via spreads.
✅ Set SL on Premium Value: Instead of index, SL based on option premium value (e.g., 40–50% loss) improves consistency.
✅ Avoid Carrying Naked Trades Overnight: Especially on Fridays or before events. Use hedging (e.g., protective puts or calls).
📊 Summary & Action Plan:
🔼 Above 55,835: Bullish continuation zone → Target 56,000 – 56,200
🔄 Between 55,300 – 55,500: Neutral zone → Wait for breakout or breakdown
🔽 Below 55,026: Bearish sentiment → Watch for reversal at 54,709 or breakdown continuation
📌 Golden Rule: Let price show intent. Follow levels, not emotions. Never compromise on risk management.
📢 Disclaimer:
I am not a SEBI-registered analyst . The content above is purely for educational and informational purposes. Please do your own research or consult a registered financial advisor before taking any trading decisions.
BANKNIFTY : Trading Levels and Plan for 19-May-2025📅 BANK NIFTY Trading Plan – 19th May 2025
⏰ Timeframe: 15-Minute | 🧠 Methodology: Price Action + Risk-Reward Based Zones
🔍 Key Intraday Levels Based on Chart:
🟧 NO TRADE ZONE: 55,421 – 55,330
🟥 Last Resistance Band: 55,624 – 55,790
🟩 Opening/Last Intraday Support: 55,074 – 55,106
🟫 Breakdown Target Zone: Below 55,074 → 54,664
📈 Scenario 1: GAP UP Opening (🔺 200+ points above previous close) – Opening above 55,624 🚀
If Bank Nifty opens above 55,624 , we are entering the resistance zone right at open. Jumping into trades immediately can expose you to poor risk-reward due to overhead selling pressure.
Wait for a 15-minute candle to close strongly above 55,790 with strong volumes. This confirms breakout strength and can initiate a rally toward 56,100 → 56,300+ .
If the price enters the resistance zone (55,624–55,790) but fails to sustain or shows reversal patterns (like shooting star, bearish engulfing), you may consider short scalps back toward 55,500–55,420 .
Do not buy in excitement during initial 15 minutes. Let the market give a confirmation candle to avoid false breakouts.
📌 Educational Insight: Gaps near resistance levels are tricky. Always let the market confirm direction. The first pullback after breakout offers safer entries.
📉 Scenario 2: FLAT Opening (Within ±100 points of previous close) – Inside No Trade Zone (55,421–55,330) 🟧
A flat opening inside the "No Trade Zone" indicates indecision. This range often leads to choppy price action and low conviction moves.
Wait for a clear breakout above 55,421 or breakdown below 55,330 before entering.
A breakout above 55,421 with volume can lead to a quick move toward 55,624+ .
Breakdown below 55,330 opens the gate for a move toward the support zone at 55,074–55,106 .
Avoid trading within this range unless you are scalping based on high precision setups.
📌 Educational Insight: No Trade Zones are ideal for observing how smart money behaves. Allow price to resolve before acting. Avoid emotional trades in this zone.
📉 Scenario 3: GAP DOWN Opening (🔻 200+ points down) – Opening below 55,074 ⚠️
A gap-down opening below the support zone indicates weakness. However, this also puts the index near oversold territory, increasing chances of bounce or reversal.
If Bank Nifty opens below 55,074 , wait and see how it reacts near 54,664 , which is the next major support zone.
For fresh shorts, look for a breakdown below 54,664 with strong volume. This can lead to intraday moves toward 54,400–54,200 .
If Bank Nifty shows strong reversal signs from 54,664 zone (like bullish engulfing, hammer), you may look for a reversal trade back toward 55,000+ , but only after a 15-min confirmation candle.
📌 Educational Insight: Gap-downs into support zones often create high-risk emotional trades. Only act after confirmation to protect capital.
💡 Options Trading – Risk Management Tips:
🔹 Always define your maximum loss before entering an options trade.
🔹 Use spreads or hedged positions (like Bull Call Spread, Bear Put Spread) to reduce theta decay and premium erosion.
🔹 Avoid buying OTM options in a sideways or flat market. They decay faster.
🔹 If volatility (IV) is high, prefer selling premium with proper stop-loss over buying naked options.
🔹 Never carry directional trades overnight without hedging, especially on a Friday or before events.
📊 Summary:
✅ Above 55,790: Bullish continuation zone toward 56,100–56,300+
⚠️ 55,421–55,330: No Trade Zone – wait for direction
🔻 Below 55,074: Weakness may extend to 54,664–54,400
📌 Best Practice: Wait for the first 15–30 min candle. Focus on risk-reward, not just direction. Avoid forced entries in indecisive zones.
📢 Disclaimer:
I am not a SEBI-registered analyst . The views shared here are purely for educational purposes. Please do your own analysis or consult with a financial advisor before making any trading decisions.

Bank Nifty Weekly Technical Analysis for May 19–23, 2025
#Current Market Context
Latest Close (May 16, 2025): The Bank Nifty closed at 55,354.driven by strong performances in banking heavyweights like HDFC Bank, ICICI Bank, and SBI.
Recent Performance: The index has been volatile but bullish, breaking above the 55,700 mark for further Bullish, However, it faced resistance near 55,500, indicating profit-booking pressure.
Market Sentiment: Positive global cues (softening oil prices, US market gains, and a stronger Indian rupee at ~83.90) and domestic factors (government capex, strong credit growth) are supportive. However, global uncertainties (e.g., US Fed rate expectations, geopolitical tensions) and FII flow reversals pose risks.
#Technical Analysis
- Price Action and Trend
Current Trend: The Bank Nifty is in a uptrend within an ascending channel on the daily chart, reflecting bullish momentum. On the 4-hour chart, it recently broke out of a consolidation zone near 52,500–53,000, signalling potential for further upside if it sustains above 56,000.
Chart for your reference
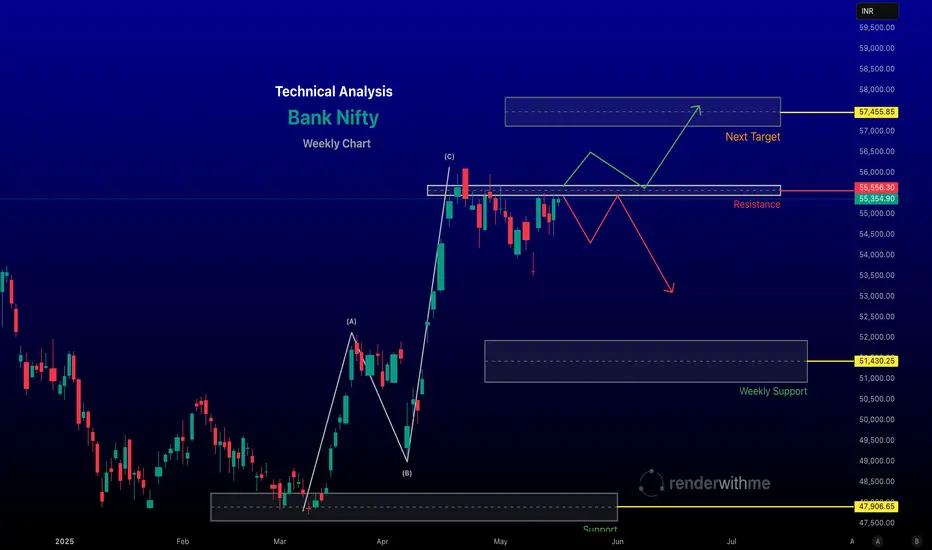
BankNifty #BankNifty Update:
As per the analysis shared on March 17, 2025, #BankNifty successfully held above the 100 WSMA and moved into the #TrendReversalZone . It decisively broke above the trend reversal level and previous swing highs, hitting an all-time high of 56,099. After a brief retracement to test the #BreakOut level, it is now on an upward trajectory.
Support Zones: 54,467 / 53,888 – 53,584
Looking ahead, we can expect #BankNifty to surpass the all-time high soon, with targets of 58,900 and 62,400 in the upcoming weeks.
