BANKNIFTY : Trading levels and Plan for 15-May-2025📘 BANK NIFTY TRADING PLAN – 15th May 2025 (15-Min Chart Structure)
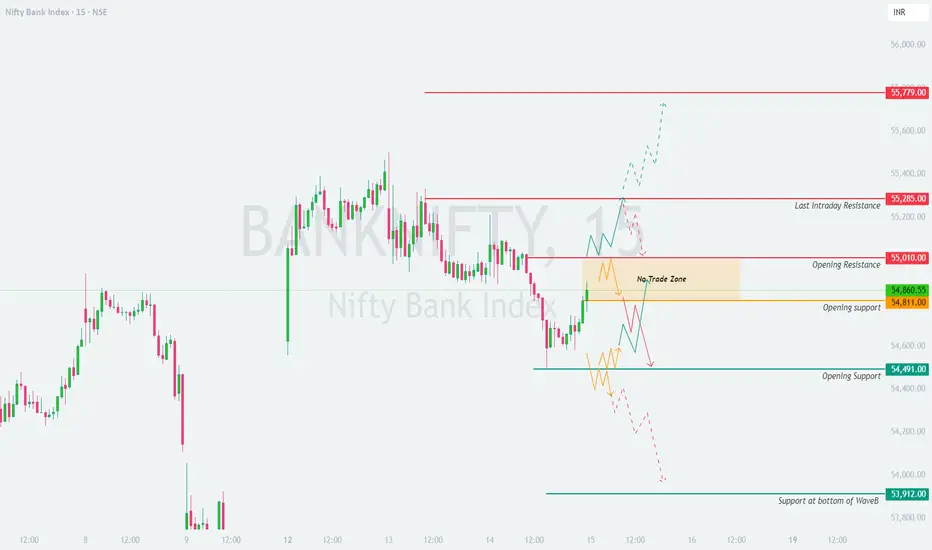
📍 Bank Nifty closed at 54,860.55 on 14-May-2025. It is currently positioned just below a critical Opening Resistance at 55,010 . There are multiple confluences and potential breakout/breakdown areas around this zone. Key support is visible at 54,491 , with a deeper demand zone around 53,912 (Wave B bottom).
A Gap Opening is considered to be ±200 points or more from the previous close.
🚀 SCENARIO 1: GAP-UP OPENING (Above 55,060)
(Gap up of 200+ points above last close)
If Bank Nifty opens above 55,060 , it will directly enter the Last Intraday Resistance Zone of 55,285–55,779 .
In such zones, the market either continues with momentum or reverses sharply — depending on early candle behavior.
Wait for the first 15–30 mins to let price action confirm direction.
If the index sustains above 55,285 with strong bullish candles, consider long entries with targets toward 55,600 and 55,779 . Stop-loss can be placed just below 55,150 .
If rejection or exhaustion patterns appear below 55,285 (like shooting star, bearish engulfing), prepare for short opportunities — especially if it re-enters below 55,010 , targeting 54,860 and 54,491 .
👉 📚 Educational Tip: Strong gap-ups near resistance often trap late buyers. Confirmation is key before jumping into a trade.
📊 SCENARIO 2: FLAT OPENING (Between 54,700 – 54,950)
(Minor move from the previous close)
This range includes both the Opening Support (54,811) and Opening Resistance (55,010) , making it a no-trade zone initially .
Let the price either give a clean breakout above 55,010 or breakdown below 54,491 .
For an upside breakout , wait for a candle close above 55,010 with follow-through volume. In that case, long trades may be initiated with a target of 55,285 and 55,600+ .
For a downside breakdown , wait for rejection near 55,010 followed by a fall below 54,811 — then short with a target of 54,491 and 54,300 .
Avoid getting chopped inside the 100-point range between 54,811–55,010 .
👉 📚 Educational Tip: When price trades in between two key levels, it's best to let the market pick a direction before acting. Avoid impulse trading.
🔻 SCENARIO 3: GAP-DOWN OPENING (Below 54,660)
(Gap-down of 200+ points)
If Bank Nifty opens below 54,660 , it likely heads toward Opening Support at 54,491 .
This is a crucial support zone. A breakdown below 54,491 can trigger further downside till 53,912 , which is the bottom of Wave B and a strong bounce zone.
Ideal strategy: Wait for a retest of 54,491 after breakdown. If price retests and rejects, short positions can be initiated with a stop-loss above 54,600 and targets of 54,200 and 53,912 .
If price bounces strongly near 53,912 with a reversal candle, consider buying for a reversion move to 54,400–54,600 .
Avoid fresh shorts near 53,912 without confirmation as it’s a previous buying zone.
👉 📚 Educational Tip: Never short blindly into a strong support zone. Look for candle patterns like morning star or bullish engulfing for reversal signs.
💡 OPTIONS TRADING & RISK MANAGEMENT TIPS:
⚠️ Avoid trading in the first 5–10 mins unless there’s a clear breakout/breakdown. Let the structure form.
🧠 Always define your maximum risk per trade (1–2% of capital) .
📈 Use ATM or slightly ITM options for better delta and less premium erosion.
🔁 Consider deploying spreads (like Bull Call or Bear Put) in volatile markets to limit loss.
⏳ Avoid holding OTM options post 2 PM — theta decay increases rapidly.
🚫 Do not average into losing trades. It’s better to exit and re-enter than hope for recovery.
👉 🧠 Pro Tip: Treat every trade like a business decision, not an emotional reaction. Risk control > accuracy.
📌 SUMMARY & CONCLUSION:
🔹 Opening Resistance Zone: 55,010 – 55,285
🔹 Opening Support Zone: 54,491 – 54,811
🔹 Major Support: 53,912 (Wave B bottom)
🔹 Momentum Above: 55,285 → Possible rally to 55,779
🔹 Breakdown Below: 54,491 → Potential fall to 53,912
🔹 Wait Zone: 54,811–55,010 (No clear trend)
Bank Nifty is at a decision point. The next 15-minute structure post-open will define the day’s trend. Focus on high-probability setups around breakout or breakdown zones and protect your capital at all costs.
⚠️ DISCLAIMER:
I am not a SEBI-registered analyst . This trading plan is purely for educational and informational purposes . Please consult your financial advisor or do your own research before taking any trades. Markets carry risk — trade responsibly.
Bankniftyanalysis
BANKNIFTY : Trading levels and plan for 14-May-2025📊 BANK NIFTY TRADING PLAN – 14th May 2025 (15-Min Chart Analysis)
Bank Nifty closed at 54,964 on 13-May-2025. Price action is currently consolidating just above a critical support zone of 54,789–54,836 . The next move will be determined by the market open — whether it gaps up, opens flat, or gaps down. Read carefully to plan your entries and exits accordingly.
🟢 SCENARIO 1: GAP-UP OPENING (Above 55,164)
(Gap-up of 200+ points from previous close)
If Bank Nifty opens above 55,164 , it enters the Opening Resistance zone of 55,118–55,334 , a key supply area where sellers have shown strength previously.
In this scenario, wait for the first 15–30 minutes to observe if the resistance is respected or breached.
If price sustains above 55,334 with strong bullish candles, it could lead to a breakout rally toward higher levels like 55,600+ . You may consider going long above 55,334 with a stop-loss below 55,180.
If price shows rejection (long upper wicks, bearish engulfing, etc.) around 55,118–55,334 , reversal trades may offer shorting opportunities with targets of 54,920 – 54,836 .
Avoid aggressive call buying at open. Wait for structure confirmation to avoid bull traps.
👉 Educational Tip: Gap-ups near known resistance zones often get faded. Let the price stabilize before taking positions.
🟨 SCENARIO 2: FLAT OPENING (Between 54,764 – 55,164)
(Open within ±200 pts from previous close)
A flat opening puts Bank Nifty inside a well-defined range between Opening Resistance at 55,118 and Opening Support at 54,789–54,836 .
If the price opens in this zone, avoid impulsive entries during first 15 minutes . Observe where structure forms — higher highs or lower lows.
Upside momentum can be expected only above 55,118 with confirmation. In that case, the target can be 55,334 , and stop-loss below breakout candle.
On the downside, if price breaches and sustains below 54,789 , it may retest 54,492 , which is the Last Intraday Support . You may go short on this breakdown with SL above 54,850.
Sideways price action may persist within 54,800–55,100. Avoid overtrading in a choppy zone.
👉 Educational Tip: Most false breakouts occur inside tight consolidation zones. Let the structure define your bias, not your emotions.
🔻 SCENARIO 3: GAP-DOWN OPENING (Below 54,764)
(Gap-down of 200+ points from previous close)
Gap-down opens below Opening Support zone (54,789–54,836) indicate weakness and may invite follow-through selling pressure.
If the index opens below 54,764 and sustains below 54,700 , then shorting opportunities arise with potential targets of 54,492 (Last Intraday Support) .
Any bounce toward 54,750–54,800 that gets rejected can be a selling opportunity. Look for bearish reversal candles to confirm.
If price reverses from 54,492 with strong demand, you can attempt counter-trend long trades, but with strict SL below 54,450 .
Be cautious during the first 5-minute candle after gap-down. Let volatility settle before taking positions.
👉 Educational Tip: Gap-downs are high-risk zones for option buyers. Wait for reversal structure or continuation confirmation to avoid emotional trades.
💡 RISK MANAGEMENT & OPTIONS TRADING TIPS:
Trade near-the-money (ATM or slightly ITM) options to control premium decay.
Avoid buying deep OTM options unless a clear trending move is confirmed.
Keep your risk limited to 1–2% of your trading capital on each trade.
Always trade with a defined stop-loss , preferably below a key candle or structure.
Use alerts on key levels (55,334 / 55,118 / 54,789 / 54,492) to avoid missing breakout opportunities.
Do not average your losing positions. Stick to your original risk plan.
👉 Pro Tip: It’s better to miss a trade than to be stuck in a wrong one. Precision matters more than frequency.
📌 SUMMARY & CONCLUSION:
🔸 Resistance Zones: 55,118 and 55,334
🔸 Support Zones: 54,789–54,836 and 54,492
🔸 Breakout Confirmation: Above 55,334
🔸 Breakdown Confirmation: Below 54,789
🔸 No Trade Zone: 54,836–55,118 (avoid impulsive entries)
The price structure suggests that Bank Nifty is at a short-term inflection zone. The safest trades will come from confirmation breakouts or breakdowns outside of the current tight range. Patience and discipline will define your edge tomorrow.
⚠️ DISCLAIMER:
I am not a SEBI-registered analyst . This trading plan is intended purely for educational purposes. Traders must do their own analysis or consult with a SEBI-registered advisor before making any financial decisions. Trade at your own risk using proper risk management.

BANKNIFTY : Trading Levels and Plan for 13-May-2025📊 BANK NIFTY TRADING PLAN – 13th May 2025 (15-Min Chart-Based Strategy)
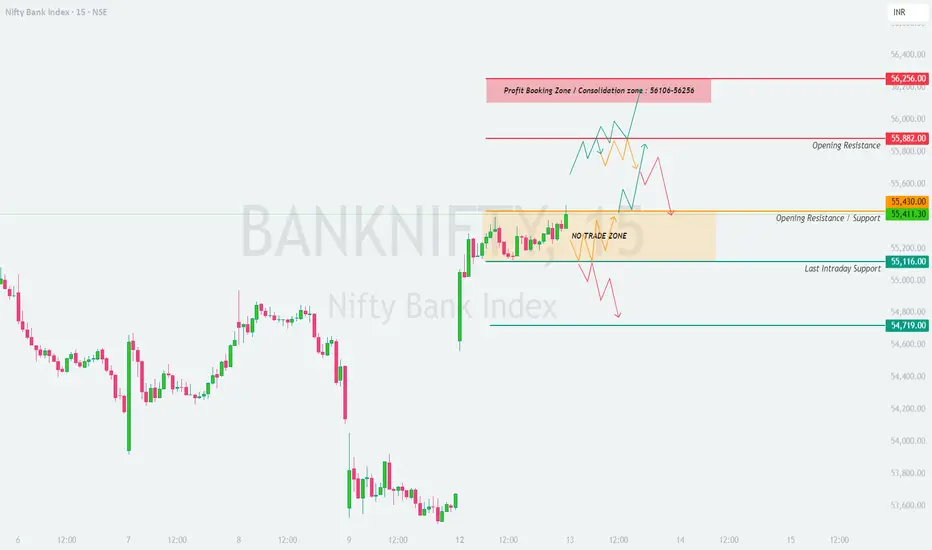
Bank Nifty closed at 55,411 on 12-May-2025. Price action has formed a tight range between 55,116 and 55,430 , marking this as the “No Trade Zone” unless a breakout or breakdown is confirmed.
Let’s analyze each type of possible opening scenario for the next session:
🟢 SCENARIO 1: GAP-UP OPENING (Opening Above 55,611)
(200+ points gap-up from previous close)
A gap-up above the Opening Resistance level of 55,430 pushes price into the Profit Booking Zone – 56,106 to 56,256 . This is a critical area that can either act as a supply zone or fuel a strong continuation.
Opening above 55,611 but within the 56,106–56,256 zone calls for caution. Avoid early entries; this is a potential reversal or profit-booking zone.
If Bank Nifty sustains above 56,256 , one can consider a breakout trade toward 56,500+ with a tight SL below 56,100.
If rejection candles (like shooting star, bearish engulfing) form at the zone top, then a short trade may be initiated for targets near 55,882 – 55,430 .
Best risk-reward trade setup: Wait for a retest of 55,882 (Opening Resistance). If support holds, enter long with SL below 55,800.
Aggressive shorting is only favorable if breakdown happens below 56,106 after failing at 56,256.
👉 Tip: Don’t chase the gap-up. Let price confirm strength or weakness before entry. Watch volume near resistance zones.
🟨 SCENARIO 2: FLAT OPENING (Between 55,116 – 55,430)
(Open within previous close ±200 pts)
This region is now a NO TRADE ZONE due to low conviction and trapped volume from previous sessions.
Avoid initiating trades inside 55,116 – 55,430 unless a breakout or breakdown is confirmed on a 15-min candle close with follow-through volume.
Bullish scenario activates above 55,430 – expect momentum toward 55,882 , then 56,106 .
Bearish setup triggers only if price breaks below 55,116 ; the next support lies at 54,719 .
Within this range, wait for market structure (like higher highs/lows or breakdowns) to develop before acting.
Fakeouts are common in this range – always use SL based on structure.
👉 Tip: Let the first 15–30 minutes pass. Observe how price behaves near the edges of the “no trade zone” before committing.
🔻 SCENARIO 3: GAP-DOWN OPENING (Below 54,719)
(200+ points gap-down from previous close)
A gap-down below 54,719 puts pressure on bulls and may induce panic selling if the breakdown is supported by volume.
If a strong bullish reversal candle (like hammer or morning star) forms near 54,500–54,600 , consider a quick long trade toward 55,116 with SL just below reversal low.
If price sustains below 54,719 and fails retest, one can look for a short trade with targets toward 54,300 – 54,000 .
Avoid catching falling knives – let reversal patterns confirm before long entries.
Intraday bounce from oversold levels is possible but stay nimble and trail SL.
Watch for short-covering if market quickly reclaims 54,719 – this may offer sharp rallies.
👉 Tip: Don’t trade emotionally after a gap-down. Use structure-based stop loss and manage risk tightly.
💡 OPTIONS TRADING – RISK MANAGEMENT TIPS:
Trade near-the-money or slightly in-the-money options for better delta and lesser time decay.
Avoid buying far OTM options unless breakout/breakdown is very strong.
Always keep SL based on underlying levels, not premium alone.
Use a fixed % of your capital per trade (max 2–3% risk).
Don’t overtrade – wait for directional clarity before entering.
Protect capital first – profit is a by-product of discipline.
📌 SUMMARY & CONCLUSION:
Key Levels:
🔸 Resistance Zone: 55,430 – 55,882
🔸 Profit Booking Zone: 56,106 – 56,256
🔸 Support Levels: 55,116 and 54,719
🔸 Breakout Zone: Above 55,611
🔸 Breakdown Zone: Below 54,719
🔸 NO TRADE ZONE: 55,116 – 55,430
This is a reaction-based market – wait for price to move out of tight consolidation and follow with proper structure. Use pre-marked zones to anticipate market behavior and don’t assume direction without confirmation.
Trade only if the plan aligns with live price action.
⚠️ DISCLAIMER:
I am not a SEBI-registered analyst . This trading plan is shared purely for educational purposes. Please consult your financial advisor before making any investment or trading decisions. Risk management and personal discretion are advised.
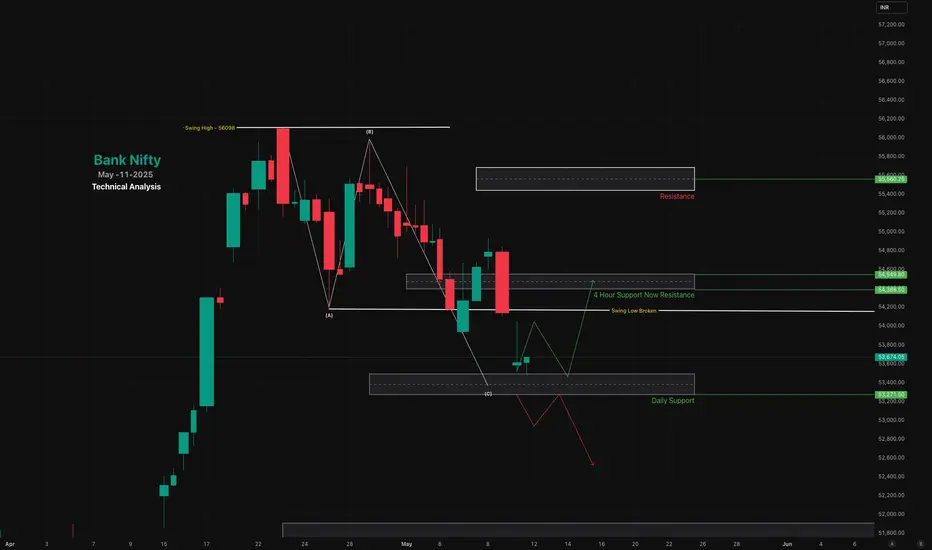
Bank Nifty Prediction Tomorrow and Weekly Update 📈 Bank Nifty Weekly View (Post Indo-Pak Tension Relief)
Now that the war-like tension between India and Pakistan has de-escalated, market sentiment seems to be stabilizing — and this could reflect in Bank Nifty’s movement as well.
Key Levels to Watch:
Support: 53594.90
If this level holds, there’s a strong possibility of upward momentum.
Resistance: 54268.85
This would be the immediate target if a bullish breakout occurs.
Pending Demand Zone: 52441.25
Keep in mind, this is a major demand zone that still hasn’t been tested. If weakness returns, a correction toward this level is possible.
🧭 Possible Scenarios:
🔻 Gap-Down Opening (Low Probability):
Since geopolitical tensions have eased, chances of a gap-down opening are low. But if it happens, the market may remain range-bound throughout the day.
🔺 Gap-Up Opening (High Probability):
If the market opens with a gap-up on the back of positive cues, we could see a strong upward move toward 54268.85.

BANKNIFTY - Trading levels and Plan for 12-May-2025📉 BANK NIFTY Trading Plan – 12th May 2025 (15-Min Chart Analysis)
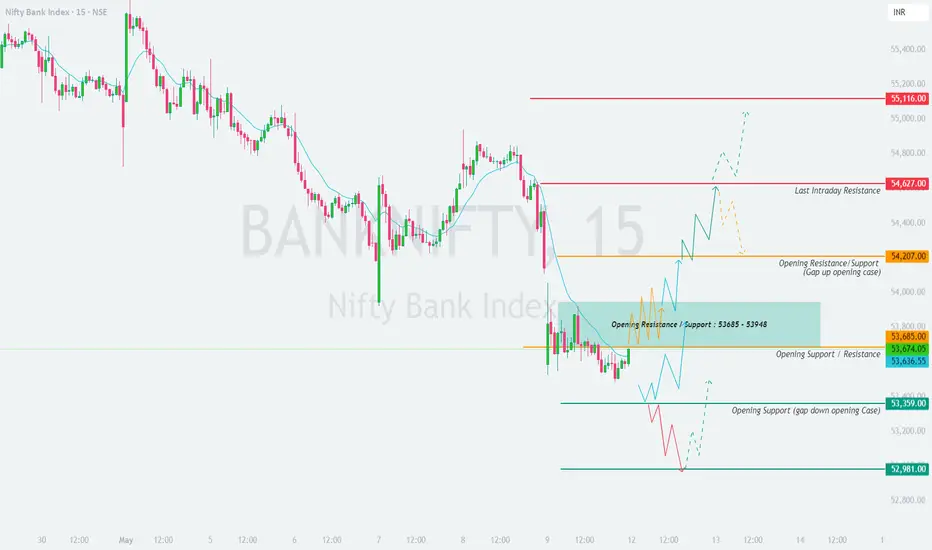
Bank Nifty closed near 53,674 . The chart shows well-identified support and resistance zones. As per our standard, a gap opening is considered when the index opens 200+ points away from the previous close .
Let's go through the action plan based on three different opening scenarios with strategic insights and disciplined approach 👇
🟢 SCENARIO 1: Gap-Up Opening (Above 53,948 – 54,207)
If Bank Nifty opens with a 200+ points gap up above the Opening Resistance Zone of 53,685 – 53,948 and sustains above 54,207 , bullish sentiment may dominate the session.
Watch for early rejection or acceptance near 54,207 (Resistance/Support) . A strong bullish 15-min candle above this level may trigger a long entry.
Upside target could be 54,627 (Last Intraday Resistance) , followed by 55,116 if momentum continues.
Entry Plan: Wait for retest of 54,207 after the breakout – look for bullish confirmation candle.
Stop Loss: 🔻 Place SL just below 54,000 or on hourly close below 54,207.
Avoid long entries if price fails to hold above 53,948, as it may signal a weak gap-up.
👉 Let the price stabilize for first 15–30 minutes before initiating trades to avoid trap moves.
🟨 SCENARIO 2: Flat Opening (Between 53,636 – 53,685)
A flat opening keeps us within the current indecisive zone. This area is likely to offer choppy moves in the first session of the day.
Observe price movement between 53,636 (Opening Support/Resistance) and 53,685 .
A breakout above 53,685 – 53,948 may open the door for a bullish move towards 54,207 .
Bearish scenario unfolds only if price sustains below 53,636 , heading toward 53,359 .
Wait for a breakout or breakdown from this tight range before jumping into the trade.
No trade zone: Inside 53,636 – 53,685 with low volume and weak candles.
👉 Best approach here is to let the market pick a direction. Only then act with confirmed breakouts.
🔻 SCENARIO 3: Gap-Down Opening (Below 53,359)
If Bank Nifty opens with a significant gap down (200+ points) and trades below 53,359 , we shift focus to the 52,981 Support Zone .
Watch for reversal signals near 52,981 – this level may provide a strong intraday bounce.
Reversal pattern like hammer or bullish engulfing can offer low-risk long entry.
If breakdown continues below 52,981 , downside may stretch towards 52,800 – 52,600 .
Avoid aggressive shorting without confirmation below 52,981, as a short-covering rally can trap weak hands.
Preferred strategy: Wait for price to either break 52,981 or give reversal signal.
👉 Patience is key. Don’t catch falling knives; let the structure build and respond with tight risk control.
📘 Options Trading Risk Management Tips 🧠
Avoid trading deep OTM options, especially on flat days – time decay can hurt fast.
Trade near ATM or slightly ITM options for better risk-reward and delta advantage.
Use proper stop-loss based on candle close (15-min or hourly) , not based on emotions.
Always define your risk per trade (preferably 1–2% of capital only).
Avoid revenge trading. Missing a trade is better than forcing one.
Trail profits when in favor. Don’t wait for exact targets to exit profitable trades.
📌 Summary & Conclusion:
Key Zones for the Day:
🔸 Opening Resistance Zone: 53,685 – 53,948
🔸 Gap-Up Resistance Support: 54,207
🔸 Last Intraday Resistance: 54,627
🔸 Major Resistance: 55,116
🔸 Opening Support Zone: 53,636 – 53,359
🔸 Gap-Down Support: 52,981
This is a classic range-to-breakout setup. Let price settle and show direction near marked levels . Don’t pre-empt; react with discipline and proper confirmation.
⚠️ Disclaimer:
I am not a SEBI-registered analyst. The above views are purely for educational purposes. Please consult your financial advisor before making any trading decisions. Trade responsibly.
The Bank Nifty index, shows both side movement# Support and Resistance Levels:
Support: 53,500, 53,200, 53,000 (short-term)
Resistance: 54,400, 54,500, 55,800 (short-term)
Pivot levels for May12 were around 54,405, acting as a key decision point.
A break below 55,500 could target 55,800 or 52,600
Chart for your reference
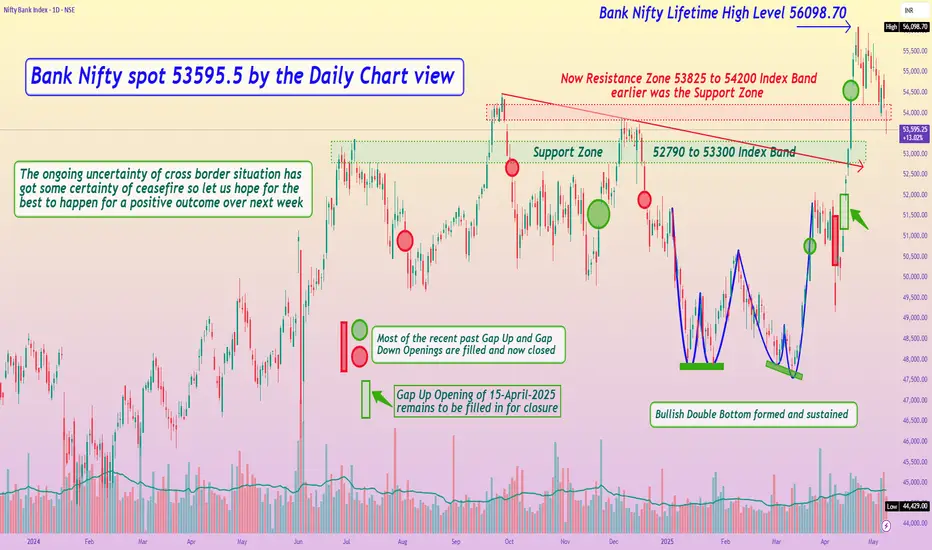
Bank Nifty spot 53595.5 by Daily Chart view - Weekly UpdateBank Nifty spot 53595.5 by Daily Chart view - Weekly Update
- Support Zone 52790 to 53300 Index Band
- Now Resistance Zone 53825 to 54200 Index Band earlier was the Support Zone
- *The ongoing uncertainty of cross border situation has got some certainty of ceasefire so let us hope for the best to happen for a positive outcome over next week*
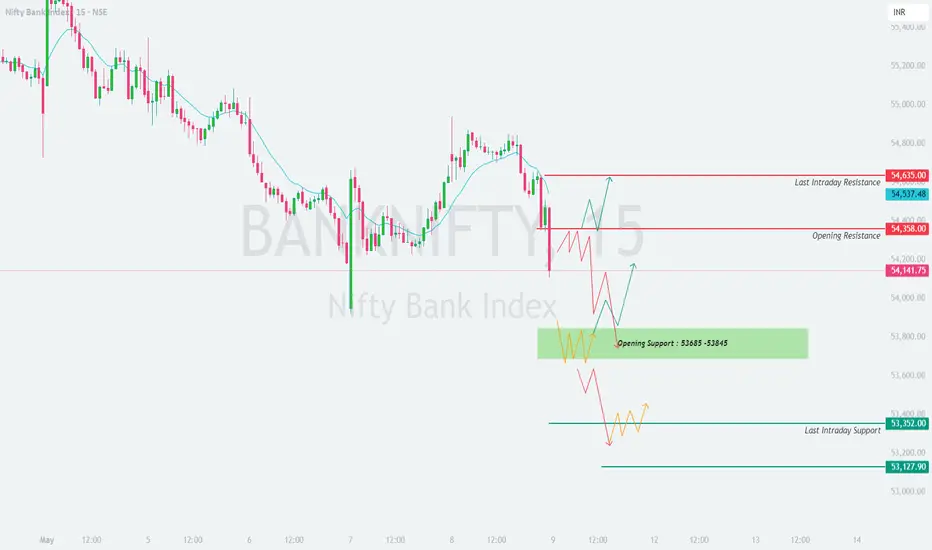
BANKNIFTY : Trading levels and Plan for 09-May-2025📅 Bank Nifty Trading Plan for 09-May-2025
🕘 Timeframe: 15-minute chart
📊 Structure Analysis: Bearish price action observed with a sharp sell-off post resistance test. Price is currently below both the 9-EMA and major resistance levels.
Opening Scenarios: 📈📉
🔺 Gap-Up Opening (200+ points above previous close): Potential open above 54,350
If Bank Nifty opens with a gap-up above the Opening Resistance (54,358) , the index may test the next resistance at 54,635 (Last Intraday Resistance) . However, since the broader structure is weak, aggressive longs should only be considered if the price sustains above 54,635 with strong volume confirmation.
✅ Action Plan:
Wait for 15–30 minutes for price stabilization.
If price sustains above 54,635, consider CE options with a tight SL below 54,500.
If the gap-up gets sold off and the index trades below 54,358 again, look for PE opportunities targeting 54,100–54,000 levels.
📌 Avoid chasing the open blindly. Wait for a clear breakout-retest pattern for confirmation.
➖ Flat Opening (within ±200 points): Near 54,100
A flat opening near the CMP of 54,141 places the index right between major resistance and a key support zone. It could be a volatile zone with whipsaws on both sides.
✅ Action Plan:
Observe price behavior near 54,358 .
A rejection at this level can lead to selling pressure toward the Green Support Zone (53,685–53,845) .
A breakout and hold above 54,358 could lead to a rally toward 54,635.
Ideal play here is range-based trading : Buy near support (if price confirms reversal), Sell near resistance.
💡 Use options with delta closer to 0.5 for better reward if price remains rangebound.
🔻 Gap-Down Opening (200+ points below previous close): Below 53,900
A gap-down near or below the Opening Support Zone (53,685–53,845) suggests bearish continuation. If this zone fails to hold, the index could slide toward the next support at 53,127 .
✅ Action Plan:
Watch for reversal patterns in the support zone (e.g., hammer candle, bullish engulfing).
If reversal is confirmed, consider aggressive CE trades with a SL just below 53,685.
If 53,685 breaks decisively, ride the trend using PE options, targeting 53,127.
Do not attempt to catch the falling knife unless clear bullish patterns form.
📛 Protect capital by avoiding counter-trend trades in panic selling.
🛡️ Risk Management Tips for Options Traders
💡 Always use defined stop-loss , especially when trading naked options.
💰 Do not risk more than 2% of your capital per trade .
📅 Avoid holding weekly options till expiry if VIX is rising – time decay and volatility swings can hurt.
📉 Avoid averaging losers – better to re-enter on confirmation.
🔎 Use OI data and volume breakouts to time entries on options.
📌 Summary & Key Levels to Watch:
🔺 Major Resistance Zones: 54,358 → 54,635
🟩 Support Zone: 53,685–53,845
🔻 Breakdown Level: Below 53,685 may trigger a fall toward 53,127
📍 CMP: 54,141.75 – stuck in a volatile zone, so direction will likely emerge after 15–30 min of opening.
📢 Disclaimer:
I am not a SEBI-registered analyst . This analysis is shared for educational purposes only. Please do your own research or consult a financial advisor before making any trading decisions
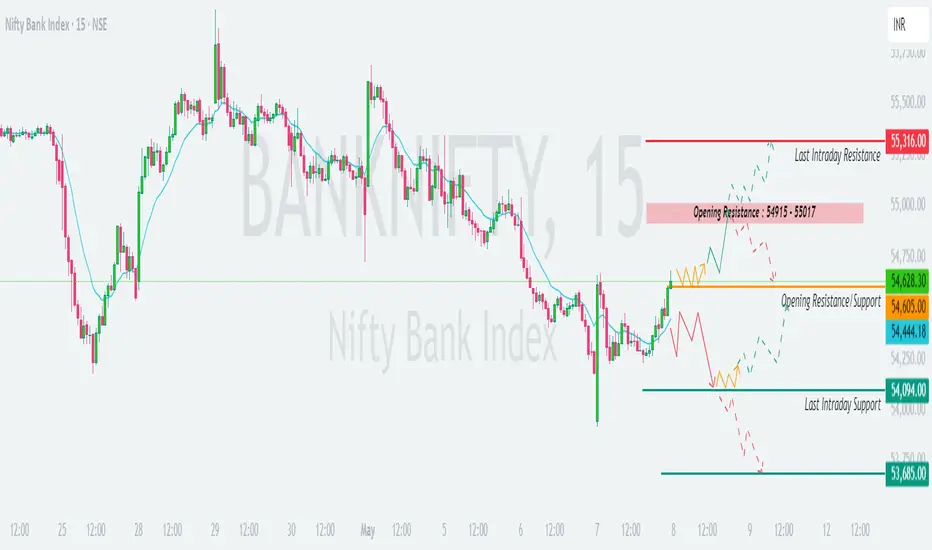
BANKNIFTY : Trading Levels and Plan for 08-May-2025📊 Bank Nifty Trading Plan for 8-May-2025
Timeframe: 15-Min | Previous Close: 54,628.30
📍 Key Technical Levels to Monitor:
🔴 Last Intraday Resistance: 55,316
🟥 Opening Resistance Zone: 54,915 – 55,017
🟧 Opening Support/Resistance Level: 54,605
🟦 Minor Support: 54,444
🟩 Last Intraday Support: 54,094
🟢 Major Support Zone: 53,685
🟢 1. Gap-Up Opening (📈 200+ Points Up, i.e., Opening above 54,800)
If Bank Nifty opens above 54,800, ideally near or within the Opening Resistance Zone (54,915–55,017):
✅ Plan of Action:
- Wait for the first 15–30 mins to let market structure evolve; avoid impulsive trades.
- If price sustains above 55,017 with a strong 15-min bullish candle, potential upside towards 55,316 may open up.
- A pullback entry near 55,000 can be attempted if bullish structure is maintained, with SL below 54,915.
- However, if price shows strong rejection (long wicks, bearish engulfing) in this zone, short trades can be taken for a retest of 54,605 and possibly 54,444.
📝 Educational Insight: Opening into resistance zones often creates traps—watch for confirmation before jumping in. Always trade post-retest or breakout.
🟡 2. Flat Opening (📉📈 Between 54,428 – 54,828)
If Bank Nifty opens around the previous close (±200 points), i.e., between 54,428 – 54,828:
✅ Plan of Action:
- First 30-minute range will be crucial. Mark its high and low to define breakout zones.
- Sustained price above 54,605 opens the path towards 54,915. Breakout above that leads to 55,316.
- On the downside, if price slips below 54,444, look for short entries with SL above 54,605 and targets around 54,094 or even 53,685 on momentum.
- False breakouts are common during flat opens—validate breakout with volume and follow-up candles.
📝 Educational Insight: Flat opens are best traded using "break of initial balance" logic. Avoid bias—let the price give the clue.
🔴 3. Gap-Down Opening (📉 200+ Points Down, i.e., Opening below 54,400)
If Bank Nifty opens below 54,400, especially near or below the Last Intraday Support (54,094):
✅ Plan of Action:
- Watch for reaction at 54,094. If the index holds and forms a base, intraday reversal trades toward 54,444 can be considered.
- If support fails and a 15-min candle closes below 54,094, initiate short positions targeting 53,685 (major support zone).
- Avoid long trades unless a bullish reversal pattern (like double bottom or hammer) is confirmed with volume.
📝 Educational Insight: Gap-downs below structure support often induce panic selling. But remember—sharp gaps can also reverse sharply, so let price action confirm before acting.
🛡️ Options Trading Risk Management Tips:
📏 Position sizing is key: Risk only 1–2% of capital on a single trade.
🔒 Avoid naked option buying post 11:00 AM unless clear trend develops.
🛠️ Use hedged strategies like Bull Call Spreads or Bear Put Spreads to manage theta decay.
⏳ Always set a time-based stop-loss (e.g., exit by 2:30 PM if target isn’t hit).
📉 Don’t average losers. Accept SL and re-enter only when structure rebuilds.
📌 Summary & Conclusion:
Bank Nifty is positioned at a critical juncture, with 54,915–55,017 acting as immediate resistance and 54,094–53,685 as layered support.
For Gap-Up openings , focus on resistance reaction near 55,000+.
For Flat opens , the first 30-minute range will act as the trade zone.
For Gap-Down scenarios , respect the support zone near 54,094 and look for confirmation before catching falling knives.
Stick to risk-defined strategies in options to protect capital and stay in the game longer.
📢 Disclaimer:
I am not a SEBI-registered analyst. The above analysis is shared purely for educational purposes. Please consult your financial advisor before making any trading or investment decisions.
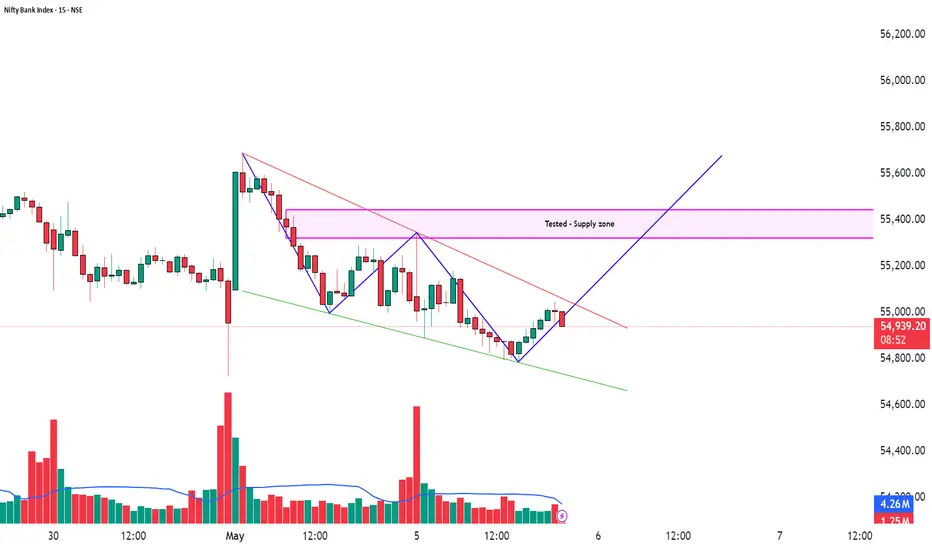
Falling Wedge Breakout with Bullish Momentum | 15-Min Chart🏦 BANK NIFTY – Falling Wedge Breakout with Bullish Momentum | 15-Min Chart
📅 Date: May 5, 2025
📈 Timeframe: 15-Minute
🔍 Instrument: Nifty Bank Index (NSE)
📌 Technical Overview:
Bank Nifty is currently showing signs of a short-term bullish reversal on the 15-minute chart. The index formed a classic falling wedge pattern, which is typically seen before upward price moves. A recent breakout attempt is seen from the wedge structure, supported by steady green candles and slight volume recovery.
🧩 Chart Pattern:
The Falling Wedge is marked by two converging green trendlines.
Inside the wedge, the price made lower highs and lower lows, forming a compact structure.
The breakout leg is forming with strength and is approaching a tested supply zone around 55,350–55,450.
🔍 Key Price Levels:
Support Zone: ~54,800 (Lower boundary of the wedge)
Immediate Resistance: ~55,350 (Tested supply zone)
Current Market Price (CMP): 55,001.65
If the price sustains above 55,070 and breaks out with volume, we may see bullish continuation toward 55,350–55,600.
📊 Volume Analysis:
Volume remained low during the wedge formation – a healthy sign.
A volume breakout confirmation is awaited.
Keep an eye on a green volume bar spike as price crosses wedge resistance.
🧠 Observational Bias:
As long as price holds above 54,800, the short-term bias remains bullish.
A successful retest of the breakout zone or a strong close above 55,070 with volume may offer a high-probability intraday opportunity.
📌Note: Traders can wait for a confirmation candle (close above wedge) before entering.
Risk management is key—keep stop loss below 54,800.
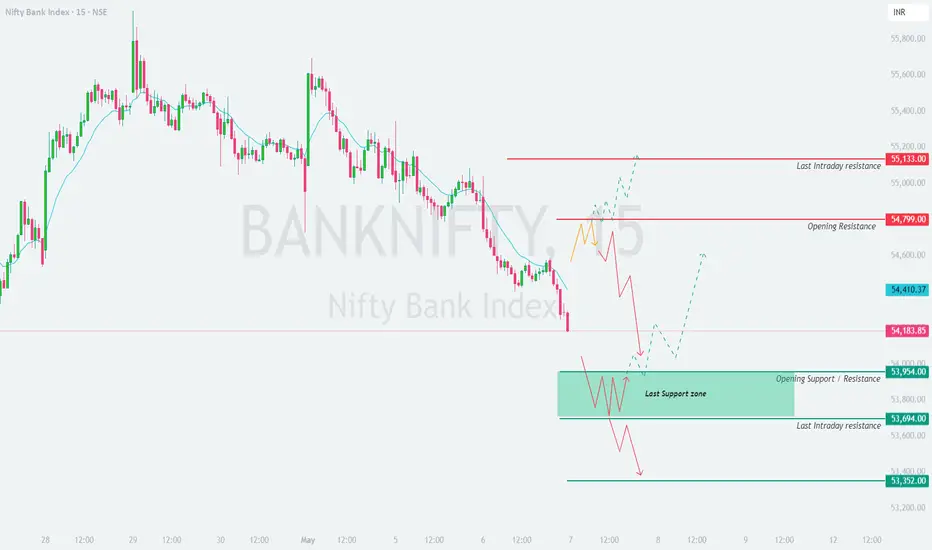
BANKNIFTY : Trading Levels and Plan for 07-May-2025📊 Bank Nifty Trading Plan for 7-May-2025
Timeframe: 15-Min | Reference Closing: 54,183.85
📍 Key Levels to Watch:
🔴 Opening Resistance: 54,799
🔴 Last Intraday Resistance: 55,133
🟢 Opening Support Zone: 53,954 – 53,694
🟩 Last Intraday Support: 53,352
🔵 Reference Price Zone: 54,410 (Potential retest/rejection zone)
🟢 1. Gap-Up Opening (📈 200+ Points Above)
If Bank Nifty opens above 54,400–54,500, ideally around or above the Opening Resistance at 54,799:
✅ Plan of Action:
- Wait for the first 15–30 mins to let price settle.
- If price sustains above 54,799 on 15-min candle close, we may see a push towards 55,133 (last intraday resistance).
- Use a pullback entry strategy near 54,800 with a stop-loss just below 54,650 for a target of 55,100+.
- Avoid aggressive longs if opening is too close to 55,133 as the risk-reward becomes poor.
🚫 Caution:
- If price rejects 54,799 with selling wicks, it may pull back sharply towards 54,400 or even 54,183.85.
📝 Strategy Tip: Look for rejection candles (like inverted hammers) to confirm weakness at resistance.
🟡 2. Flat Opening (Within ±200 Points of Previous Close)
If Bank Nifty opens between 53,984 – 54,384:
✅ Plan of Action:
- Let the first 15–30 mins play out and observe how price reacts to 54,410 and 54,799 levels.
- If price sustains above 54,410, intraday bulls can push towards 54,799. A breakout above that opens room for 55,133.
- If 54,410 acts as resistance, short positions can be initiated with a stop-loss of 54,500 and target towards 54,000 → 53,954.
- Break below 53,954 could bring prices into the green support zone (53,954–53,694).
📝 Strategy Tip: During flat openings, range breakout strategy works well—mark the first 30-min high/low.
🔴 3. Gap-Down Opening (📉 200+ Points Below)
If Bank Nifty opens below 53,983, especially near or below 53,694:
✅ Plan of Action:
- Observe whether price takes support near 53,694–53,352 zone.
- If there's consolidation in this zone (watch for base formation or higher lows), reversal trades can be considered with small risk for a bounce towards 53,950+.
- Breakdown below 53,352 on strong red candles could extend the fall. Use trailing stops on shorts.
- Aggressive traders may go short on breakdown with SL above 53,500 for a 100–150 point move.
📝 Strategy Tip: Gap-downs often trap late shorts—look for price acceptance vs rejection in support zones before entering.
⚠️ Options Trading Risk Management Tips:
💡 Always define your maximum loss per trade —use 1–2% of your capital rule.
🧯 Avoid over-leveraging in weekly expiries, especially on volatile days.
🛑 Use hedged strategies like Spreads (Bull Call, Bear Put) to reduce premium decay and risk.
📉 Don't chase deep OTM options post 12 PM unless there's strong directional confirmation.
📊 Stick to your plan—discipline matters more than prediction in options trading.
📌 Summary & Conclusion:
Bank Nifty is trading near a critical support area.
Price action around 53,954–53,694 will decide the trend if there's a gap-down.
A gap-up above 54,799 needs strength to target 55,133; otherwise, expect a pullback.
In flat openings, first 30-min range will act as intraday decision maker.
📚 Educational Takeaway: Plan your trades with levels but let the price action confirm your bias. React, don’t predict.
📢 Disclaimer:
I am not a SEBI-registered analyst. The above views are for educational purposes only. Please consult your financial advisor before making any trading or investment decisions.
BANKNIFTY : Trading levels and Plan for 06-May-2025📅 BANK NIFTY 15-Min Trading Plan for 6-May-2025
(Gap Opening Consideration: 200+ Points | Price Structure & Level Oriented | Educational Purpose Only)
📍 Previous Close: 54,907
📌 Key Price Zones to Watch:
🔴 Opening Resistance: 55,371
🔺 Last Intraday Resistance Zone: 55,730 – 55,806
🚀 Breakout Target Zone: 55,938+
🟧 Opening and Last Support Zone: 54,644 – 54,751
🟩 Buyer's Strong Demand Zone: 53,949 – 53,692
🟥 Scenario 1: Gap-Up Opening (Above 55,371) 🚀
If Bank Nifty opens above 55,371, it enters the "Opening Resistance" zone. This zone previously saw aggressive selling and may again attract supply.
Allow the first 15 minutes to complete—watch if price sustains above 55,371 or shows rejection signs (long wicks, inside bars, etc.).
If price sustains above 55,371, expect a gradual move toward the 55,730–55,806 zone. This is the Last Intraday Resistance and a critical decision-making level.
Strong volume and price action above 55,806 can invite breakout buying, targeting 55,938.
Be cautious of reversal traps if price opens above 55,371 but quickly slips below it—this could trigger a quick sell-off toward 54,949 – 54,751 support levels.
📚 Educational Insight: Gap-ups into resistance zones need confirmation of strength. Don't chase blindly—wait for price to sustain above supply areas with volume confirmation.
🟨 Scenario 2: Flat Opening (Between 54,949 – 54,644) ⚖️
A flat open within this zone places Bank Nifty in a neutral territory, where both buyers and sellers are likely to test each other.
If price holds above 54,949 and breaks past 55,371, we can expect bullish continuation toward 55,730+ levels.
On the contrary, if the index fails to hold 54,949 and slips below 54,751, it could test the deeper support zone of 54,644.
Any breakdown below 54,644 may trigger a bearish leg targeting the next key support near 53,949 – 53,692, especially if accompanied by momentum and volume.
Be ready for range-bound moves if price gets trapped between 54,949 – 54,644. Use breakout/rejection setups to your advantage.
📚 Educational Insight: Flat opens near support zones provide high risk-reward plays. Let the structure unfold before committing to a direction—watch for wick rejections and candle body closures.
🟩 Scenario 3: Gap-Down Opening (Below 54,644) 📉
A gap-down below 54,644 directly puts price near the Buyer's Support Zone of 53,949 – 53,692.
Avoid shorting blindly into this zone—this is where bulls could stage a comeback, especially if Bank Nifty forms reversal candles like hammers or bullish engulfing patterns.
A confirmation reversal from this zone can be a low-risk buying opportunity with stop loss just below 53,692 and a bounce target back to 54,644 – 54,751.
If price decisively breaks and sustains below 53,692, it may open doors for a fresh downside leg and panic selling—such breakdowns should only be played if volume supports the move.
Ideal strategy in this zone is "wait and react"—watch for bullish signals before buying, or breakdown confirmation before shorting.
📚 Educational Insight: Gap-downs into strong demand zones often create the best intraday bounce opportunities. React to price structure, not emotions.
⚠️ Options Trading Risk Management Tips 🛡️
Always wait for the first 5–15 minutes post-opening before entering option trades to let premiums settle.
Define your maximum risk per trade (1–2% of capital) and stick to it—don’t average your losses.
Prefer ATM/ITM options for directional trades to reduce theta decay.
Use stop-loss on premium basis or underlying structure basis —whichever matches your plan.
Be mindful of sideways zones where premium erosion is fast—avoid taking trades unless a range breaks.
Consider vertical spreads in high IV environments to limit risk.
Maintain a trading journal to record setups, emotions, and execution discipline.
📌 Summary & Conclusion:
✅ Gap-Up Opening Above 55,371: Strength only above 55,371; upside target 55,730–55,938. Watch for supply pressure and false breakouts.
✅ Flat Opening Between 54,949 – 54,644: Wait for breakout above 55,371 or breakdown below 54,644 for directional plays.
✅ Gap-Down Opening Below 54,644: Key bounce zone lies at 53,949 – 53,692. Best risk/reward trades may emerge from this zone.
🎯 Stay level-headed. Follow structure. Don't rush. Let price action confirm your view and manage risk like a professional.
⚠️ Disclaimer:
I am not a SEBI-registered analyst. The above analysis is for educational purposes only. Please consult a certified financial advisor before making any trading or investment decision.
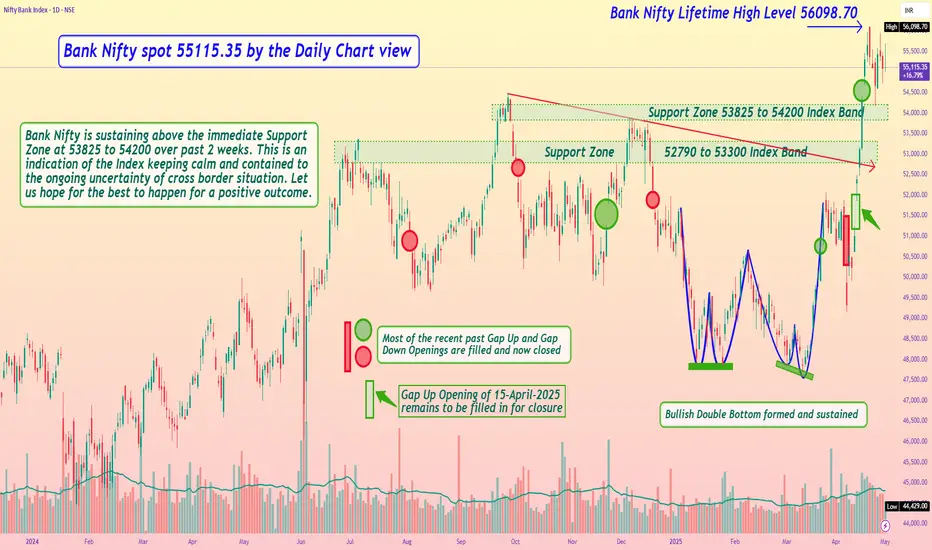
Bank Nifty spot 55115.35 by the Daily Chart view - Weekly UpdateBank Nifty spot 55115.35 by the Daily Chart view - Weekly Update
- Support Zone 53825 to 54200 Index Band
- Next Support Zone 52790 to 53300 Index Band
- Resistance seen only at Bank Nifty Lifetime High Level 56098.70
- Bank Nifty is sustaining above the immediate Support Zone at 53825 to 54200 over past 2 weeks.
- This is an indication of the Index keeping calm and contained to the ongoing uncertainty of cross border situation
- Let us hope for the best to happen for a positive outcome over the coming days/weeks and foresee New ATH creation
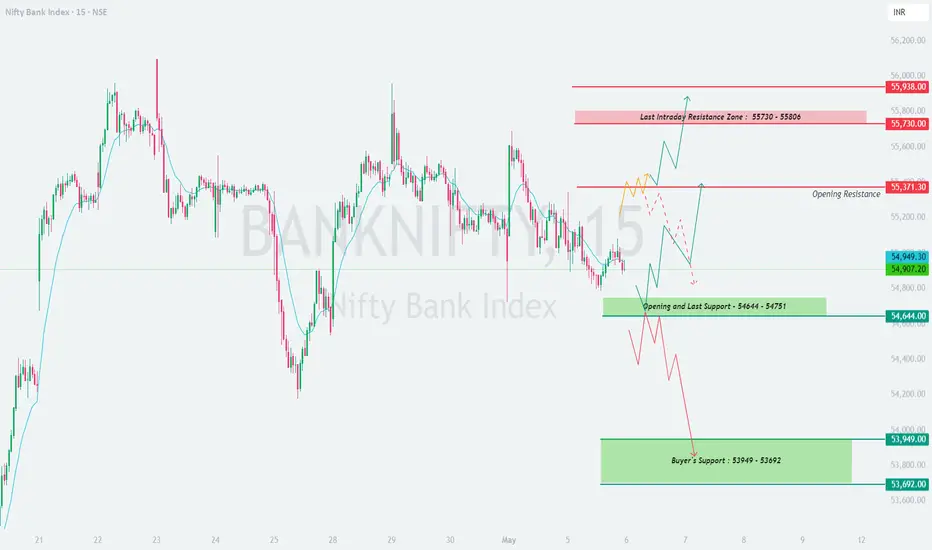
BANKNIFTY : Trading Levels and Plan for 02-May-2025📊 BANK NIFTY 15-Min Trading Plan for 2-May-2025
(Gap Opening Consideration: 200+ Points | Chart-based | Structure-Oriented)
📍 Previous Close: 54,956.50
📌 Important Chart Levels to Monitor:
🔺 Resistance Zones:
🔴 Opening Resistance: 55,443
🔴 Last Intraday Resistance: 55,736
🟢 Possible Upside Target: 56,202
🔻 Support Zones:
🟧 Opening Support/Resistance Flip Zone: 55,064
🟨 Last Intraday Support: 54,557
🟩 Buyer’s Strong Support: 54,020 – 53,843
🟥 Scenario 1: Gap-Up Opening (Above 55,443) 🚀
A gap-up above 55,443 directly opens into the resistance zone; this area is a supply pocket where sellers are likely to be active.
Avoid aggressive longs unless a clean 15-min breakout candle closes above 55,443 with follow-through price action toward 55,736.
If Nifty Bank gets rejected around 55,443–55,736, expect a pullback to test the Opening Support at 55,064 or even 54,956.
For long trades beyond 55,736, wait for price to establish strength above this zone. Only then should targets like 56,202 be considered.
A “gap-up failure” scenario is possible if prices open higher but close back below 55,443 early—this could attract intraday shorts.
📚 Educational Tip: Gaps into resistance zones often trap early bulls. Let price prove its strength by sustaining above key resistance before committing.
🟨 Scenario 2: Flat Opening (Between 55,064 – 54,557) ⚖️
A flat or minor gap open within this range places Nifty Bank inside the neutral, indecisive zone —both buyers and sellers will fight for dominance.
Let the first 15–30 mins play out and observe if price is rejecting the Opening Resistance at 55,443 or taking support at 54,557.
If price climbs above 55,443 with structure, a move toward 55,736 becomes likely. Above that, watch for 56,202 with momentum.
A break below 54,557 could bring in further weakness with a possible slide toward 54,020 – 53,843, but this area is a demand zone, so reversals may occur.
Look for directional conviction from price action before initiating trades. Range-bound play can eat option premiums.
📚 Educational Tip: Flat opens offer excellent trades post zone breakout or reversal setups. Don’t jump early—allow structure to evolve.
🟩 Scenario 3: Gap-Down Opening (Below 54,557) 📉
A gap-down below 54,557 brings the spotlight directly to the Buyer’s Demand Zone: 54,020 – 53,843.
If price shows bullish reversal candles (like pin bars, engulfing patterns) in this demand pocket, aggressive longs can be attempted with stop loss just below 53,843.
However, if this zone fails to hold, we could witness a continuation sell-off targeting deeper zones (which will need re-mapping on intraday basis).
Be cautious of chasing shorts directly into demand. Best trades arise if price bounces first and then rejects resistance levels like 54,557 from below.
Wait for rejection + confirmation (e.g., a lower high and breakdown candle) to re-enter shorts after a minor bounce.
📚 Educational Tip: Gap-downs into strong support zones often offer best risk-reward trades. Let buyers defend the zone first before buying blindly.
💡 Options Risk Management Tips for Intraday Traders ⚠️
Don’t trade immediately after market opens—wait 5–10 mins for option premiums to settle.
Always use a stop loss and define your risk before entering a position.
Prefer trading ITM or ATM options with directional bias to avoid premium decay.
If buying options, be aware of time decay especially during sideways markets—avoid overtrading.
Use vertical spreads (Bull Call / Bear Put) in high IV environments to reduce theta loss.
Avoid averaging losing trades—respect your maximum daily loss limits (e.g., 2% of capital).
Don't convert intraday positions into swing trades emotionally. Accept small losses and stay in the game.
📝 Summary & Conclusion:
✅ Gap-Up Opening (Above 55,443): Be cautious of reversal setups. Longs only if strength builds above 55,736. Watch for gap-fade traps.
✅ Flat Opening (Between 55,064 – 54,557): Wait for a range breakout. Levels like 55,443 and 54,557 are the key breakout boundaries.
✅ Gap-Down Opening (Below 54,557): Watch 54,020 – 53,843 zone closely for long reversal opportunities. Failing this zone could bring panic selling.
📌 Stay objective. Let price come to your plan. Patience, structure, and strict risk control will separate professionals from impulsive traders.
⚠️ Disclaimer:
I am not a SEBI-registered analyst. The above analysis is shared purely for educational purposes. Please consult a certified financial advisor before taking any trade or investment decision.
Wedge Pattern Near Resistance | 15-Min Chart🏦 BANK NIFTY INDEX – Wedge Pattern Near Resistance | 15-Min Chart
📅 Date: April 28, 2025
📈 Timeframe: 15-Minute
🔍 Index: Bank Nifty (NSE)
📌 Technical Overview:
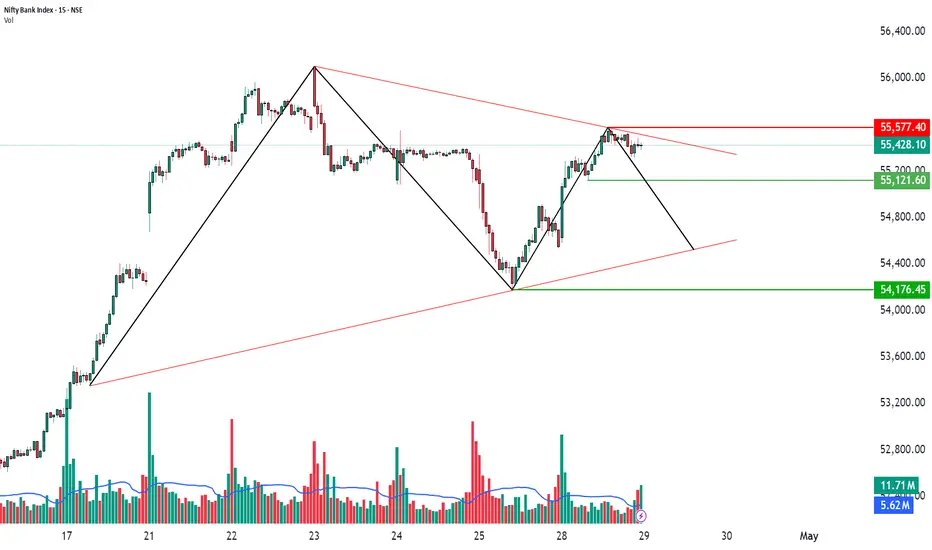
Bank Nifty is moving inside a Wedge Pattern on the 15-minute chart and is facing resistance near 55,577. The price is struggling to move higher and may face selling pressure if it fails to break this resistance. Immediate support is placed at 55,121, and if it breaks down, the index could slip further toward 54,176.
🧩 Chart Pattern Details:
Wedge formation visible with two sloping trendlines (marked in red).
Resistance: 55,577 (red horizontal line).
Immediate Support: 55,121 (first green line).
Major Support: 54,176 (second green line).
🔍 Key Price Levels:
Resistance: 55,577
Immediate Support: 55,121
Major Support: 54,176
CMP (Current Market Price): 55,428.10
If Bank Nifty remains below 55,577 and breaks below 55,121, further downside pressure could build up toward the lower support zone.
📊 Volume Analysis:
Volume has reduced near the resistance area, showing that buyers are losing strength and sellers may start gaining control.
🧠 Observational Bias:
If Bank Nifty fails to cross above 55,577 and breaks 55,121, bears could dominate.
Watch for a proper breakout or breakdown setup before taking trades.
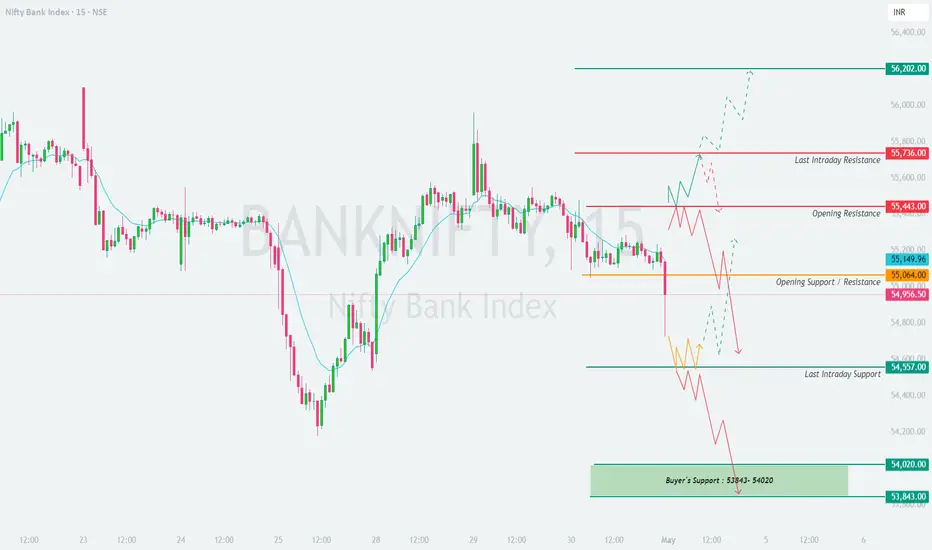
BANKNIFTY : Trading levels and plan for 30-Apr-2025📊 BANKNIFTY 15-Min Plan for 30-Apr-2025 📊
(Chart-Based Educational View | 200+ Points Gap Considered)
📍 Previous Close: 55,301.10
📌 Key Zones & Levels:
🔴 Opening Resistance: 55,577
🟧 No Trade Zone: 55,577 – 55,068
🟠 Opening Support / Resistance: 55,068
🟩 Last Intraday Support: 54,845 – 54,911
🟢 Buyers’ Support Zone: 54,405 – 54,553
🔺 Last Intraday Resistance: 55,813
🔺 Major Upside Target: 56,196
🟥 Scenario 1: Gap-Up Opening (Above 55,577)
If Bank Nifty opens above 55,577 , it would open outside the No Trade Zone, directly testing Opening Resistance . This makes it a crucial area.
A strong price acceptance above 55,577 (e.g., consolidation or bullish candles) can push it towards 55,813 (Last Intraday Resistance) .
If that’s taken out convincingly, momentum traders may look for 56,196 as the next target.
However, this zone can act as a trap if there's a quick rejection with bearish wicks. In that case, short positions with a stop-loss above 55,813 may work well.
A pullback below 55,577 will bring the index back into the No Trade Zone , leading to range-bound or corrective action.
📚 Educational Tip: Always observe if the breakout has volume and strength. Chasing gap-ups without confirmation often leads to whipsaws.
🟨 Scenario 2: Flat Opening (Between 55,068 – 55,577)
If Bank Nifty opens flat, it will open inside the No Trade Zone – an indecisive range prone to whipsaws.
It’s advised to avoid trades for the first 15–30 minutes and let the market give directional clarity.
A breakout above 55,577 with momentum and volume can be bought into, targeting 55,813 and above.
On the downside, a breakdown below 55,068 can trigger short trades targeting 54,911 – 54,845, the last intraday support.
Aggressive traders can try scalping from edge to edge within the No Trade Zone but with reduced position sizing and tight stop-loss.
📚 Educational Tip: Sideways zones often lead to false breakouts. Wait for at least two strong candles to confirm the direction.
🟩 Scenario 3: Gap-Down Opening (Below 55,068)
A gap-down opening below 55,068 signals weakness. The immediate support to watch is the Last Intraday Support zone at 54,911 – 54,845.
A breakdown below 54,845 can trigger further selling toward the Buyer’s Support Zone (54,405 – 54,553) .
This zone is where reversal trades can be attempted if price forms a bullish engulfing or hammer pattern, with stop-loss below the day’s low.
However, if the price sustains below 54,405, expect panic selling toward even deeper levels intraday.
Avoid aggressive longs until a reversal structure is clearly visible with volume confirmation.
📚 Educational Tip: Buyer’s zones often see sharp bounces but also trap early longs. Trade reversal setups only if structure supports it.
🛡️ Options Risk Management Tips 🔐
Always define a pre-determined stop-loss when buying options.
Avoid trading in first 5 minutes ; let market volatility cool off.
For high IV environments, prefer spreads (Bull Call / Bear Put) to reduce theta decay.
If directional bias is unclear, Iron Condors or Neutral Strategies work better.
Never allocate more than 2% of capital per trade in high-risk intraday options.
Trail your profits. Let winners run with SL moved to cost or profit zone.
Don’t convert losing intraday trades into positional ones emotionally.
📌 Summary & Conclusion 🧭
✅ Gap-Up Opening: Look for breakout above 55,577 toward 55,813–56,196 or short on rejection.
✅ Flat Opening: Range-bound behavior expected within 55,068–55,577. Wait for breakout or breakdown.
✅ Gap-Down Opening: Watch 54,845 and 54,405 levels for potential support and reversal or breakdown continuation.
🧠 Discipline, patience, and price-action confirmation are key in volatile conditions.
🎯 Avoid overtrading and let market show the direction before entering large positions.
⚠️ Disclaimer:
I am not a SEBI-registered analyst. The analysis and levels shared are purely for educational purposes. Please consult with your registered financial advisor before taking any trade.

BANKNIFTY - Trading levels and Plan for 29-Apr-2025📈 BANKNIFTY 15-Min Plan for 29-Apr-2025 📈
(Chart-Based Educational View | Gap Opening >200 Points Considered)
➖➖➖➖➖➖➖➖
🔵 Previous Close: 55,428.10
⚡ Key Reference Levels:
🔴 Opening Resistance: 55,577
🟧 Opening Support: 55,069
🟩 No Trade Zone: 55,075 – 54,879
🟢 Last Intraday Support: 54,872
🟢 Major Support Below: 54,477
🔴 Major Resistance Above: 55,918 ➡️ 56,180
➖➖➖➖➖➖➖➖
🟥 Scenario 1: Gap-Up Opening (Above 55,600)
If Bank Nifty opens above 55,600 , it will open near or slightly above the Opening Resistance (55,577) .
Immediate plan would be to wait and watch the first 15 minutes. If the price sustains above 55,577 without heavy rejection, a quick up-move towards 55,918 and then possibly 56,180 is likely.
🚀 On successful breakout, aggressive buyers can plan long entries with a strict stop-loss below 55,577 .
However, if rejection happens near 55,600–55,650 zone (evident by bearish candles), a quick dip back to 55,428 or even lower till 55,069 can occur.
🎯 In case of rejection, better to play conservative shorts targeting intraday supports but always with a protective stop-loss.
📚 Educational Note: Gaps near resistance zones often face selling pressure initially. Confirmation through strong candles is vital before chasing a breakout.
🟨 Scenario 2: Flat Opening (Between 55,200–55,600)
If Bank Nifty opens between 55,069 and 55,577 , focus heavily on the behavior near Opening Support 55,069 and Opening Resistance 55,577 .
🔎 If price sustains above 55,428–55,450 in the first 15–30 minutes, it can attempt a breakout towards 55,577.
⚡ A breakout above 55,577 on volume confirmation can invite fresh buying targeting 55,918.
If Bank Nifty starts slipping below 55,069 , it will enter the No Trade Zone (55,075–54,879) where whipsaws are possible. Avoid aggressive trades in this zone unless clear momentum appears. 📉 A decisive breakdown below 54,879 can lead to a fast dip toward 54,477.
📚 Educational Note: In flat openings, let the market define its trend. Neutral openings often trap both buyers and sellers initially. Clarity usually emerges after 30 minutes.
🟩 Scenario 3: Gap-Down Opening (Below 55,000)
If Bank Nifty opens below 55,000 , it would be opening near the Opening Support and may directly test the Last Intraday Support (54,872) .
🔥 If price sustains below 54,879 , aggressive shorts can be planned with targets towards 54,477 initially.
🛑 However, if strong bullish reversal signs (like hammer candles or bullish divergences) are seen around 54,872–54,477, a quick sharp pullback is very much possible.
🚀 In that case, a low-risk long opportunity can arise with small stop-losses just below the low of reversal candle.
❌ Avoid aggressive longs immediately in gap-downs unless a proper reversal pattern confirms.
📚 Educational Note: Gap-downs tend to either extend downtrend quickly or reverse sharply. Emotional trades must be avoided unless the setup is clear.
➖➖➖➖➖➖➖➖
📌 Risk Management Tips for Options Trading 🛡️
Always define a fixed stop-loss in options trading. Premiums decay faster than you expect!
Avoid taking trades within first 5 minutes of opening chaos. Observe initial volatility.
Use Bull Call Spreads or Bear Put Spreads when IV (Implied Volatility) is too high to minimize premium loss.
Position sizing is crucial: Risk only 1–2% of your total capital per trade.
Keep a timer! If the trade doesn't move in your favor within 15–30 minutes after entry, better to exit or trail SL aggressively.
Don’t convert intraday option trades into positional trades just because it is in loss. Stick to your timeframe!
➖➖➖➖➖➖➖➖
📜 Summary and Conclusion:
✅ Gap-Up Opening: Play for breakout above 55,577 or short if rejection seen.
✅ Flat Opening: Focus between 55,069–55,577; avoid trades inside No Trade Zone unless momentum emerges.
✅ Gap-Down Opening: Watch 54,872–54,477 area closely for breakdown or reversal plays.
🎯 Stay patient, wait for confirmation, and stick to disciplined entries.
🧠 In volatile markets, protecting your capital is your biggest edge.
➖➖➖➖➖➖➖➖
⚠️ Disclaimer:
I am not a SEBI-registered analyst. The views shared here are purely for educational purposes. Please consult your financial advisor before making any trading decisions.

Option TradingIf you're looking for a simple options trading definition, it goes something like this: Options trading gives you the right or obligation to buy or sell a specific security on or by a specific date at a specific price. An option is a contract that's linked to an underlying asset, such as a stock or another security.

BANKNIFTY : Trading Levels and Plan for 28-Apr-2025📊 Bank Nifty Trading Plan for 28-Apr-2025 (15-min TF Analysis)
Previous Close: 54,552.45
Key Zones:
🔴 Resistance Zone: 55,237 – 55,315
🟧 Opening Resistance: 54,933
🟨 Opening Support Zone: 54,333 – 54,640
🟦 Last Intraday Support Zone: 53,973 – 54,082
🟥 Scenario 1: Gap-Up Opening (Above 54,750)
If Bank Nifty opens 200+ points higher around or above 54,750 , we are entering into the zone close to the Opening Resistance (54,933) or even nearing the Last Intraday Resistance Zone (55,237–55,315) .
Observe price behavior near 54,933 . If Bank Nifty shows signs of rejection (wicks, bearish candles), a low-risk short setup can be initiated with a target back towards 54,640–54,552 .
However, if price sustains above 54,933 and especially above 55,237 with strong volume and momentum, aggressive longs can be considered aiming for 55,400+ levels .
Patience is key. Let the first 15–30 minutes settle before acting.
🧠 Educational Tip: Gap-ups near supply zones often trap early buyers. Always wait for a candle close above resistance for confirmation before going long.
🟨 Scenario 2: Flat Opening (Between 54,350 – 54,750)
If Bank Nifty opens flat or with a minor gap, it will stay between the Opening Support (54,333–54,640) and the Opening Resistance (54,933) .
Price near 54,552–54,640 will be crucial.
A bounce from 54,552 and sustaining above 54,640 may trigger a safe buy trade targeting 54,933 .
If price fails to hold 54,552 and decisively breaks down, expect a quick slide toward the Opening Support Zone (54,333) .
Shorting can be considered below 54,333 if breakdown is confirmed.
🧠 Educational Tip: Flat openings offer both upside and downside opportunities but require extra patience to avoid getting trapped inside the opening range.
🟩 Scenario 3: Gap-Down Opening (Below 54,350)
If Bank Nifty opens sharply lower (gap-down of 200+ points), it will test the Opening Support Zone (54,333–54,640) or even fall near the Last Support Zone (53,973–54,082) .
If price stabilizes around 54,333–54,082 with bullish candle formations (hammer, bullish engulfing), a reversal buying opportunity can be considered targeting 54,552–54,640 .
However, if 53,973 is breached with high volume, further downside is open towards 53,800 and even 53,600 .
Avoid knife-catching blindly. Wait for strong confirmation before reversal attempts.
🧠 Educational Tip: In gap-downs, emotional decisions can lead to heavy losses. Instead, structure trades after the price either bounces with authority or breaks critical supports cleanly.
⚡ Risk Management Tips for Options Traders:
🛡️ Stick to defined stop loss always. Options can quickly become worthless if the trade goes against you.
📅 Prefer trading current week expiry options for intraday, but close early if volatility drops.
🔀 Consider option spreads (Bull Call / Bear Put) to protect from sudden theta decay.
🕰️ Avoid entering trades in the first 5 minutes . Let premiums adjust to actual market momentum.
💰 Don’t over-leverage. Risk only 1–2% of capital per trade.
⚖️ Stay away from random averaging. Instead, wait for setups to rebuild conviction trades.
📌 Summary & Conclusion:
🟥 Gap-Up Opening: Watch 54,933–55,237 for selling pressure or breakout confirmation.
🟨 Flat Opening: Play the range breakout or breakdown between 54,333–54,933 .
🟩 Gap-Down Opening: Reversal or breakdown setups near 53,973–54,333 .
Patience and structure are the keys to winning trades. Trade what you see, not what you assume! 🎯
⚠️ Disclaimer: I am not a SEBI-registered analyst . All views shared are purely for educational purposes only . Please consult your financial advisor before making any trading or investment decisions. 📚

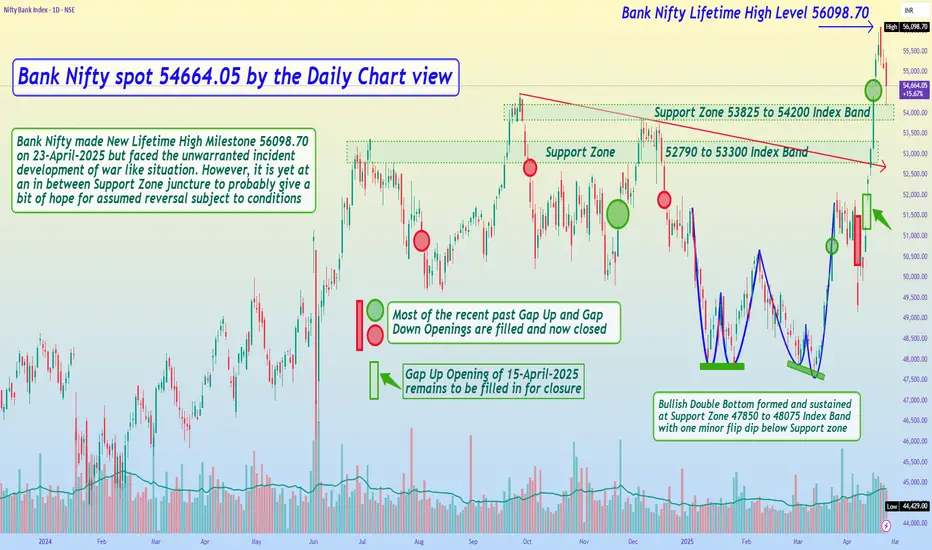
Bank Nifty spot 54664.05 by the Daily Chart view - Weekly UpdateOOPS 🤭 MY BAD..... Had done a typo mistake hence reposting the review for *Bank Nifty spot 54664.05* and *NOT 5664.05* by the Daily Chart view - Weekly Update. 😀 🤝 👍
Bank Nifty spot 54664.05 by the Daily Chart view - Weekly Update
- Support Zone 53825 to 54200 Index Band
- Next Support Zone 52790 to 53300 Index Band
- ATH 56098.70 is the only Resistance Level to crossover
- Gap Up Opening of 15-April-2025 remains to be filled in for closure
- Bank Nifty made New Lifetime High Milestone 56098.70 on 23-April-2025 but faced the unwarranted incident development of war like situation. However, it is yet at an in between Support Zone juncture to probably give a bit of hope for assumed reversal subject to conditions
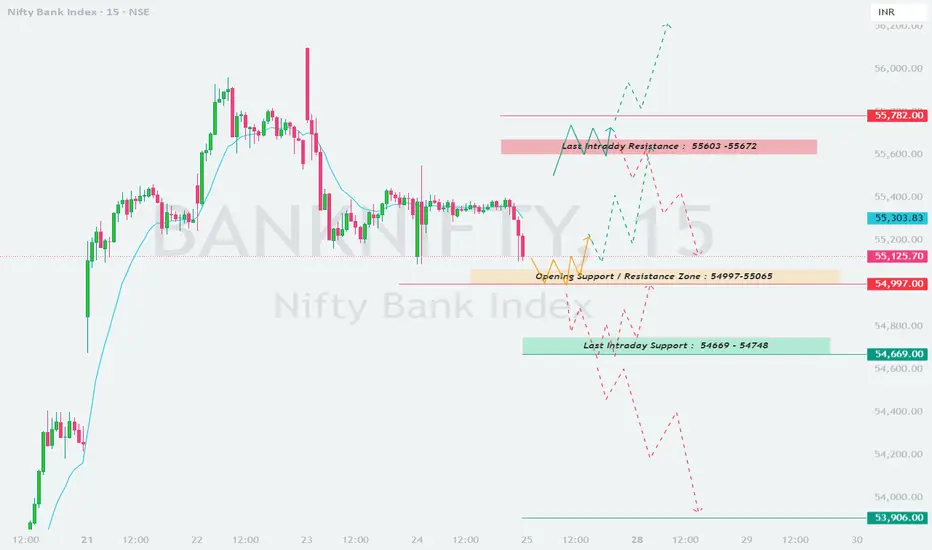
BANKNIFTY : Trading levels and Plan for 25-Apr-2025📊 Bank Nifty Trading Plan – 25-Apr-2025 (15-min TF)
Previous Close: 55,125.70
Key Zones from Chart:
🔴 Upper Resistance Zone: 55,603 – 55,672
🟧 Opening Support/Resistance Zone: 54,997 – 55,065
🟩 Intraday Support Zone: 54,669 – 54,748
🔻 Breakdown Zone: Below 54,669, next major support at 53,906
🟥 Scenario 1: Gap-Up Opening (Above 55,325 – i.e., +200 pts)
If Bank Nifty opens around or above 55,325, it's nearing the upper supply zone of 55,603 – 55,672. This is a critical region where multiple intraday rejections were previously seen.
Observe for a possible rejection from the resistance zone. If bearish price action is confirmed (e.g., bearish engulfing or evening star pattern), one can consider shorting with targets at 55,125 and 54,997.
If price sustains above 55,672 for 15–30 minutes with bullish follow-through, a breakout trade may be taken targeting 55,782+. Ensure volume confirms the move.
Avoid aggressive longs directly into resistance unless there is a clear breakout pattern.
💡 Educational Tip: Don’t confuse gap-ups with trend continuation. Price must break and sustain above resistance for confirmation of bullish momentum. Often gap-ups in resistance zones result in traps.
🟨 Scenario 2: Flat Opening (Between 54,925 – 55,325)
Flat opens will likely place Bank Nifty near the current consolidation and inside the critical pivot zone of 54,997 – 55,065.
If Bank Nifty opens flat and sustains above 55,065 with strength, a long can be considered with targets toward 55,303 and 55,603. Place SL below 54,997.
If it rejects 55,065 and breaks below 54,997 with volume, a short setup opens toward 54,748 and 54,669.
This zone (54,997–55,065) is sensitive, so wait for confirmation and avoid taking early positions in the chop.
💡 Educational Tip: In flat openings, most traps are laid during the first 15–30 minutes. Patience is your edge. Observe how the market reacts to the first breakout/breakdown and trade with a tight SL thereafter.
🟩 Scenario 3: Gap-Down Opening (Below 54,925 – i.e., -200 pts)
A sharp gap-down will take Bank Nifty close to the major support zone of 54,669 – 54,748. If this zone breaks, a deeper correction may unfold.
If price finds support near 54,669–54,748 and forms bullish reversal candles (hammer or bullish engulfing), a high R/R long trade can be initiated with targets at 54,997 and 55,125.
If price breaks and sustains below 54,669 with strong bearish structure and volume, consider shorts toward 54,400 and the next major support at 53,906.
Avoid blindly buying just because it’s a gap-down – wait for base formation and candle strength before any reversal play.
💡 Educational Tip: Gap-downs into demand zones often bring confusion and volatility. The safest trades come after reversal confirmation. If breakdown happens, let price retest the zone before shorting.
🛡️ Options Trading Risk Management Tips:
🧠 Avoid buying far OTM options in sideways or slow-trending markets – theta decay will eat premium.
📏 Always define your maximum loss per trade – ideally, not more than 2% of your capital .
🔁 Avoid averaging losing positions. If your view goes wrong, cut the loss and re-enter only after a new setup forms.
⏳ Allow the first 15–30 minutes to settle. Avoid impulsive option buying just after open.
🧮 Consider using spreads (Bull Call/Bear Put) to manage risk and avoid high premium burn.
🎯 Avoid revenge trading. Even the best setups may fail – it’s part of the game. Focus on probabilities.
📘 Summary & Conclusion:
🟥 Gap-Up: Resistance near 55,603–55,672 is critical. Short on rejection. Long only on breakout + follow-through.
🟨 Flat Open: Watch the 54,997–55,065 zone for breakout or breakdown clues. Play range-to-range.
🟩 Gap-Down: Support at 54,669–54,748 is key. Long on reversal. Short below 54,669 for 53,906.
Stay disciplined. Let levels talk. Trade what you see, not what you feel. 🧘♂️
⚠️ Disclaimer: I am not a SEBI-registered analyst . This analysis is shared purely for educational purposes only . Please consult your financial advisor before making any trading or investment decisions.
BANKNIFTY : Trading Levels and Plan for 24-Apr-2025📊 BANK NIFTY Intraday Trading Plan – 24-Apr-2025
Timeframe: 15-minute
Previous Close: 55,318.90
🔍 Key Levels on Chart:
🟥 Opening Resistance: 55,545 – 55,611
🔴 Last Intraday Resistance: 55,870 (Pending sellers level)
🟧 Opening Support Zone: 55,219 – 55,299
🟩 Last Intraday Support: 54,859
🟢 Buyer's Zone: 54,535 – 54,619
🟥 Scenario 1: Gap-Up Opening (Above 55,518 – i.e. +200 points)
A gap-up above 55,518 would place Bank Nifty directly near the Opening Resistance (55,545 – 55,611) . This zone has pending sellers and is a major decision point for intraday traders.
If Bank Nifty gives wick rejections or red candles in this zone, a short trade setup is likely with a target toward 55,367 and 55,219. SL should be above 55,650 (buffer).
If price sustains above 55,611 for 15–30 minutes with volume, then the rally may extend to 55,870 (last intraday resistance) . You may enter a bull call spread with target at 55,850+.
Avoid aggressive long entries near resistance unless clear price strength or breakout is confirmed.
💡 Educational Tip: Always wait for first pullback or consolidation breakout after a gap-up. Let the structure unfold, don't chase impulsive candles.
🟨 Scenario 2: Flat Opening (Between 55,219 – 55,518)
A flat open places Bank Nifty in a zone of neutrality between immediate support and resistance. Patience and breakout confirmation is key in this situation.
If price starts moving above 55,545–55,611 zone with bullish structure, initiate longs toward 55,870 with SL below 55,500.
If price fails to hold 55,219 and breaks down with volume, downside targets become 54,859. Watch for breakdown retest pattern to re-enter or add to shorts.
Sideways movement is common in first 15 mins of a flat open – avoid early entries without confirmation.
💡 Educational Tip: A flat opening provides the best RR setups. Use zone-to-zone trading style, where you buy near support and sell near resistance after confirmation.
🟩 Scenario 3: Gap-Down Opening (Below 55,118 – i.e. -200 points)
A gap-down brings Bank Nifty straight into the last intraday support (54,859) or even deeper into the Buyer's Zone (54,535 – 54,619) . This is a crucial test for demand.
If the index bounces from 54,859 with strong green candle or bullish engulfing, then quick reversal scalps toward 55,219 are possible. SL: 54,800.
If the Buyer’s Zone (54,535 – 54,619) is also breached and price sustains below, we could see a free fall toward 54,300. Enter only on breakdown confirmation.
Avoid early longs unless there's a proper bullish structure (like double bottom or reversal candle at support).
💡 Educational Tip: Buyer’s zones are best for high RR setups but demand confirmation is essential. Don't catch a falling knife without proof of buyers stepping in.
🛡️ Options Trading Risk Management Tips:
✅ Always keep SL in place – never trade naked options without a pre-defined exit.
⛔ Avoid selling options aggressively on expiry weeks unless you're a pro with risk-hedged strategies.
🛠️ Use vertical spreads (bull call / bear put) to reduce risk and cost.
🔄 Adjust positions dynamically if the market invalidates your view – don’t marry your trades.
💰 Limit your risk per trade to 2%–3% of total capital to stay long in the game.
📘 Summary & Conclusion:
Watch for price action near:
🟥 Resistance: 55,545 – 55,611 & 55,870
🟧 Support: 55,219 – 55,299
🟩 Lower Supports: 54,859 & 54,535 – 54,619
🎯 Focus on zone-to-zone reactions, not predictions. Let price lead your trade entries.
📊 Best setups will come with clean rejection or breakout confirmations. Be alert and flexible.
🧠 Plan your trades with defined entries, exits, and stop losses. Options traders should stick to spreads for safety and avoid theta decay traps.
⚠️ Disclaimer: I am not a SEBI-registered analyst . This trading plan is shared solely for educational purposes . Please do your own research or consult a financial advisor before making any investment or trading decisions.

BANKNIFTY : Trading Levels and Plan for 23-Apr-2025📅 Bank Nifty Intraday Trading Plan – 23-Apr-2025
Timeframe: 15-min
Previous Close: 55,559.20
Key Zones on Chart:
🔴 Opening Resistance Zone: 55,735 – 55,870
🟠 Opening Support / Resistance Flip Zone: 55,517 – 55,445
🟡 Major Support / Consolidation Zone: 55,058 – 54,885
🔴 Opening Scenario 1: Gap-Up Opening (Above 55,735 – 200+ Points)
If Bank Nifty opens above 55,735, it will directly enter the Opening Resistance Zone (55,735–55,870) . This zone is crucial for profit booking or intraday reversals.
Wait for a 15-minute candle to sustain above 55,870 with strong volume. If it does, the next possible target would be 56,296.
If price shows rejection in this zone, consider shorting via ATM put options or a bear call spread strategy.
Only aggressive traders may consider call options on dips near 55,735 with SL below 55,690.
💡 Tip: Don’t chase a gap-up breakout immediately. Look for early signs of reversal (wick rejections, bearish engulfing candles) before entering any position.
🟡 Opening Scenario 2: Flat Opening (Between 55,445 – 55,735)
A flat opening keeps the market within a neutral to slightly bearish zone. It's a battleground between bulls and bears, with high importance on micro price action.
If Bank Nifty sustains below 55,517, price may revisit 55,445 – which is a demand zone.
A breakdown below 55,445 can give a momentum short opportunity toward 55,058.
If price sustains above 55,690 and crosses 55,735, bulls may again test the 55,870 resistance zone.
💡 Tip: This is a great environment for premium decay plays such as straddle/strangle if the price remains rangebound between 55,445–55,735 in the first hour.
🔵 Opening Scenario 3: Gap-Down Opening (Below 55,058 – 200+ Points)
A gap-down below 55,058 brings Bank Nifty into the Support/Consolidation Zone (55,058–54,885) . This area can either stabilize or invite panic selling.
Look for price action around 54,885. If there's a strong bounce, a counter-trend long trade is possible toward 55,058.
If this zone fails, expect a sharp downside move toward 54,600. Use ITM puts or bear put spreads to limit risk. Wait for base formation before going long; avoid catching the falling knife without confirmation.
💡 Tip: In this scenario, implied volatility (IV) spikes. Prefer debit spreads over naked options to reduce theta loss and premium decay.
📘 Options Trading Risk Management Tips
Trade with defined stop losses on every entry, especially in volatile environments.
Limit position size to 2–3% of capital per trade]. Avoid revenge trading.
Avoid holding OTM options after 2 PM unless there's a breakout or trending move confirmed.
Watch VIX (volatility index). High VIX = avoid naked options; use spreads or hedge your positions.
Stick to the direction supported by both price action and volume confirmation .
📌 Summary & Conclusion
✅ Important Levels:
🟥 Resistance: 55,735 | 55,870 | 56,296
🟧 Flip Zone: 55,517 – 55,445
🟨 Support: 55,058 | 54,885
🎯 Trade with confirmation, not anticipation. Let the opening settle for the first 15–30 minutes.
Use structure-based entries with a clear risk-reward strategy. Avoid emotional trades and over-leveraging in options.
💹 Whether it's a breakout or breakdown, trade the reaction, not just the level.
⚠️ Disclaimer: I am not a SEBI-registered analyst . All content shared is for educational purposes only. Please consult your financial advisor before making any trading decisions.
