Bank Nifty – H&S Breakdown Setup| 1H | Expiry 25/11/25Timeframe: 1H
Pattern in Play: Head & Shoulders
Market Structure: Breakdown & Retest Watch
🔍 Technical Snapshot
Bank Nifty has printed a clean Head & Shoulders pattern on the 1-hour timeframe, with the neckline around 58850.
Price has slipped below the neckline, but only marginally, and with a spinning-top candle — signalling indecision rather than conviction.
For a high-probability continuation move, I want to see a strong bearish rejection from the neckline zone:
🔻 Bearish Marubozu, or
🔻 Shooting Star
on the flip-resistance retest of the neckline.
This confirmation could trigger a short continuation into the next liquidity zones.
📉 Bearish Scenario (Primary Bias)
As long as Bank Nifty stays below 59130, bias remains bearish.
Entry Trigger
- A clean bearish signal candle on the neckline retest (preferably 1H; aggressive traders may use 15m but that’s riskier as this is a contra-trend reversal setup).
Stop-loss
-Conservative: Above the 1H signal candle
-Aggressive: Above the 15m signal candle
Downside Targets
58690 – nearest support
58600 – if 58690 breaks
58330 – deeper breakdown
58160 – extended target
A sustained close below 58600 increases probability of a move to 58330/58160.
📈 Bullish Scenario (Invalidation + Reversal)
Bullish only above 59130 on a full-body 1H breakout candle.
Entry Trigger
-Strong 1H close above 59130
Stop-loss
-Low of the breakout candle
Upside Target: 59400
This will invalidate the H&S setup and shift structure back to upward continuation.
🧭 Summary
Pattern in focus: Head & Shoulders breakdown
Bias: Bearish below 59130
Bearish continuation needs flip-resistance rejection
Bullish only on clean breakout above 59130
⚠️ Disclaimer
This is not financial advice.
This setup is for educational and chart-study purposes only.
Please do your own research and manage your risk responsibly.
🙏 If you found this helpful…
Boost this idea, drop a comment, and tell me which stock or index you want me to analyse next.
I publish detailed, pattern-rich setups regularly — follow for more!
Bankniftyintradaytradesetup

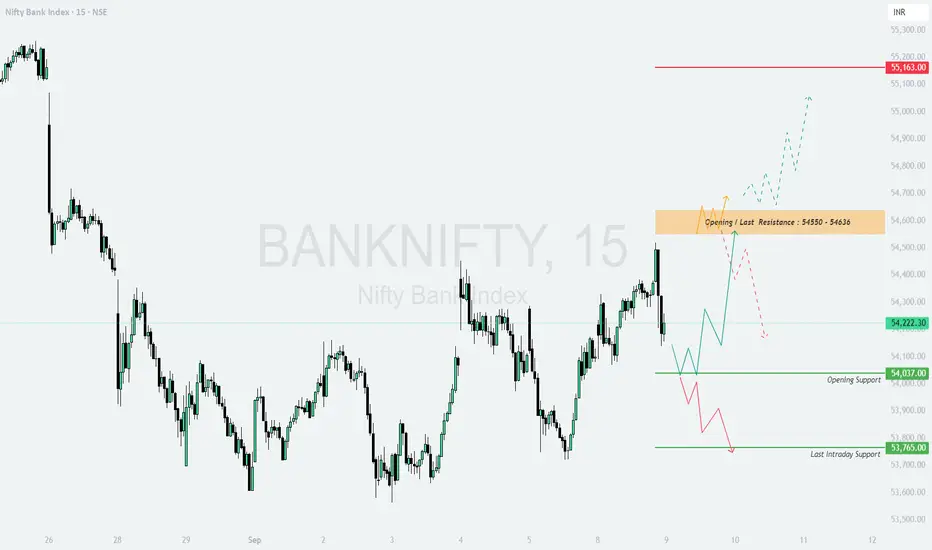
BANKNIFTY: Trading levels and Plan for 09-Sep-2025BANK NIFTY TRADING PLAN – 09-Sep-2025
📌 Key Levels to Watch :
Major Resistance Zone: 54,550 – 54,636
Upside Extension Resistance: 55,163
Opening Support: 54,037
Last Intraday Support: 53,765
The index is now trading near a decision-making point. Price behavior around the resistance zone and support levels will set the tone for the next move.
🔼 1. Gap-Up Opening (200+ points above 54,636)
If Bank Nifty opens above 54,636, it will open doors for bullish continuation.
📌 Plan of Action :
Sustaining above 54,636 can lead to a strong rally towards 55,163.
If momentum continues, the index may even attempt new highs beyond 55,200+.
Watch for early profit booking near 55,163, as this level could act as a supply zone.
👉 Educational Note: Gap-ups above resistance zones often trap late sellers. But fresh longs should be added only if the price sustains for 15–30 mins above resistance.
➖ 2. Flat Opening (Around 54,200 – 54,300)
A flat start gives traders an opportunity to observe early market sentiment.
📌 Plan of Action :
If Bank Nifty sustains above 54,300, expect a test of the 54,550 – 54,636 resistance zone.
A clean breakout above 54,636 can extend the move towards 55,163.
On the downside, a failure to hold 54,037 (opening support) may drag prices towards 53,765.
👉 Educational Note: Flat openings are ideal for option sellers in the first hour. Buyers should wait for confirmation of breakout/breakdown before initiating trades.
🔽 3. Gap-Down Opening (200+ points below 54,000)
If the index opens sharply lower, bearish momentum may dominate.
📌 Plan of Action :
Immediate support lies at 53,765 (last intraday support).
A breakdown below 53,765 can accelerate selling, targeting 53,500 – 53,400 levels.
However, if Bank Nifty takes support at 53,765 and rebounds strongly, expect a short-covering rally back towards 54,037.
👉 Educational Note: Gap-downs create panic, but seasoned traders wait for a reversal signal near strong support zones to capture short-covering rallies.
🛡️ Risk Management Tips for Options Traders
Always trade with a pre-defined stop-loss on hourly closing basis .
Keep position sizing under control — risk only 1–2% of total capital per trade .
On volatile days, prefer option spreads (bull call spread, bear put spread) over naked options to manage time decay.
Avoid chasing gap-ups or gap-downs blindly; wait for confirmation candles.
Scale out profits near resistance zones like 54,636 and trail stop-losses on remaining positions.
📌 Summary & Conclusion
🟢 Above 54,636 → Bullish trend continuation towards 55,163+ .
🟧 Flat Opening → Range-bound play; above 54,300 bullish, below 54,037 weak .
🔴 Below 54,000 → Bearish momentum, testing 53,765 and possibly lower .
⚠️ Critical Zone: 54,550 – 54,636 (Major Resistance). A clear breakout here will define the bullish trend continuation.
⚠️ Disclaimer: I am not a SEBI-registered analyst. This analysis is purely for educational purposes and should not be considered as financial advice. Please consult your financial advisor before making trading decisions.
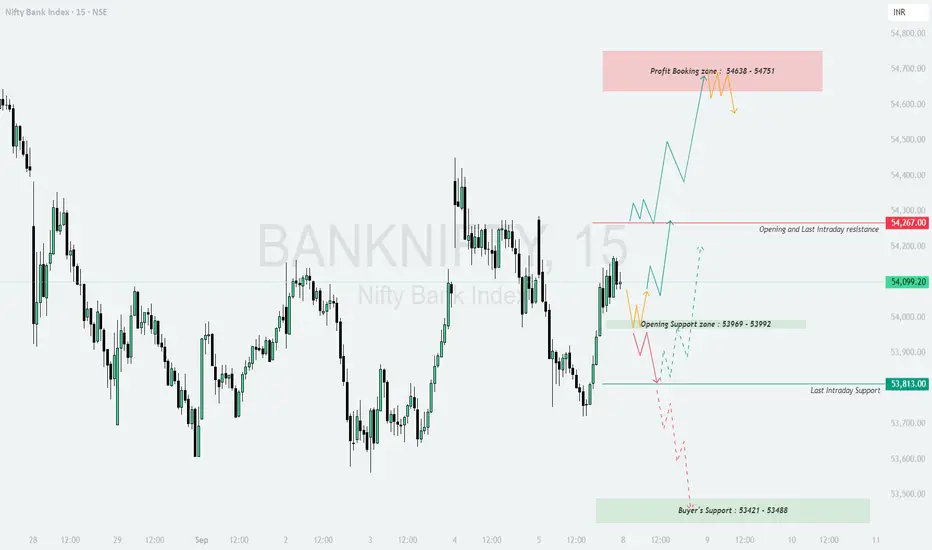
BANKNIFTY : Trading levels and Plan for 08-Sep-2025b]BANK NIFTY TRADING PLAN – 08-Sep-2025
📌 Key Levels to Watch :
Profit Booking Zone: 54,638 – 54,751
Opening & Last Intraday Resistance: 54,267
Opening Support Zone: 53,969 – 53,992
Last Intraday Support: 53,813
Buyer’s Support (Strong Zone): 53,421 – 53,488
The market has entered a sensitive phase where traders need to closely monitor reactions around support and resistance levels.
🔼 1. Gap-Up Opening (200+ points above 54,267)
If Bank Nifty opens with a strong gap-up above 54,267, it directly challenges the resistance zone.
📌 Plan of Action :
Sustaining above 54,267 will invite momentum buying, pushing towards the profit booking zone 54,638 – 54,751.
Traders should be cautious here, as this zone is ideal for partial profit booking or scaling out of longs.
A breakout and sustained move above 54,751 can open room for further upside, but momentum may slow down.
👉 Educational Note: Gap-ups near resistance often face selling pressure. Wait for confirmation candles before chasing a long trade.
➖ 2. Flat Opening (Around 54,000 – 54,150)
A flat opening indicates a balanced market start, offering opportunities both ways.
📌 Plan of Action :
Sustaining above 54,099 – 54,150 will keep the momentum bullish, targeting 54,267.
If price breaks above 54,267, the move can extend towards the profit booking zone.
On the downside, failure to sustain above 54,000 may drag prices to test the opening support zone 53,969 – 53,992.
👉 Educational Note: Flat openings provide the best chance to evaluate market sentiment in the first 30 minutes. Avoid rushing into trades and let price action guide your entries.
🔽 3. Gap-Down Opening (200+ points below 53,900)
A weak opening below 53,900 will bring sellers into control.
📌 Plan of Action :
Initial support lies at 53,813 (last intraday support). A breakdown below this level can drag Bank Nifty towards the buyer’s support zone 53,421 – 53,488.
Expect strong buying attempts from this buyer’s zone. If the rebound holds, it can trigger a sharp pullback rally.
Sustaining below 53,421 will turn the market sentiment bearish, opening deeper downside targets.
👉 Educational Note: Gap-downs often cause emotional selling. Smart traders wait for a retest of supports before entering trades.
🛡️ Risk Management Tips for Options Traders
Always maintain a stop-loss on hourly closing basis to avoid being trapped in intraday volatility.
Avoid aggressive lot sizes on volatile gap-up/gap-down days. Keep risk per trade at 1–2% of capital .
Use option spreads (like bull call spreads or bear put spreads) near resistance/support to manage premium decay.
Never hold out-of-the-money options overnight unless backed by strong conviction.
Book partial profits at key zones like support/resistance and let the rest ride with a trailing stop.
📌 Summary & Conclusion
🟢 Above 54,267 → Bullish bias with targets at 54,638 – 54,751 (profit booking zone) .
🟧 Flat Opening → Watch 54,000 – 54,150 range; above bullish, below weak .
🔴 Below 53,900 → Weakness towards 53,813 & further to 53,421 – 53,488 (buyer’s support zone) .
⚠️ Critical Zone: 54,638 – 54,751 (Profit Booking Zone). Booking profits here is wise before chasing further upside.
⚠️ Disclaimer: I am not a SEBI-registered analyst. This analysis is for educational purposes only and should not be taken as financial advice. Please consult your financial advisor before trading.
BANKNIFTY : Trading levels and Plan for 29-Aug-2025💼 BANK NIFTY TRADING PLAN – 29-Aug-2025
📌 Key Levels to Watch :
Opening Resistance Zone: 54,076 – 54,184
Last Intraday Resistance: 54,246
Major Resistance Above: 54,511
Opening Support Zone: 53,669 – 53,767
Last Intraday Support: 53,460
Major Support Below: 53,204
These levels represent intraday turning points where buyers or sellers may step in aggressively.
🔼 1. Gap-Up Opening (200+ points above 54,184)
If Bank Nifty opens with a strong gap above 54,184, bullish momentum is likely.
📌 Plan of Action :
Sustaining above 54,246 (last intraday resistance) may fuel upside towards 54,511, which is the next hurdle for bulls.
Partial profit booking is advisable near 54,511, as it could trigger a pullback.
If the index fails to sustain above 54,246, it may slip back into the 54,076–54,184 resistance band, indicating possible rangebound price action.
👉 Educational Note: On big gap-ups, avoid chasing the first 15 minutes. Wait for a retest of support before entering long trades.
➖ 2. Flat Opening (Around 53,669 – 53,767 Support Zone)
If Bank Nifty opens flat within the opening support band, the market will look for fresh direction.
📌 Plan of Action :
Holding above 53,767 can invite buying, targeting 54,076 → 54,246.
Failure to hold above 53,669 may push the index back towards 53,460, opening the door for more weakness.
Traders should avoid over-leveraging in this consolidation zone, as false breakouts are common.
👉 Educational Note: Flat openings usually demand patience. Allow price to test both sides of support/resistance before committing to a trade.
🔽 3. Gap-Down Opening (200+ points below 53,460)
If Bank Nifty opens with a sharp gap below 53,460, bearish control will likely continue.
📌 Plan of Action :
Below 53,460, the index can slide further towards 53,204 (major support).
The 53,204 zone is critical; strong buying wicks here may signal a reversal opportunity.
If 53,204 breaks decisively, expect extended downside momentum, so shorts can be trailed aggressively.
👉 Educational Note: Gap-down openings often trigger panic. Avoid emotional trades—stick to levels and wait for clear breakdown confirmations.
🛡️ Risk Management Tips for Options Traders
Risk only 1–2% of trading capital per trade.
Use hourly candle close stop-losses for confirmation instead of reacting to noise.
On high-volatility days, prefer spreads (Bull Call/Bear Put) over naked options.
Book profits in tranches, don’t wait for exact targets.
Keep an eye on India VIX to gauge premium decay and volatility risk.
📌 Summary & Conclusion
🟢 Above 54,246 → Upside towards 54,511 (profit booking zone) .
🟧 Flat near 53,669–53,767 → Wait for breakout, either to 54,246 or 53,460 .
🔴 Below 53,460 → Weakness towards 53,204 (critical support) .
🎯 The battle zone: 53,669–53,767 opening support will decide intraday momentum.
⚠️ Disclaimer: I am not a SEBI-registered analyst. This trading plan is prepared purely for educational purposes and should not be treated as investment advice. Please do your own research or consult a financial advisor before trading.

BANKNIFTY : Trading levels for 25-Aug-2025BANK NIFTY TRADING PLAN – 25-Aug-2025
📊 The market is at a decisive zone where price action around the 55,168 support–resistance pivot will guide the day’s direction. With clear intraday resistance at 55,528–55,687 and strong support around 54,563–54,745, let’s break down the trading plan for all three possible opening scenarios.
🔼 1. Gap-Up Opening (200+ Points Above 55,528)
If Bank Nifty opens above 55,528, it directly enters the “Opening Resistance Zone.” Such gaps often trigger profit booking in the early minutes, as traders who carried long positions may book profits.
📌 Plan of Action:
Wait for the first 15–30 minutes to see whether price sustains above 55,528.
If sustained, expect a rally towards the Last Intraday Resistance 55,687 and further into the target zone of 55,954–56,061.
However, if the index fails to sustain and slips back below 55,528, a quick retracement toward 55,168 may occur.
Risk note: Do not chase aggressive calls after a sharp gap-up. Instead, wait for pullbacks to key levels for a favorable risk–reward entry.
➖ 2. Flat Opening (Around 55,150–55,250)
A flat start around 55,168 will be the most balanced case, where both bulls and bears will have opportunities depending on who gains control first.
📌 Plan of Action:
If Bank Nifty sustains above 55,168 with strong buying, expect an upward move toward 55,528. A breakout above this resistance can open the way to 55,687 and eventually 55,954–56,061.
On the contrary, if price fails to hold 55,168 and slips below, selling pressure may drag it toward 54,745–54,563 (Last Intraday Support Zone).
Traders should closely monitor the first 30 minutes’ structure to avoid false breakouts.
Risk note: Options traders can use spreads (Bull Call Spread / Bear Put Spread) instead of naked buying to reduce theta decay and premium risk.
🔽 3. Gap-Down Opening (200+ Points Below 54,950)
A sharp gap-down below 55,000 may lead to panic selling, especially if global cues are weak.
📌 Plan of Action:
If the index opens below 55,000 and fails to reclaim 55,168, expect selling to intensify toward the 54,745–54,563 support zone.
If the support zone holds, intraday pullbacks are possible — traders may look for quick scalps on the long side but with strict stop-losses.
A breakdown below 54,563 will open deeper downside levels, creating opportunities for option writers on the short side.
Risk note: After a gap-down, avoid panic selling at open. Allow the index to retest broken levels — failed retests often provide high-probability trades.
📌 Risk Management Tips for Options Traders
Always trade with a defined stop-loss — never average into a losing trade.
Avoid trading in the first 5 minutes after a big gap; let volatility settle.
Position sizing is key — never risk more than 1–2% of total capital on a single trade.
Use hedged strategies like spreads instead of naked positions when IV (implied volatility) is high.
Remember, missing a trade is better than forcing a wrong trade. Patience pays.
📊 Summary & Conclusion
🟢 Sustaining above 55,528 opens doors to 55,687 → 55,954–56,061.
🟧 Flat opening near 55,168 makes it a decision zone for either breakout or breakdown.
🔴 Below 55,168, weakness may drag Bank Nifty toward 54,745–54,563.
Key pivot for the day: 55,168.
⚠️ Disclaimer: I am not a SEBI-registered analyst. The above analysis is for educational purposes only. Please do your own research or consult a financial advisor before making any trading decisions.

A possible Head and Shoulder formation in BankniftyChance of a head and shoulder formation on the hourly chart of the Index.
If the market clears the resistance line around 57300, it can form another high or test the recent high made.
On the lower side, there is are support and it may respect the support levels.
Major support levels :- 56800, 56640
Resistance levels :- 57285, 57600
Wait for the market to move above the neck line for any bullish trade to enter in the index. Else bearish trade can be initiated below 56650 levels.
Watch for the price action near the price levels before entering the trade.

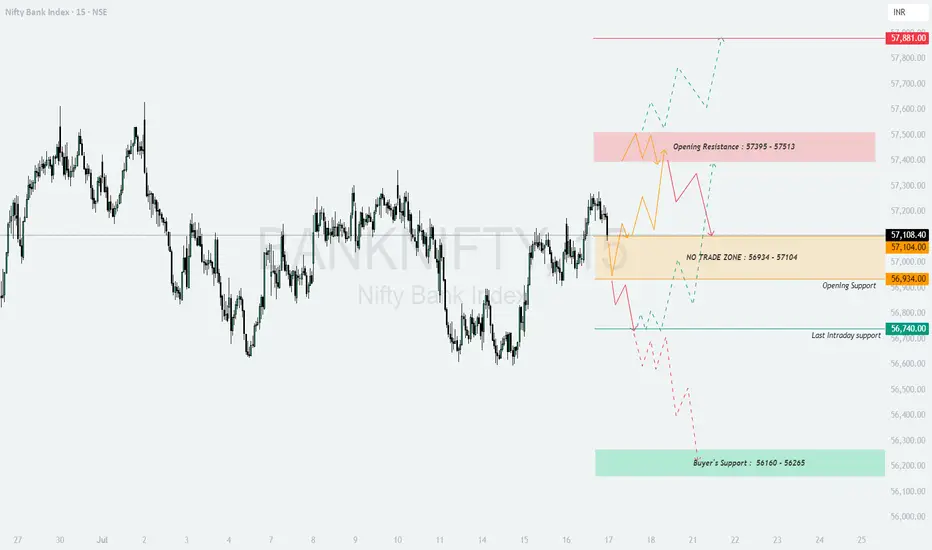
BANKNIFTY : Intraday Trading levels and Plan for 17-July-2025📊 BANK NIFTY INTRADAY TRADING PLAN – 17-Jul-2025
200+ Points Gap Opening Considered Significant | Structured by Psychological Zones
📍 KEY ZONES AND LEVELS TO MONITOR:
🟥 Opening Resistance Zone: 57,395 – 57,513
🔴 Profit Booking Resistance: 57,881
🟧 NO TRADE ZONE: 56,934 – 57,104
🟦 Opening Support: 56,934
🟩 Last Intraday Support: 56,740
🟩 Buyer’s Support Zone: 56,160 – 56,265
🚀 SCENARIO 1: GAP-UP OPENING (Above 57,395) 📈
If BANK NIFTY opens above 57,395 with 200+ points gap-up, the market enters the Opening Resistance Zone (57,395 – 57,513) .
Buyers should be cautious within this zone, focusing only on quick momentum scalps until a 15-minute candle closes above 57,513 .
If 57,513 breaks and sustains, the next target would be 57,881 (Profit Booking Resistance) .
Options Tip: Deploy ATM Call Options with small quantity initially, increase exposure only on candle confirmation. Avoid far OTM calls in strong gap-ups.
📊 SCENARIO 2: FLAT OPENING (Between 56,934 – 57,104) ⚖️
This zone is marked as NO TRADE ZONE on the chart. Prices may behave indecisively here, so patience is key.
If BANK NIFTY sustains above 57,104 after opening flat, expect upside continuation toward the Opening Resistance Zone.
If BANK NIFTY breaks below 56,934 , look for weakness targeting Last Intraday Support 56,740 .
Options Tip: Consider Iron Condor or Strangle Writing setups within this NO TRADE ZONE if volatility is high. Otherwise, wait for breakout confirmation.
📉 SCENARIO 3: GAP-DOWN OPENING (Below 56,740) ⚠️
If BANK NIFTY opens below 56,740 with a significant gap, bearish momentum is confirmed.
The immediate downside target would be the Buyer’s Support Zone: 56,160 – 56,265 .
Sell-on-rise strategy can be considered after the first 15-minute candle closes below 56,740 .
Options Tip: Prefer ATM or ITM Put Options or build Bear Put Spreads for controlled risk-reward. Avoid naked shorts in case of sudden reversal.
💡 RISK MANAGEMENT TIPS FOR OPTIONS TRADERS
📏 Risk only 1–2% of capital per trade.
⏳ Avoid aggressive entries in the first 15–30 minutes ; let price settle.
🔐 Use Hourly Candle Close for major decision stops, not just wick-based SL.
⚖️ Consider Hedged Strategies (like spreads) during volatile conditions.
📅 Avoid trading just before major news events or expiry if possible.
📌 SUMMARY & CONCLUSION
Bullish Scenario: Gap-up above 57,395 → Target 57,881
Neutral Scenario: Flat between 56,934 – 57,104 → Wait for breakout confirmation
Bearish Scenario: Gap-down below 56,740 → Target 56,160 – 56,265
Trade cautiously around marked zones and follow structured rules. Consistency over prediction!
⚠️ DISCLAIMER: I am not a SEBI-registered analyst. This plan is shared for educational and informational purposes only. Please consult your financial advisor before making any investment decisions.
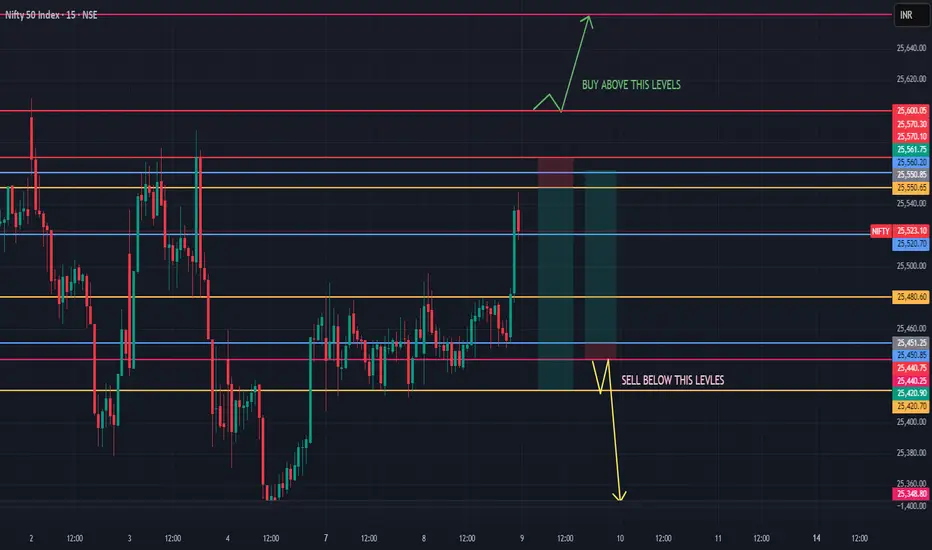
NIFTY INTRADAY LEVELS ( EDUCATIONAL PURPOSE) 09/07/2025🔷 NIFTY Intraday Trade Setup – 09 July
📊 Chart Timeframe: 15-min | Entry/Exit: 1-min TF
🔼 GAP-UP Opening (Above 25,550)
✅ Sell on breakdown below 25,540
🎯 Target: 25,480 → 25,420
🛑 Stop Loss: 25,570
Reason: Previous resistance zone; sellers may dominate
📌 Buy only above 25,600 with strong volume breakout
🎯 Target: 25,660 → 25,700
🛑 SL: 25,570
🔽 GAP-DOWN Opening (Below 25,450)
✅ Buy above 25,470 with bullish price action
🎯 Target: 25,520 → 25,560
🛑 Stop Loss: 25,440
📌 Sell below 25,420 if support breaks
🎯 Target: 25,350 → 25,300
🛑 SL: 25,460
🔁 FLAT Opening (Between 25,480 – 25,530)
🔁 Buy near 25,480–25,500 zone if strong support holds
🎯 Target: 25,550 → 25,600
🛑 SL: 25,470
🔁 Sell near 25,540–25,550 on rejection or resistance
🎯 Target: 25,490 → 25,450
🛑 SL: 25,570
⚠️ 1-Min Execution Tips:
✅ Wait for 1st 5-min candle to complete
📉 Avoid revenge trades post-breakout failure
🔁 Focus on structure, not emotion
🔄 Adjust levels dynamically with volume spike
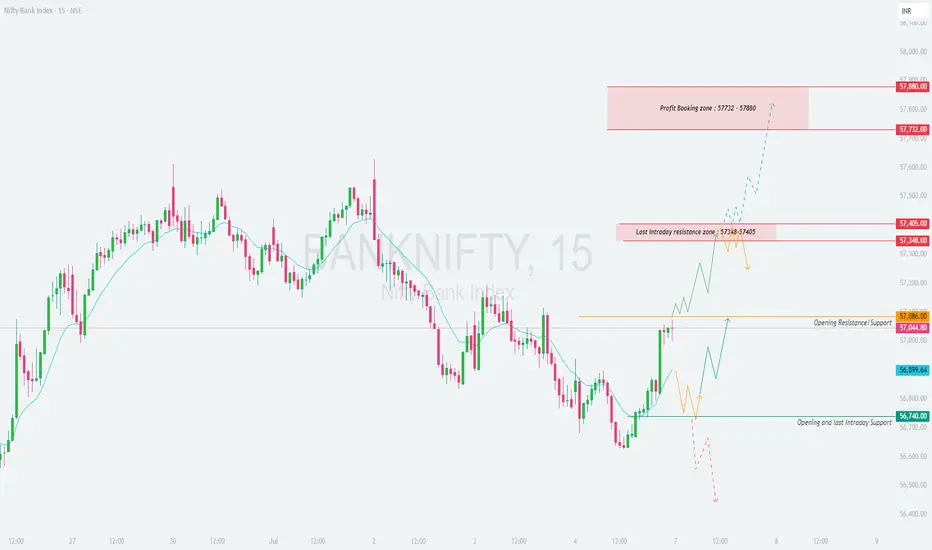
BANKNIFTY : Trading levels and plan for 07-July-2025📘 BANKNIFTY TRADING PLAN – 07-Jul-2025
🕒 Timeframe: 15-Minute | 📈 Structure: Support & Resistance Reaction Zones | ⚙️ Logic: Price Action-Based Intraday Decisioning
📍 Key Levels to Watch:
🔸 Opening Resistance / Support Zone: 57,086
🔸 Last Intraday Resistance Zone: 57,348 – 57,405
🔸 Profit Booking Zone: 57,732 – 57,880
🔹 Opening & Intraday Support Zone: 56,740
🔹 Minor Support Before Breakdown: 56,899
🟩 1. GAP-UP Opening (200+ points above 57,086)
If Bank Nifty opens near or above 57,300–57,400, it will be entering the Last Intraday Resistance Zone. Wait for price to sustain above 57,405 on 15-min candle close to confirm bullish strength.
📈 Action: Buy on breakout above 57,405, targeting 57,732 – 57,880 zone. Partial profit can be booked at 57,732.
🛑 Stop Loss: Keep SL just below 57,348 zone or use 15-min candle low.
⚠️ Caution: Avoid fresh longs near 57,800, as this is a profit booking zone.
If price fails to hold above 57,405 and shows rejection candles like doji/inverted hammers:
📉 Action: Consider shorting with SL above 57,405, targeting 57,086.
🛑 SL: Above the rejection wick
🎯 Target: Retest of breakout near 57,086
🟨 2. Flat Opening (between 56,899 – 57,086)
This range is the neutral zone, where the index may consolidate or create a directional breakout.
🕒 Wait for the first 15–30 mins to allow price action to unfold.
📈 If price breaks above 57,086 with volume, initiate long trade toward 57,348 – 57,405.
📉 If price rejects from 57,086 or breaks below 56,899, a short trade toward 56,740 becomes viable.
🛑 SLs: Use candle-close basis stops near breakout/breakdown levels.
🟥 3. GAP-DOWN Opening (200+ points below 56,740)
A gap-down below 56,740 brings us directly near the last intraday support breakdown area.
📉 Action: Sell on breakdown retest of 56,740, target 56,500 – 56,410 if downside continues.
🔄 Reversal Trade: If price sharply rebounds from 56,740 and crosses 56,899, consider reversal long trades with target 57,086.
🛑 SL: For short – above breakdown candle; for reversal – below support low.
💡 Risk Management Tips for Options Traders:
✅ Trade near breakout/breakdown zones, avoid chasing after wide moves
✅ Avoid buying deep OTM options in time decay zones (post 1 PM)
✅ Keep risk fixed per trade – e.g., 1%–2% of capital
✅ Use spreads (like bull call spread or bear put spread) when volatility is high
✅ Exit when trade structure invalidates (even before SL hits)
📝 Summary & Conclusion:
🔹 Price is currently reacting around the opening supply zone of 57,086.
🔸 Bulls will need to sustain above 57,405 to push toward the 57,732 – 57,880 zone.
🔻 Bears will gain momentum below 56,740, targeting deeper correction.
🕒 Best trades usually form after 15–30 mins of price stability – avoid rushing entries.
⚠️ Disclaimer:
I am not a SEBI-registered analyst . This analysis is for educational purposes only. Please do your own research or consult a financial advisor before making any trading decisions.
BANNK-NIFTY LEVELS FOR INTRADAY (EDUCATIONAL PURPOSE) 27/05/2025📊 Bank Nifty Intraday Trading Plan (27th June)
🕐 Chart: 15-min (analysis) | 1-min (execution)
🔍 Trend: Strong breakout above 57100
📈 If Gap-Up Opening above 57200:
✅ Buy on 1-min bullish candle close above 57250
🎯 Target: 57350 / 57420
🛑 SL: 57160
⚠️ Avoid chasing — wait for retest & strength confirmation.
📉 If Gap-Down Opening below 57000:
✅ Sell below 56950 with breakdown confirmation
🎯 Target: 56800 / 56650
🛑 SL: 57060
⚠️ Avoid shorting if 56800 is defended strongly.
💡 Golden Tip:
Use VWAP & Volume on 1-min for entry validation.
No trade = Best trade if there's no clarity.

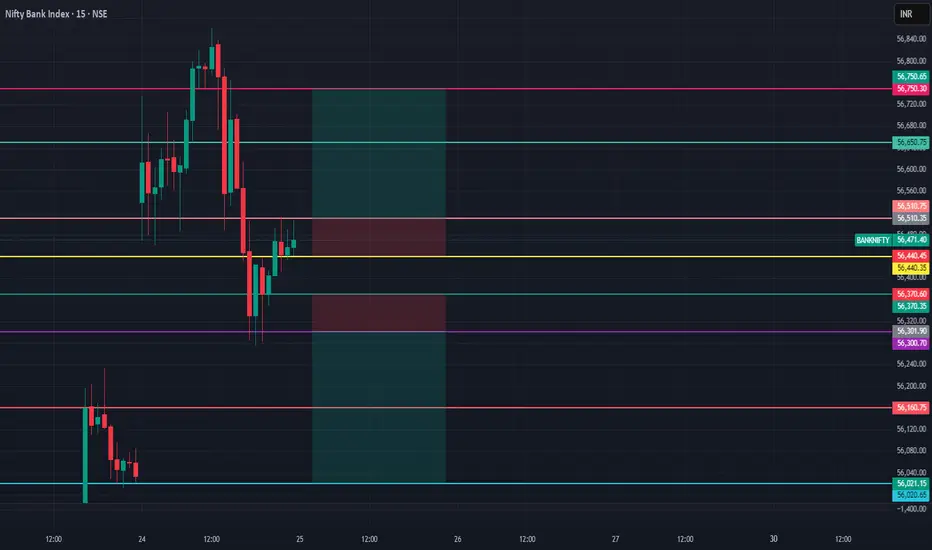
BANKNIFTY levels for Intraday ( Educational Purpose ) 25/06/2025🚨 Bank Nifty Intraday Plan – 25/06/2025
⏱️ Based on 15-min chart | Executed on 1-min
🔼 Buy Above: 56,510
🎯 Target: 56,650 / 56,750
🛑 SL: 56,440
🔽 Sell Below: 56,300
🎯 Target: 56,160 / 56,020
🛑 SL: 56,370
📉 Gap-Up Opening:
🔹 Wait for price rejection near 56,650–56,750
🔹 Avoid chasing highs — confirm 5-min candle reversal
📈 Gap-Down Opening:
🔹 Look for base near 56,160–56,100
🔹 Buy only if strong bounce on volume seen
📌 Note:
✅ Use 1-min candle confirmation for entry
❌ Don’t enter blindly on open
🧠 Stick to 1:2 RR | Strict SL Discipline
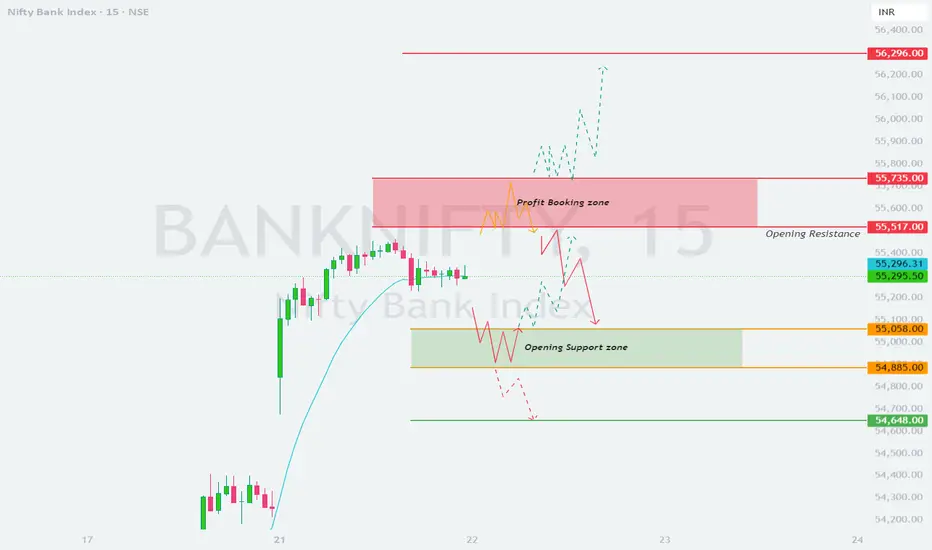
BANKNIFTY : Trading plan and levels for 21-JUN-2025
\ 📊 BANK NIFTY TRADING PLAN – 21-Jun-2025\
📍 \ Previous Close:\ 56,216.50
📏 \ Gap Opening Threshold:\ 200+ points
🕒 \ Timeframe:\ 15-minute chart (price action-based planning)
---
\
\ \ 🚀 GAP-UP OPENING (Above 56,664):\
If Bank Nifty opens above 56,664, it will be entering fresh bullish territory. This level marks the **breakout zone**, and caution is needed for confirmation trades.
✅ \ Plan of Action:\
• Monitor price action for 15–30 minutes.
• If price sustains above 56,664, the index may show follow-through up-move.
• Potential upside targets: \ 56,800 – 56,950\ range.
• However, if the index gets rejected from 56,664 with selling pressure, watch for a pullback toward the **NO TRADE ZONE (56,261–56,109)**.
🎯 \ Trade Setup:\
– Long only if 15-min candle closes above 56,664
– Stop-loss: below 56,500
– Target: 56,800 and trail higher
📘 \ Tip:\ Don’t buy aggressively at open. Let the breakout be confirmed with volume. Gaps often retrace if broader market doesn't support.
\ \ 📘 FLAT OPENING (Between 56,044 – 56,261):\
This is the **NO TRADE ZONE** where indecision is high. Price can whipsaw both sides and create traps.
✅ \ Plan of Action:\
• Stay patient in first 15 minutes — let price choose direction.
• \ Bullish Setup:\ Buy only if price sustains above 56,261 and shows strength toward 56,664
• \ Bearish Setup:\ Sell if price breaks below 56,044 with a convincing close
• Avoid random trades inside 56,109–56,261 zone
🎯 \ Trade Setup:\
– Long > 56,261 or Short < 56,044
– Use tight SLs and quick profit-booking in such zones
📘 \ Tip:\ Range trades can fail here. Let levels break before initiating positions.
\ \ 📉 GAP-DOWN OPENING (Below 55,889):\
If the index opens below the previous support of 55,889, expect weakness to prevail.
✅ \ Plan of Action:\
• Immediate support lies at \ 55,652\ . A bounce may be seen from this level.
• Breakdown below 55,652 can lead to 55,400–55,250 zones
• Watch for reversal candles if testing support, else shorting opportunities emerge
🎯 \ Trade Setup:\
– Sell below 55,652 with SL above 55,800
– Only go long if price sharply reverses from 55,652 with volume
📘 \ Tip:\ Gaps to the downside are usually accompanied by panic. Don’t chase trades, wait for structure to develop.
---
\ 🛡 RISK MANAGEMENT & OPTIONS TRADING TIPS:\
✅ \ 1. Avoid first 5-min trades – let volatility settle\
✅ \ 2. Prefer ATM or slightly ITM options to avoid high theta decay\
✅ \ 3. Don’t over-leverage after gap opens – premiums are inflated\
✅ \ 4. Use trailing SL once in profit – lock gains smartly\
✅ \ 5. Avoid blind straddles in NO TRADE ZONES – wait for directional clarity\
---
\ 📌 SUMMARY – LEVELS TO WATCH FOR 21-Jun-2025:\
• 🟠 \ NO TRADE ZONE:\ 56,109 – 56,261
• 🟥 \ Breakout Resistance:\ 56,664
• 🟩 \ Opening Support:\ 56,044
• 🟦 \ Last Intraday Support:\ 55,889
• 🔻 \ Support for Breakdown:\ 55,652
💡 \ Strategy Recap:\
• 🔼 Above 56,664 = Bullish
• ⏸ Inside 56,109–56,261 = Wait & watch
• 🔽 Below 55,889 = Caution for shorts
---
\ 📢 DISCLAIMER:\
I am not a SEBI-registered analyst. This plan is shared for educational purposes only. Please consult your financial advisor before making trading decisions. Trade responsibly. 💹

Bank Nifty Prediction Tomorrow and Weekly Update 📈 Bank Nifty Weekly View (Post Indo-Pak Tension Relief)
Now that the war-like tension between India and Pakistan has de-escalated, market sentiment seems to be stabilizing — and this could reflect in Bank Nifty’s movement as well.
Key Levels to Watch:
Support: 53594.90
If this level holds, there’s a strong possibility of upward momentum.
Resistance: 54268.85
This would be the immediate target if a bullish breakout occurs.
Pending Demand Zone: 52441.25
Keep in mind, this is a major demand zone that still hasn’t been tested. If weakness returns, a correction toward this level is possible.
🧭 Possible Scenarios:
🔻 Gap-Down Opening (Low Probability):
Since geopolitical tensions have eased, chances of a gap-down opening are low. But if it happens, the market may remain range-bound throughout the day.
🔺 Gap-Up Opening (High Probability):
If the market opens with a gap-up on the back of positive cues, we could see a strong upward move toward 54268.85.

BANKNIFTY - Trading Levels and Plan for 22-Apr-2025📅 Bank Nifty Intraday Trading Plan – 22-Apr-2025
Timeframe: 15-min
CMP (Close on 21-Apr): 55,295.50
🔴 Opening Scenario 1: Gap-Up Opening (Above 55,735 – 200+ Points)
A strong gap-up opening above the Profit Booking Zone (55,735) suggests bullish sentiment. However, buyers should remain cautious as this area is ripe for profit booking or short traps.
Wait for a 15-min candle to sustain above 55,735 to confirm strength.
If sustained, potential target is the next psychological resistance near 56,296.
Avoid chasing the gap-up blindly; best R:R trades come on slight dips toward 55,735–55,600 with stop loss below 55,517 (Opening Resistance).
💡 Tip: In case of an intraday rejection at 55,735, traders can look for put options with tight stop loss for a quick scalp back toward 55,517 or even 55,295.
🟡 Opening Scenario 2: Flat Opening (Within 55,100 – 55,517 zone)
A flat start keeps the market within a neutral consolidation zone. This gives flexibility for both bulls and bears to dominate based on early price action.
Watch initial 30 minutes. If price holds above 55,517 and breaks above with volume, it could attempt to revisit 55,735. Failure to cross 55,517 convincingly may push price back to 55,058 and possibly to the support zone near 54,885.
Inside this zone, prefer quick scalps based on price structure with proper SL and confirmation from volume.
💡 Tip: This is a good zone for deploying straddle or strangle strategies on options with a view to capture a breakout in either direction post-consolidation.
🔵 Opening Scenario 3: Gap-Down Opening (Below 55,100 – 200+ Points)
A gap-down below the Opening Support zone (55,058–54,885) may trigger panic among recent long positions.
Wait for price to test and react from 54,885. If there's a bounce, go long with SL below the day’s low. If the zone is breached convincingly, sellers can gain momentum targeting 54,600 and even 54,400 in extension. Avoid shorting the gap-down directly. Allow price to retest the breakdown or consolidate for clean entry.
💡 Tip: If sentiment is weak and volume increases, look for Bear Put Spread to limit risk while gaining from potential downside.
📘 Options Trading Risk Management Tips
Never average a losing options position. Time decay works against you. Use spread strategies to reduce premium cost and risk in volatile zones. Maintain a daily loss limit (e.g., 1.5–2% of capital) and stop trading once it's hit. Avoid holding OTM options post 2:30 PM unless a breakout has just confirmed.
📌 Summary & Conclusion
✅ Key Levels to Watch:
Resistance: 55,517 🟥 | 55,735 🟥 | 56,296 🟥
Support: 55,058 🟧 | 54,885 🟧
🎯 Whether it's a breakout or breakdown, wait for confirmation via price and volume. Focus on areas of high interest (highlighted zones) for clean setups. Always enter with a defined stop loss and manage risk, especially in options.
📚 Stay patient and trade with structure, not emotion. Don't chase price — let the trade come to you.
⚠️ Disclaimer: I am not a SEBI-registered analyst . All views are shared for educational purposes only. Please consult with your financial advisor before taking any trades.
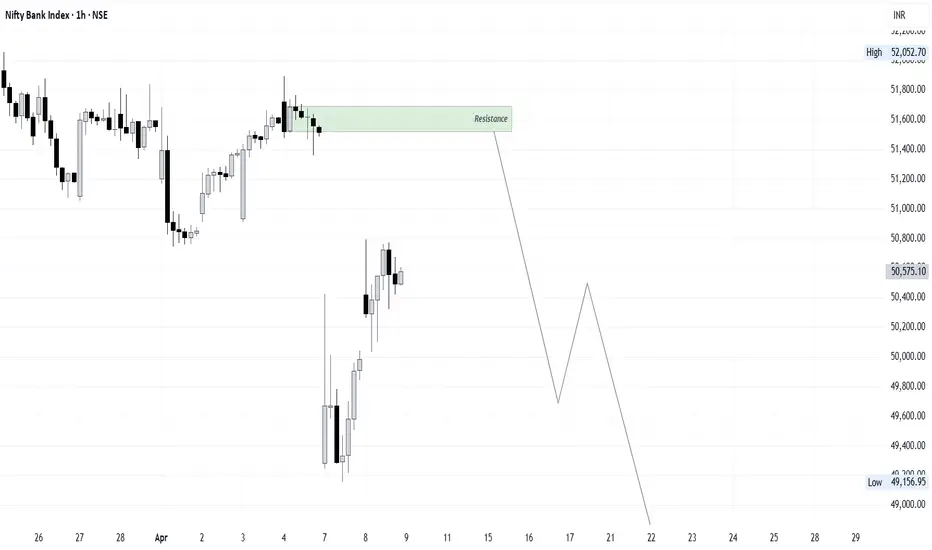
Bank Nifty Monthly Analysis: Key Support & Resistance LevelsFrom the monthly price action perspective, Bank Nifty has taken strong support at the 48,378.40 level. After the recent gap-down, the market has shown a good upward move. However, we are facing resistance at the 51,519.40 level. If there's any rejection from that level, the market might again take support around the 48,300 level.
This is just an idea for educational purposes. Please do not consider this as any kind of financial advice. It is solely meant for knowledge purposes.
Thank you.
BANKNIFTY : Trading levels and plan for 04-Apr-2025📌 BANK NIFTY Trading Plan – 04-Apr-2025
📊 Market Overview:
Bank Nifty closed at 51,581.55, showing a steady recovery but still facing resistance from a downward trendline. The opening resistance (51,781) and opening support (51,402 – 51,202) will be crucial in determining the trend for the day.
To navigate this session effectively, we will analyze all potential market opening scenarios and provide an actionable trading strategy.
🔼 Scenario 1: Gap-Up Opening (200+ points above 51,781)
A gap-up above 51,781 signals bullish momentum, but strength near 52,132 – 52,251 (last intraday resistance zone) will determine if the rally continues.
✅ Plan of Action:
If Bank Nifty sustains above 51,781, expect a move towards 52,132 → 52,251. A breakout above 52,251 could trigger further buying towards 52,500.
If Bank Nifty faces rejection at 52,132 – 52,251, expect a pullback towards 51,781, where it may either bounce or break down.
Avoid aggressive long positions near 52,251 unless a strong breakout with volume occurs.
🎯 Pro Tip: If the gap-up struggles to hold 51,781 in the first 15 minutes, profit booking may follow, leading to consolidation or a dip.
⚖ Scenario 2: Flat Opening (Within ±200 points, around 51,581)
A flat opening suggests indecision, where price action around the opening support (51,402 – 51,202) and resistance (51,781) will set the trend.
✅ Plan of Action:
Upside case: If Bank Nifty sustains above 51,781, expect a test of 52,132 – 52,251.
Downside case: If Bank Nifty slips below 51,402, it could test 51,202 (last intraday support), followed by 50,942 if selling intensifies.
No Trade Zone: Avoid trading inside 51,402 – 51,781 unless a strong breakout or breakdown occurs.
🎯 Pro Tip: Wait for a strong 15-minute candle close outside the range before initiating a trade to avoid false breakouts.
🔽 Scenario 3: Gap-Down Opening (200+ points below 51,202)
A gap-down below 51,202 indicates bearish sentiment, with key support at 50,942 being the last buyer’s zone.
✅ Plan of Action:
If Bank Nifty sustains below 51,202, expect a decline towards 50,942. A breakdown below 50,942 could push the index towards 50,700 – 50,500.
If Bank Nifty finds support at 50,942 and rebounds, look for a possible recovery towards 51,202 → 51,402.
Avoid panic shorting on a gap-down open; wait for confirmation before entering trades.
🎯 Pro Tip: A gap-down near a strong support zone could trigger a short-covering bounce. Wait for a reversal signal before taking long positions.
⚠️ Risk Management Tips for Options Traders
🛑 Avoid Over-leveraging – Stick to defined risk per trade and avoid emotional trading.
⌛ Theta Decay Awareness – If the market remains sideways, option premiums will erode rapidly.
🔄 Use Spreads for Risk Control – Consider hedged positions like Bull Call or Bear Put spreads instead of naked options.
📊 Trade at Key Levels – Avoid random trades; focus on high-probability setups.
📌 Summary & Conclusion
📍 Key Levels to Watch:
🟥 Resistance: 51,781 → 52,132 → 52,251
🟧 Opening Support/Resistance Zone: 51,402 – 51,202
🟩 Support: 50,942 → 50,700
🔸 Bullish Bias: Above 51,781, targeting 52,132 – 52,251
🔸 Bearish Bias: Below 51,202, expecting a drop towards 50,942 – 50,700
🔸 Neutral/Choppy: Inside 51,402 – 51,781, wait for a breakout
🎯 Final Advice:
Stick to the trading plan and execute trades only at key levels.
The first 15-30 minutes will define market sentiment—observe price action carefully.
Risk management is crucial—never risk more than you can afford to lose.
📢 Disclaimer
I am not a SEBI-registered analyst. This trading plan is for educational purposes only. Please conduct your own research or consult a financial advisor before making any trades.
🚀 Stay updated with real-time trade setups!

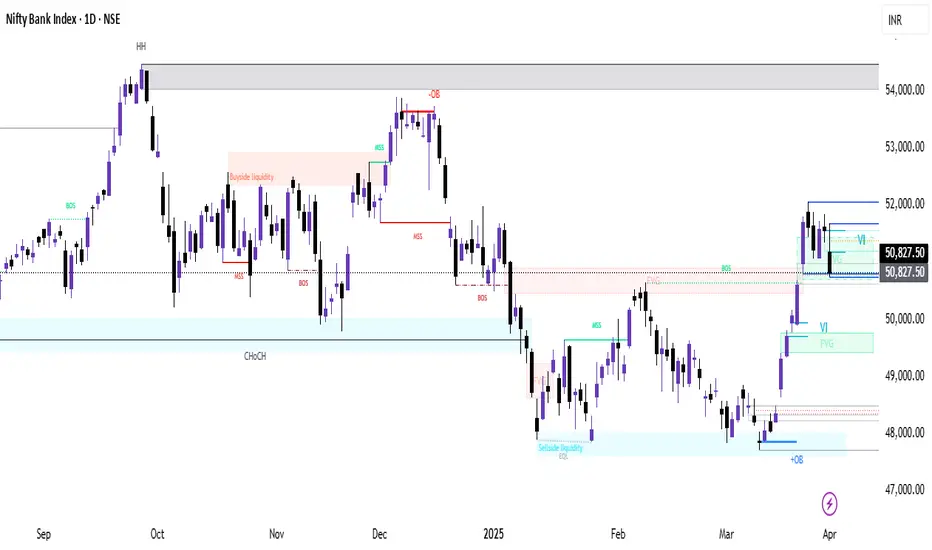
Nifty Bank Index (BANKNIFTY) Analysis & Trade Setup Timeframes & Context
We have three different timeframes: Daily (1D), 4-Hour (4H), and 1-Hour (1H).
1D gives us the macro view, showing key liquidity zones, order blocks (OBs), and break of structure (BOS).
4H refines our zones, helping to confirm areas of interest.
1H is the execution timeframe, where we define entry, stop-loss, and profit targets.
1️⃣ Higher Timeframe Bias - Daily Chart
📌 Key Observations:
A strong rejection from a higher timeframe supply zone near 52,000 - 52,400.
A liquidity grab (buy-side liquidity sweep) followed by a market structure shift (MSS) confirms bearish intent.
Break of Structure (BOS) indicates a downward trend continuation.
Fair Value Gaps (FVGs) suggest imbalance that the price may revisit before continuation.
📌 Bias: Bearish, expecting price to move lower.
📌 Key Levels:
Supply Zone (Resistance): 51,800 - 52,400
Demand Zone (Support): 48,000 - 49,000
Potential Target: 49,000 (near previous liquidity and OB)
2️⃣ Mid-Timeframe Confirmation - 4H Chart
📌 Key Observations:
A strong volume imbalance (VI) after the downward move.
Price has consolidated inside a 1H Fair Value Gap (FVG), signaling a possible retracement.
The previous low at 50,750 is being tested multiple times, suggesting liquidity is building.
📌 Bias: Bearish
Looking for a retracement to 51,200 - 51,400 (FVG area) before continuing downward.
Break below 50,750 confirms further selling.
📌 Key Levels:
Resistance: 51,200 - 51,400 (FVG + OB)
Support: 50,400 (short-term), 49,500 (major)
3️⃣ Entry Plan - 1H Execution Chart
📌 Trade Idea:
Wait for price to retest 51,200 - 51,400 (FVG zone).
If we see rejection (e.g., bearish engulfing candle or liquidity sweep), enter a short trade.
📌 Trade Parameters:
Entry: 51,200 - 51,400
Stop Loss: 51,600 (above OB)
Target 1 (T1): 50,400
Target 2 (T2): 49,500
Risk-Reward Ratio (RRR): ~1:3 or better
📌 Alternative Scenario:
If price breaks above 51,600, we invalidate the short setup.
In that case, we will reassess for a bullish continuation.
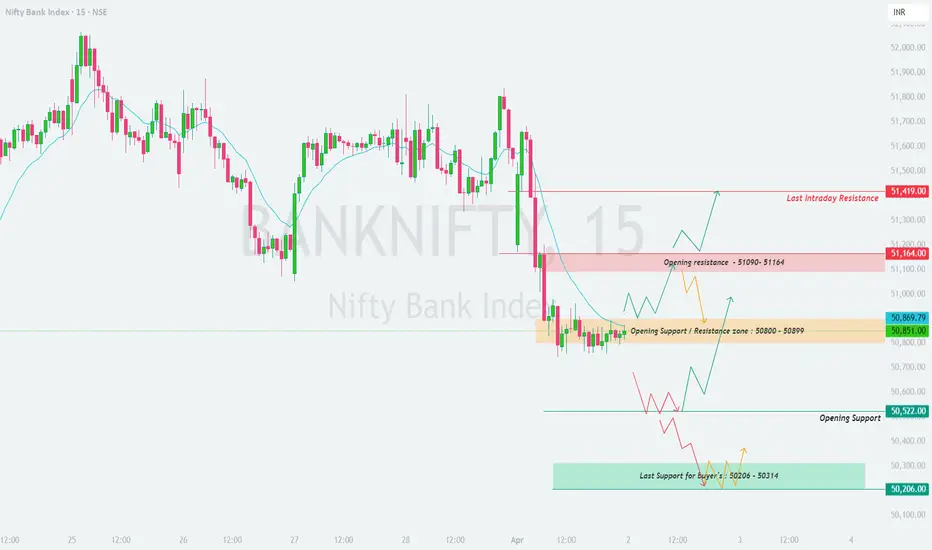
BANKNIFTY : Intraday Trading levels and Plan for 02-Apr-2025📌 BANK NIFTY Trading Plan – 01-Apr-2025
📊 Market Overview:
Bank Nifty closed at 50,851, consolidating near the Opening Support Zone (50,800 – 50,899). This price action suggests that the market is at a critical juncture, where the next move depends on price action confirmation at key levels.
To ensure a strategic and disciplined approach, let’s analyze all possible opening scenarios and their corresponding trading plans.
🔼 Scenario 1: Gap-Up Opening (200+ points above 51,100)
A gap-up above 51,100 indicates bullish momentum, but whether it sustains or reverses depends on the 51,164 – 51,419 resistance zone. This level is crucial as it can either lead to further upside or trigger profit booking.
✅ Plan of Action:
If Bank Nifty sustains above 51,164, expect a rally towards 51,419 → 51,600. If it breaks 51,600, a further bullish move toward 51,750 is possible.
If price faces resistance at 51,164 and starts reversing, expect a pullback toward 50,900. A breakdown below 50,800 can lead to further weakness.
Avoid aggressive longs inside 51,090 – 51,164, as this is a potential rejection zone. Wait for a decisive breakout or a bearish rejection to act accordingly.
🎯 Pro Tip: If the gap-up starts fading within 15-30 minutes, it signals a lack of buyer strength and increases the chances of a reversal.
⚖ Scenario 2: Flat Opening (Within ±200 points, around 50,850)
A flat opening near 50,850 suggests indecision, where price action will determine the next direction. The key battle will be between 50,800 support and 51,090 resistance.
✅ Plan of Action:
Upside case: If Bank Nifty breaks and sustains above 51,090, it may head towards 51,164 → 51,419. Monitor price action near these resistance levels before entering fresh longs.
Downside case: If Bank Nifty breaks below 50,800, it could test 50,522 → 50,314. A breakdown below 50,314 will shift the trend bearish.
Avoid trading inside the No Trade Zone (50,800 – 51,090), as price could consolidate before a breakout.
🎯 Pro Tip: In a flat opening, wait for a strong 15-minute candle close above or below key levels before entering trades.
🔽 Scenario 3: Gap-Down Opening (200+ points below 50,600)
A gap-down below 50,600 could indicate selling pressure, but buyers may step in around the 50,314 – 50,206 support zone.
✅ Plan of Action:
If Bank Nifty sustains below 50,522, expect a decline towards 50,314 → 50,206. A breakdown below 50,206 could lead to a sharp fall towards 50,000.
If Bank Nifty finds support at 50,206 and rebounds, it may recover towards 50,522 → 50,800. A strong close above 50,800 will shift momentum back to the bulls.
Be cautious of bear traps – If the market gaps down but quickly recovers, it could trigger short covering, leading to a strong upside reversal.
🎯 Pro Tip: If the gap-down occurs near a strong buyer’s support zone, wait for a bullish price action confirmation before entering long trades.
⚠️ Risk Management Tips for Options Traders
🔹 Avoid over-leveraging – Use proper position sizing to manage risk.
🔹 Theta Decay Awareness – If the market consolidates, option premiums will erode rapidly.
🔹 Use Spreads for Protection – Instead of naked options, use spreads to limit risk and improve probability.
🔹 Trade at Key Levels – Avoid impulsive trades; focus on defined support and resistance zones.
📌 Summary & Conclusion
📍 Key Levels to Watch:
🟥 Resistance: 51,090 → 51,164 → 51,419
🟧 No Trade Zone: 50,800 – 51,090
🟩 Support: 50,522 → 50,314 → 50,206
🔸 Bullish Bias: Above 51,090, targeting 51,164 – 51,419
🔸 Bearish Bias: Below 50,600, expecting a fall towards 50,314 – 50,206
🔸 Neutral/Choppy: Inside 50,800 – 51,090, avoid unnecessary trades
🎯 Final Advice:
Stick to the structured trading plan and execute only at key levels.
Avoid emotional trading—wait for confirmation before entering trades.
The first 15-30 minutes after market open will provide better clarity—observe price action before committing to a trade.
📢 Disclaimer
I am not a SEBI-registered analyst. This trading plan is for educational purposes only. Please conduct your own research or consult a financial advisor before making any trades.
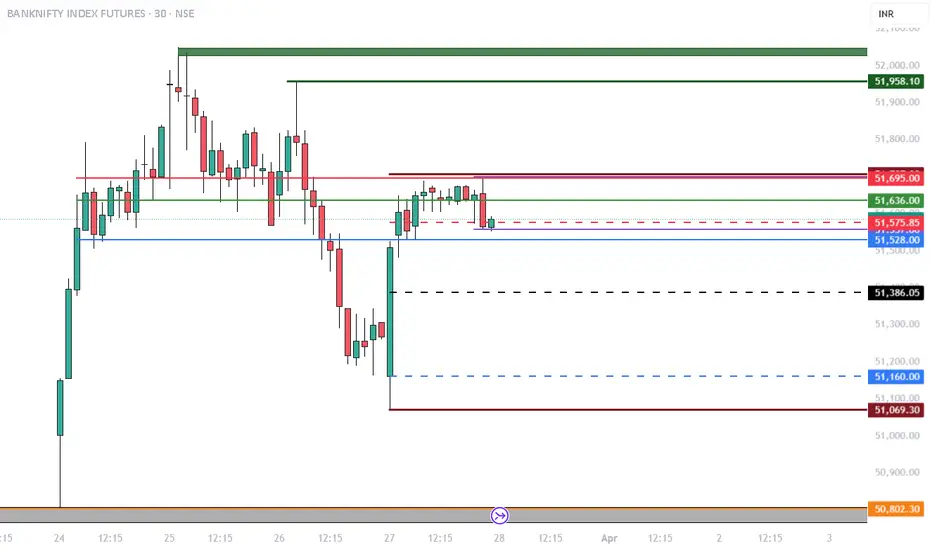
Bank nifty Futures 28.03.2025I am expecting a gap up today. This may be followed by a downward move but depends upon the opening which will be important. Also, the lines marked have important role to play.
we have a lean low volume tail indicative of buying. My strategy today will be to buy on dips and for that I may have to wait.
however, let's see the opening and how the dynamics play.
Important to study the dynamics with a broader perspective in mind.
Expecting a neutral day., but confirmation is possible after the IB is made.
BANKNIFTY : Intraday Trading Levels and Plan for 26-Mar-2025📌 BANKNIFTY Trading Plan – 26-Mar-2025
📊 Current Market Status:
BANKNIFTY closed at 51,490.30, witnessing some selling pressure from intraday highs. The structure remains uncertain, with key resistance and support levels dictating tomorrow's action. Let's break down the plan for different opening scenarios.
🔼 Scenario 1: Gap-Up Opening (200+ points)
If BANKNIFTY opens above 51,700, we need to assess the momentum before jumping in. A gap-up opening near 51,927 (last intraday resistance) might trigger initial profit booking.
✅ Plan of Action:
If prices sustain above 51,927, expect a move towards the profit booking zone at 52,143 – 52,235. A breakout above 52,235 could indicate bullish momentum.
If the index rejects 51,927 and starts reversing, a short opportunity can arise, targeting 51,744 → 51,490 as intraday levels.
Avoid aggressive longs if price remains within No Trade Zone (51,743 – 51,925). Wait for a decisive move.
🎯 Pro Tip: Avoid chasing the gap-up immediately—let the market settle and confirm strength above resistance before going long.
⚖ Scenario 2: Flat Opening (Within ±200 points)
A flat opening around 51,490 means BANKNIFTY is indecisive. Here, it’s crucial to wait for confirmation at key levels.
✅ Plan of Action:
Upside case: If the index breaks above 51,744, we could see a retest of 51,927. A strong breakout above this can push towards 52,143 → 52,235.
Downside case: A breakdown below 51,490 could trigger selling pressure towards 51,206 – 51,080.
Neutral Approach: Avoid trading in the No Trade Zone (51,743 – 51,925) unless a clear breakout occurs.
🎯 Pro Tip: In a flat opening, options traders can look for range-bound strategies like Iron Condors or straddle sells if volatility is low.
🔽 Scenario 3: Gap-Down Opening (200+ points)
If BANKNIFTY opens below 51,206, bearish sentiment might dominate, but we must assess support zones.
✅ Plan of Action:
If price sustains below 51,206, expect a drop towards 51,080 and 50,904. A further breakdown could trigger heavy selling.
If price takes support at 51,206 – 51,259 and rebounds, look for a potential pullback entry with stop-loss below 51,200.
Watch for trap setups—if the market opens low but quickly reverses above 51,206, it could be a bear trap leading to a short squeeze.
🎯 Pro Tip: In a gap-down scenario, avoid panic selling; instead, wait for a retest of breakdown levels before entering trades.
⚠️ Risk Management Tips for Options Traders
🔹 Avoid over-leveraging – Trade within your risk capacity and don't go all in.
🔹 Time decay factor – If taking options trades, be mindful of premium decay, especially near expiry.
🔹 Hedge your trades – Use spreads instead of naked options to reduce risk.
🔹 Wait for confirmation – Don't enter trades blindly; wait for price action signals.
📌 Summary & Conclusion
📍 Key Levels to Watch:
🟥 Resistance: 51,744 → 51,927 → 52,143 – 52,235
🟧 No Trade Zone: 51,743 – 51,925
🟦 Support: 51,206 – 51,259 → 51,080 → 50,904
🔸 Bullish Bias: Above 51,927 for targets of 52,143 – 52,235
🔸 Bearish Bias: Below 51,206 for a move towards 51,080 and lower
🔸 Neutral/Range-Bound: If price remains between 51,743 – 51,925
🎯 Final Advice:
Follow the levels with discipline.
Avoid overtrading in No Trade Zones.
Let the first 15-30 minutes settle before taking aggressive trades.
📢 Disclaimer
I am not a SEBI-registered analyst. This analysis is for educational purposes only. Please do your research or consult with a financial advisor before making trading decisions.
🚀 Stay updated on live trading levels & setups!
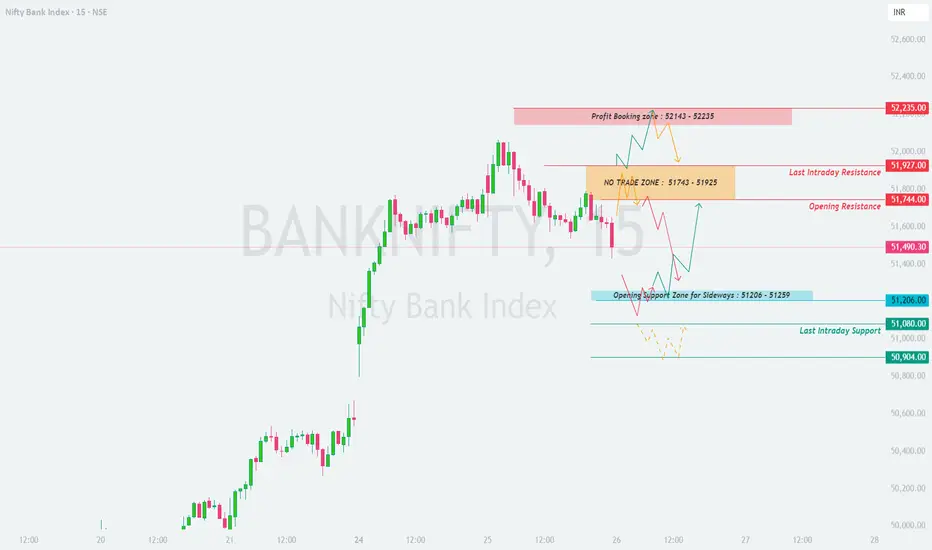
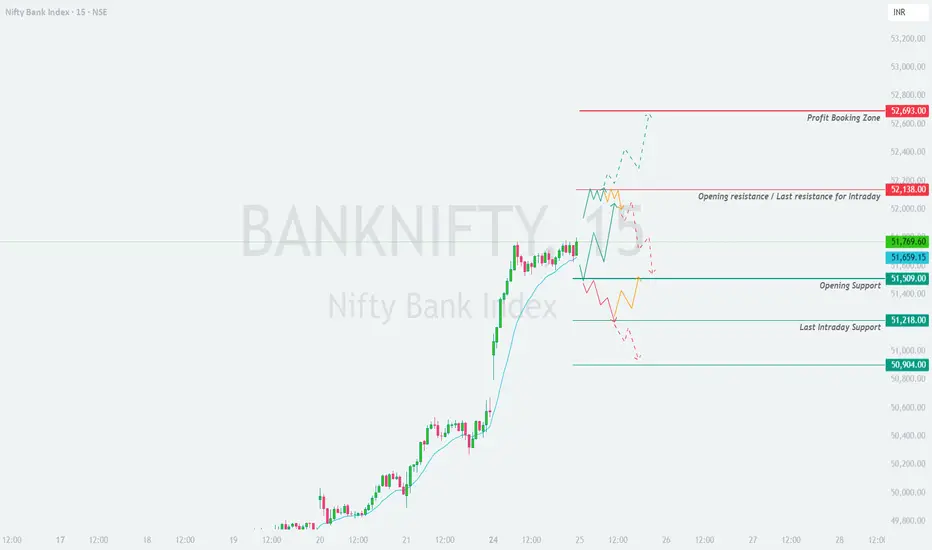
BANKNIFTY : Intraday Levels and Plan for 25-Mar-2025📅 BANK NIFTY Trading Plan – 25th March 2025
⏰ Timeframe: 15-min | 📊 Index Spot Reference: 51,769
🚀 Opening Scenario 1: GAP-UP Opening (200+ points)
If BANK NIFTY opens above 51,969+ (200 points or more):
Monitor price action near the Opening Resistance / Last Intraday Resistance Zone – 52,138 . This is a crucial level where sellers might become active. A strong bullish candle above 52,138 , sustained for 15 mins with volume, could trigger momentum towards the Profit Booking Zone around 52,693 . However, if price shows rejection signs (doji, shooting star, or long upper wicks) at 52,138 , consider shorting with SL above 52,200 on a 15-min candle close basis. The move towards 52,693 is likely to attract profit booking. Use this zone as a potential exit for long positions or consider building short positions only if reversal candles appear. Any failure to hold above 52,138 may lead to a retest of the support zone at 51,659 – 51,509 .
🧠 Tip: Avoid aggressive longs directly at resistance. Wait for confirmation of breakout or signs of reversal. Option traders can use debit spreads (buy ATM CE, sell OTM CE) to limit risk.
📈 Opening Scenario 2: FLAT Opening (within ±200 points)
If BANK NIFTY opens near 51,700–51,800:
A range-bound session is possible early on. Let the first 15–30 minutes play out to gauge direction. Sustained price action above 51,769 can retest 52,138 . Bulls must close candles above this level to expect higher targets like 52,693 . Breakdown below 51,659 increases the chances of testing the Opening Support at 51,509 . Reversal entries can be initiated near support levels if bullish candle patterns appear with confirmation. This zone offers both long and short opportunities based on real-time price reaction. Don’t preempt trades.
🧠 Tip: If expecting a sideways day, option sellers may consider short strangles or iron condors with tight SL. Always manage positions with proper hedge or SL orders.
📉 Opening Scenario 3: GAP-DOWN Opening (200+ points)
If BANK NIFTY opens near or below 51,500:
Immediate support lies near 51,509 . If this breaks on strong bearish candles, expect a fall towards 51,218 and further down to 50,904 . Aggressive sellers might enter if 51,509 is breached decisively. However, wait for confirmation rather than chasing the opening candle. Any recovery attempt will face resistance near 51,659 – 51,769 . Watch for rejection to re-enter shorts. Reversal buyers may consider 51,218 or 50,904 if bullish engulfing or hammer patterns appear. Ideal for scalping trades. Stay nimble, as gap-down days can be volatile and trap both bulls and bears.
🧠 Tip: Avoid buying puts after large gaps – premiums are inflated. Consider bear put spreads or calendar spreads to minimize theta decay.
🛡️ Risk Management Tips for Options Traders:
Never allocate more than 2–5% of your capital on a single trade. Always trade with SL (Stop Loss) in place – do not hold losing positions hoping for recovery. Use spreads instead of naked options to reduce theta impact and protect against sudden reversals. Avoid trading 0-DTE (same day expiry) options unless you’re an experienced scalper. Review your trade post-market and journal the logic – it improves discipline and learning.
📌 Summary & Conclusion:
✅ Upside Levels:
→ 52,138 – Crucial resistance for intraday
→ 52,693 – Strong profit booking zone
✅ Downside Levels:
→ 51,509 – Opening Support
→ 51,218 – Last intraday support
→ 50,904 – Breakdown danger zone
🎯 Ideal Approach:
→ For gap-up: Wait for strength above 52,138 or reversal signs to short.
→ For flat: Follow breakout or breakdown setups near support/resistance.
→ For gap-down: Let price stabilize near supports; trade only on confirmation.
🚨 Avoid emotional trades. Let price action confirm direction. Be flexible and adaptive based on live market structure.
⚠️ Disclaimer: I am not a SEBI-registered analyst. All views shared above are for educational and informational purposes only. Please do your own research or consult your financial advisor before making any investment or trading decision.
Bank Nifty SpotBank NIfty Spot
for 24 - 28 March 2025
last week NS opened @ 48219.55
gave incredible 1500+ points
The important level is 50775 (30min close) for the BNS to give a fresh breakout.
Similarly if the BNS makes a 30m close below 50775 then probably 50700 PE can be a best bet for options players....
Again exiting position at a level mentioned below that...
Level to level trading is recommended...
Happy trading and Profit making with proper planning..
Like.. Share.. Comment...

NIFTY BANK Prediction for Tomorrow – March 25, 2025What happened on last day:
As we discussed, BANKNIFTY had been consolidating in a wide range, and it finally gave a breakout to the upside.
If we look at the chart now:
The market has broken out above the immediate resistance zone of 50,300–50,500 , and is now trading just above the 200 EMA (1D-tf) . The breakout candle was backed by strong volume , indicating institutional participation.
BANKNIFTY is forming a higher low structure , and has broken a significant resistance from its previous congestion zone.
The 13 EMA, 50 EMA, and 100 EMA are all aligned below the price, with 200 EMA recently reclaimed — supporting a bullish bias.
RSI = 65 , shows good momentum and strength, but bulls will need to defend these levels for continuation.
Price is also trading well above VWAP , reinforcing the short-term bullish sentiment.
Support zone: 49,800 – 50,200
Resistance levels: 51,680, 52,000 (trendline), 54,467 (swing high)
If we look at the OI data:
PCR = 1.3 , clearly shows a bullish sentiment in the derivatives segment.
There is heavy Put writing at 50,000, 50,200, and 50,500 which will now act as immediate support levels.
On the upper side, mild Call writing has been seen near 51,500–52,000, which aligns with the trendline resistance shown on the chart.
We are in the last week of the monthly expiry (27 March) , so these zones will play a decisive role.
If we look at the news & sentiment:
INDIA VIX = 12.6 remains stable.
No negative news on banking or macroeconomics.
FII inflow data shows recovery, and overall sentiment is bullish-to-cautious .
Eyes are on whether BANKNIFTY can close and hold above the 51,000–51,200 levels.
I am expecting
The market to be sideways to bullish with a possible breakout above 51,680 leading to a test of 52,000–52,300 , if sustained.
Reasons:
✅ Breakout above major supply zone with strong volume
✅ Price > EMA(13, 50, 100, 200) confirms bullish alignment
✅ PCR = 1.3 suggests strong bullish sentiment
✅ Above VWAP and RSI > 60 supports momentum
❗Approaching trendline resistance near 52,000
Verdict: Sideways or Bullish
Plan of action:
Sell 51,500 CE and 50,500 PE — create a slightly bullish range.
Exit one leg if price breaks 52,000 or falls below 50,300 with volume.
