[INTRADAY] #BANKNIFTY PE & CE Levels(18/09/2025)For Bank Nifty, the index is likely to open around the 55,500 mark, indicating a positive start. Sustaining above the crucial zone of 55,050–55,100 will be key for maintaining bullish momentum. If this level holds, the index may witness an upside move toward 55,250, 55,350, and 55,450+. A breakout and close above 55,550 will further strengthen the upward trend, paving the way for higher levels at 55,750–55,950+.
On the downside, immediate support is placed at 54,950–54,900. If this zone fails to hold, weakness could emerge, dragging the index lower toward 54,750 and further down to 54,550-. These levels will act as important short-term supports for traders to watch.
Overall, the structure remains bullish with a gap-up opening, but profit booking around resistance levels cannot be ruled out. Traders should look for opportunities on the upside while keeping strict stop-losses to manage risk effectively.
Bankniftylevels

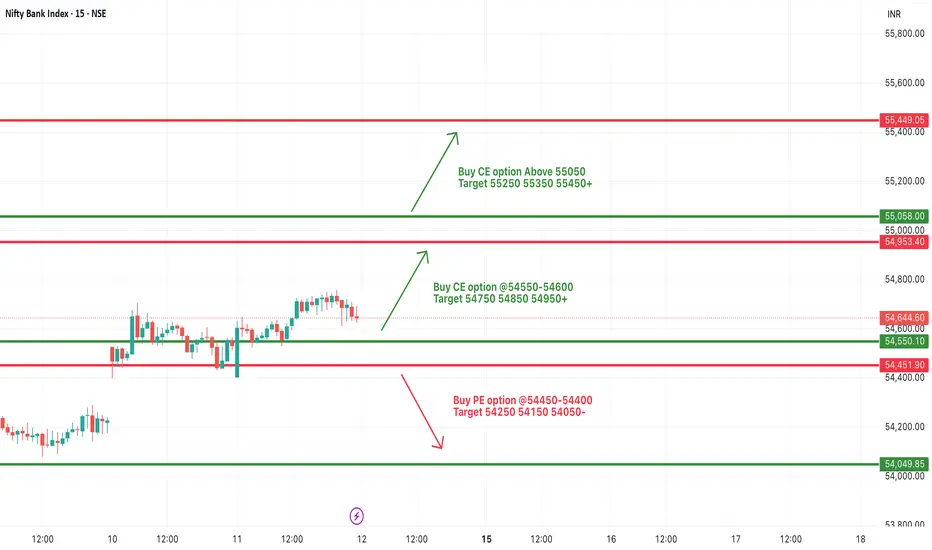
[INTRADAY] #BANKNIFTY PE & CE Levels(12/09/2025)Bank Nifty is expected to open with a gap up, reflecting positive sentiment in the market. The index has been consolidating within a tight range, and today’s opening may provide fresh directional cues depending on how it reacts around the key levels.
On the upside, if Bank Nifty sustains above the 54,550–54,600 zone, a bullish move can be anticipated. In this scenario, call option buying or long positions can target levels of 54,750, 54,850, and 54,950+. A further breakout above 55,050 may open the door for an extended rally towards 55,250 and 55,350 levels.
On the downside, if the index fails to hold above 54,550 and slips below 54,450–54,400, weakness may emerge. This could drag Bank Nifty towards 54,250, 54,150, and 54,050 levels, where strong support is placed.
Overall, the sentiment remains mildly bullish with a gap up opening, but traders should watch whether Bank Nifty sustains above the breakout zones for a clear intraday trend. Maintaining strict stop-losses remains crucial to manage risk in such range-bound yet volatile conditions.
[INTRADAY] #BANKNIFTY PE & CE Levels(11/09/2025)Bank Nifty is expected to witness a slightly gap up opening, indicating a steady start after recent range-bound sessions. The index continues to consolidate near crucial resistance and support levels, and today’s movement will play an important role in setting the tone for intraday trades.
On the upside, if Bank Nifty sustains above the 54,550–54,600 zone, buying momentum may strengthen. This could lead to an upward move towards 54,750, 54,850, and 54,950+, where further resistance is expected. A breakout above 54,950 will open the possibility of an extended rally.
On the downside, if the index slips below 54,450–54,400, selling pressure may emerge. This can drag Bank Nifty towards 54,250, 54,150, and 54,050 levels, with deeper declines possible if 54,050 fails to hold.
Overall, the market remains neutral to range-bound with both bullish and bearish opportunities available around key breakout levels. Traders are advised to wait for confirmation and trade with strict stop-losses to manage risk effectively.

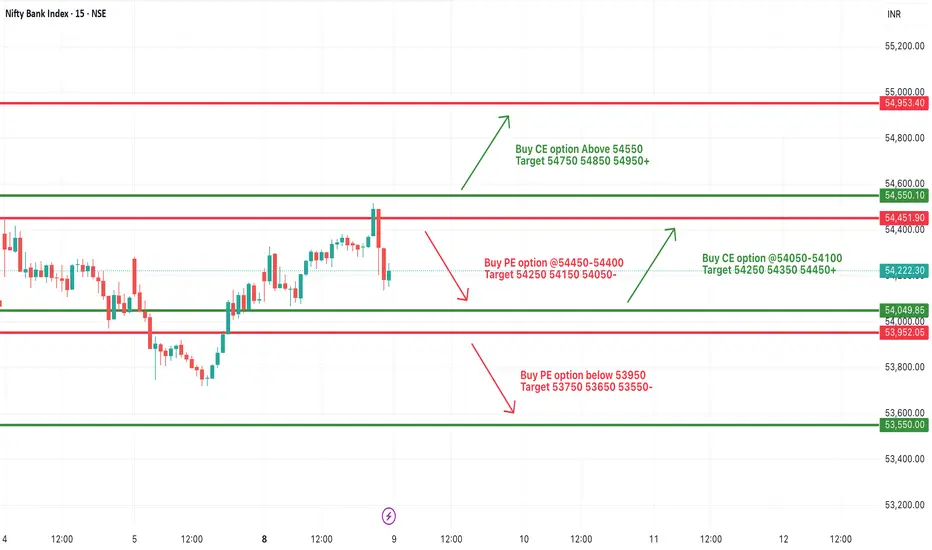
[INTRADAY] #BANKNIFTY PE & CE Levels(09/09/2025)Bank Nifty is expected to open with a gap up today, signaling a positive start to the session. The index is currently trading within a key range, and today’s price action could provide clearer directional cues for intraday traders.
On the upside, buying opportunities will strengthen if Bank Nifty sustains above 54,550. A breakout above this level may trigger further bullish momentum, with upside targets at 54,750, 54,850, and 54,950+. Traders can also look for an early entry if the index moves between 54,050–54,100, where call options may perform well with targets at 54,250, 54,350, and 54,450+.
On the downside, immediate weakness could appear if the index falls below 54,450–54,400. In such a case, put options may gain momentum, with downside targets at 54,250, 54,150, and 54,050. A deeper correction is likely only if Bank Nifty slips below 53,950, opening room for further declines toward 53,750, 53,650, and 53,550.
Overall, the market tone is positive with a gap up opening, but traders should stay cautious around resistance zones. Clear directional trades can be planned based on price action above 54,550 or below 54,400, with strict stop-losses to manage risk.
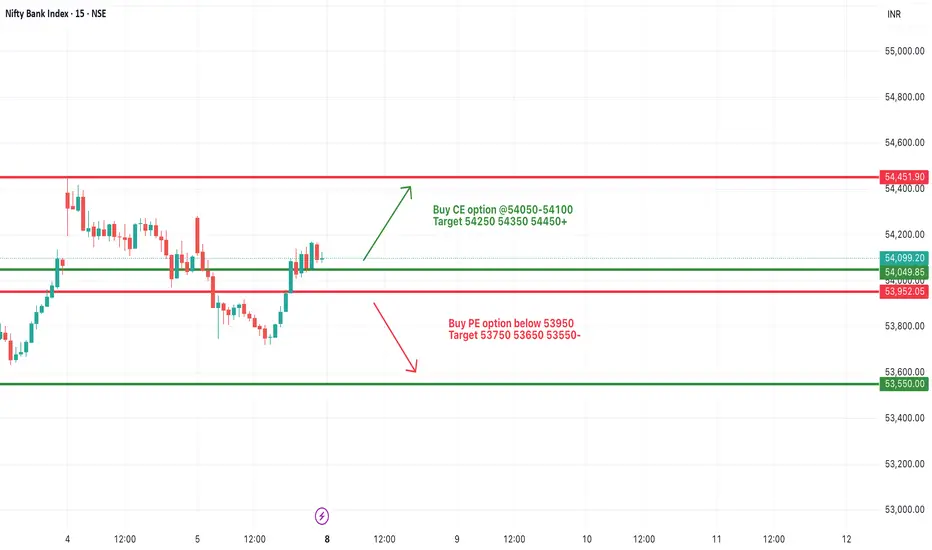
[INTRADAY] #BANKNIFTY PE & CE Levels(08/09/2025)Bank Nifty is expected to open on a flat note, suggesting a cautious start to the session after recent range-bound moves. The index has been consolidating near key levels, and traders should closely track price action for directional confirmation.
On the upside, strength can be anticipated if Bank Nifty sustains above 54,050–54,100. A move above this zone could trigger a bullish momentum, with potential upside targets at 54,250, 54,350, and 54,450+. A sustained rally beyond these levels could further strengthen the short-term bullish sentiment.
On the downside, weakness may emerge if the index breaks below 53,950. A fall under this support may lead to further declines toward 53,750, 53,650, and 53,550. These levels will act as critical intraday supports, and a breakdown could open the gates for deeper correction.
Overall, with a flat opening on the cards, Bank Nifty is likely to remain volatile within the defined range. Traders should watch for a breakout above 54,100 or a breakdown below 53,950 for clear intraday opportunities, while keeping a strict stop-loss to manage risk effectively.
[INTRADAY] #BANKNIFTY PE & CE Levels(05/09/2025)Bank Nifty is expected to see a slightly gap up opening, continuing the positive sentiment from yesterday’s recovery. The index has been trading in a defined range, and today’s move will be crucial in deciding the intraday trend.
On the upside, a sustained move above 54,050–54,100 will open the door for further strength. In this case, traders can look to buy CE options with immediate upside targets at 54,250, 54,350, and 54,450+. A breakout above 54,550 will act as a major trigger for momentum, potentially extending the rally towards 54,750, 54,850, and 54,950+.
On the downside, if Bank Nifty slips below 54,450–54,400 levels, selling pressure may build up again. In that scenario, PE options can be considered, with downside targets at 54,250, 54,150, and 54,050. A further breakdown below 53,950 will add to the bearish momentum, dragging the index towards 53,750, 53,650, and 53,550 levels.
Overall, with a slightly gap up opening, Bank Nifty remains in a critical zone where both upside breakout and downside reversal are possible.

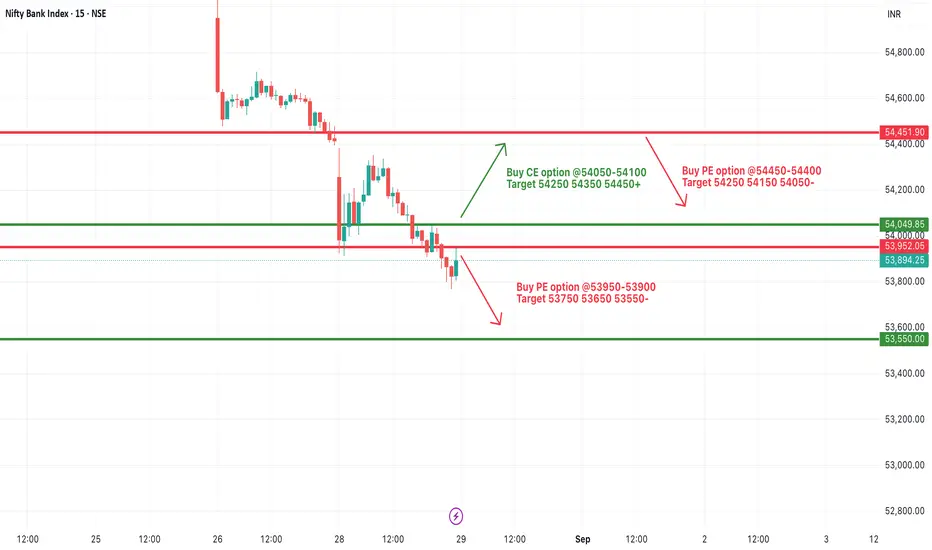
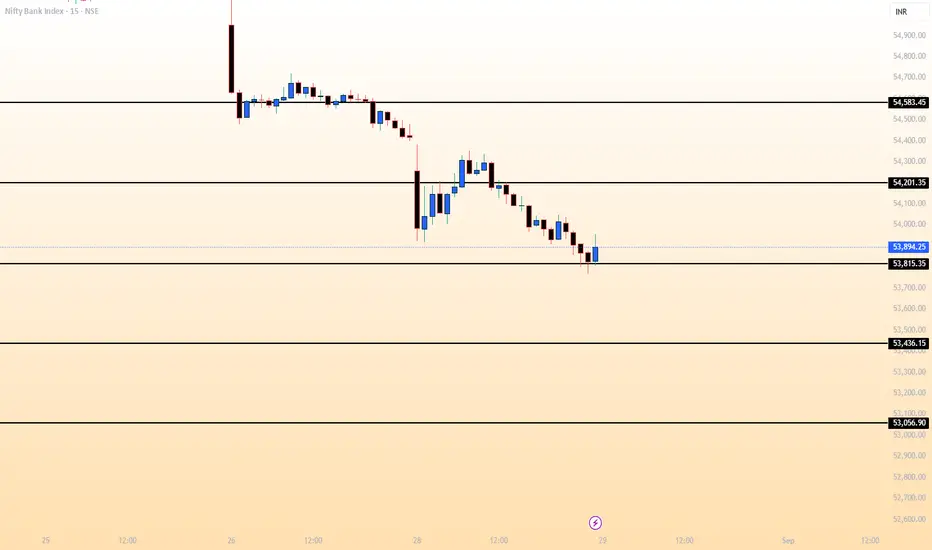
[INTRADAY] #BANKNIFTY PE & CE Levels(29/08/2025)Bank Nifty is likely to witness a slightly gap-up opening today after a weak closing in the previous session. The index is currently hovering near the 53,900 zone, which is a key support area for intraday sentiment. If Bank Nifty sustains above 54,050, it may trigger a short-term correction rally, paving the way for an upside move toward 54,250, 54,350, and 54,450+. This zone will act as a crucial resistance, and only a strong breakout above it can confirm further recovery.
On the downside, failure to hold 54,000–53,950 levels may keep the pressure intact. A breakdown below 53,950 could extend the fall toward 53,750, 53,650, and 53,550. Traders should remain cautious as volatility is expected, and intraday price action near these levels will decide the direction for the day.
Overall, Bank Nifty remains in a weak-to-neutral zone, but a sustained close above 54,050 may provide relief for bulls. Traders are advised to maintain strict stop losses and look for opportunities in line with intraday momentum.
BANKNIFTY MATHEMATICAL LEVELS These Levels are based on purely mathematical calculations.
How to use these levels :-
* Mark these levels on your chart.
* Safe players Can use 15 min Time Frame
* Risky Traders Can use 5 min. Time Frame
* When Candle give Breakout / Breakdown to any level we have to enter with High/Low of that breaking candle.
* Targets will be another level marked on chart
* Stop Loss will be Low/High of that Breaking Candle.
* Trail your SL with every candle.
* Avoid Big Candles as SL will be high then.
* This is one of the Best Risk Reward Setup.
For Educational purpose only
[INTRADAY] #BANKNIFTY PE & CE Levels(28/08/2025)Bank Nifty is expected to witness a gap-down opening today, reflecting weakness in sentiment as the index continues to face selling pressure. The price action has slipped below the 54,450–54,400 zone, which now acts as a crucial resistance level for the day. Sustained trading below this zone may trigger further downside moves, with immediate support seen at 54,250 and 54,150. A break below these levels could accelerate weakness toward 54,050 and extend further toward 53,750–53,550 zones.
On the upside, recovery attempts will gain strength only if Bank Nifty manages to reclaim 54,550–54,600 levels. In such a case, a pullback rally could push the index towards 54,750, 54,850, and 54,950. However, this zone is likely to act as a strong hurdle unless broader sentiment improves.
Overall, the bias remains negative as long as the index trades below 54,450, with traders advised to maintain a cautious approach. Intraday moves are expected to remain volatile, and strict risk management will be key to navigating today’s session.

[INTRADAY] #BANKNIFTY PE & CE Levels(25/08/2025)Bank Nifty is expected to open with a slight gap up today, hinting at a mildly positive start after the recent corrective move. However, the index continues to trade near crucial support levels, and price action in the early session will be important to decide intraday direction.
On the upside, strength will only be visible if Bank Nifty sustains above 55,550–55,600. In that case, a recovery rally can be seen towards 55,750, 55,850, and 55,950+, with further momentum opening the path towards 56,000 levels. Sustaining above 56,000 could provide the much-needed confidence for bulls to regain control.
On the downside, if the index fails to hold above 55,150 and slips below 55,000, fresh weakness may emerge. In such a scenario, immediate targets will be around 54,750, 54,650, and 54,550 levels. A decisive breakdown below 54,550 could invite deeper selling pressure, dragging Bank Nifty closer to the 54,300–54,200 zone.
Overall, the index is at a delicate stage where bulls need to defend higher zones, while bears are looking for a breakdown below key support levels. Traders are advised to stay cautious, follow strict stop losses, and book partial profits at important levels.

BANKNIFTY MATHEMATICAL LEVELSThese Levels are based on purely mathematical calculations.
How to use these levels :-
* Mark these levels on your chart.
* Safe players Can use 15 min Time Frame
* Risky Traders Can use 5 min. Time Frame
* When Candle give Breakout / Breakdown to any level we have to enter with High/Low of that breaking candle.
* Targets will be another level marked on chart
* Stop Loss will be Low/High of that Breaking Candle.
* Trail your SL with every candle.
* Avoid Big Candles as SL will be high then.
* This is one of the Best Risk Reward Setup.
For Educational purpose only

BANKNIFTY MATHEMATICAL LEVELS These Levels are based on purely mathematical calculations.
How to use these levels :-
* Mark these levels on your chart.
* Safe players Can use 15 min Time Frame
* Risky Traders Can use 5 min. Time Frame
* When Candle give Breakout / Breakdown to any level we have to enter with High/Low of that breaking candle.
* Targets will be another level marked on chart
* Stop Loss will be Low/High of that Breaking Candle.
* Trail your SL with every candle.
* Avoid Big Candles as SL will be high then.
* This is one of the Best Risk Reward Setup.
For Educational purpose only

banknifty chart analysis newbanknifty pure price action chart analysis. you can see how
will banknifty move....see chart you can understand.
BANKNIFTY MATHEMATICAL LEVELSThese Levels are based on purely mathematical calculations.
How to use these levels :-
* Mark these levels on your chart.
* Safe players Can use 15 min Time Frame
* Risky Traders Can use 5 min. Time Frame
* When Candle give Breakout / Breakdown to any level we have to enter with High/Low of that breaking candle.
* Targets will be another level marked on chart
* Stop Loss will be Low/High of that Breaking Candle.
* Trail your SL with every candle.
* Avoid Big Candles as SL will be high then.
* This is one of the Best Risk Reward Setup.
For Educational purpose only

[INTRADAY] #BANKNIFTY PE & CE Levels(07/08/2025)Bank Nifty is expected to open flat near the 55,400–55,450 zone, which has acted as a pivotal area in the recent sessions. The index has shown repeated price action around this level, suggesting a phase of consolidation. A breakout from this zone could lead to a directional move.
If the index manages to sustain above the 55,550–55,600 level, it may trigger bullish momentum with potential upside targets at 55,750, 55,850, and 55,950+. This zone is crucial as it aligns with previous resistance areas and could attract fresh buying interest on a breakout.
Conversely, if Bank Nifty fails to hold above the 55,450–55,400 support band and starts trading lower, it could initiate a downward move toward 55,250, 55,150, and 55,050-. A break below 54,950 may accelerate the decline, opening the way toward 54,750, 54,650, and even 54,550-.

A possible Head and Shoulder formation in BankniftyChance of a head and shoulder formation on the hourly chart of the Index.
If the market clears the resistance line around 57300, it can form another high or test the recent high made.
On the lower side, there is are support and it may respect the support levels.
Major support levels :- 56800, 56640
Resistance levels :- 57285, 57600
Wait for the market to move above the neck line for any bullish trade to enter in the index. Else bearish trade can be initiated below 56650 levels.
Watch for the price action near the price levels before entering the trade.

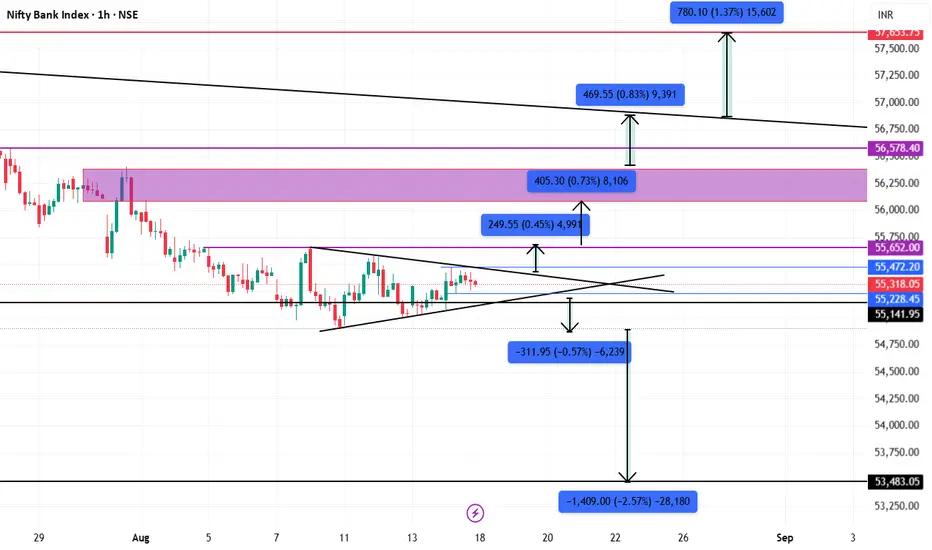
Banknifty Swing AnalysisBank nifty potentially is in a corrective wave, the downside forecast has been marked. Currently it is still in wave A. If wave A is impulsive and current rally lacks momentum/divergent on RSI, then it's likely wave B. This bull trap could lure traders thinking a new uptrend has begun, only to be followed by wave C collapse.

BANKNIFTY - Trading levels and Plan for 18-Jul-2025📊 BANK NIFTY INTRADAY TRADING PLAN – 18-Jul-2025
Gap Opening Reference: 200+ Points Considered Significant
📍 IMPORTANT LEVELS TO MONITOR
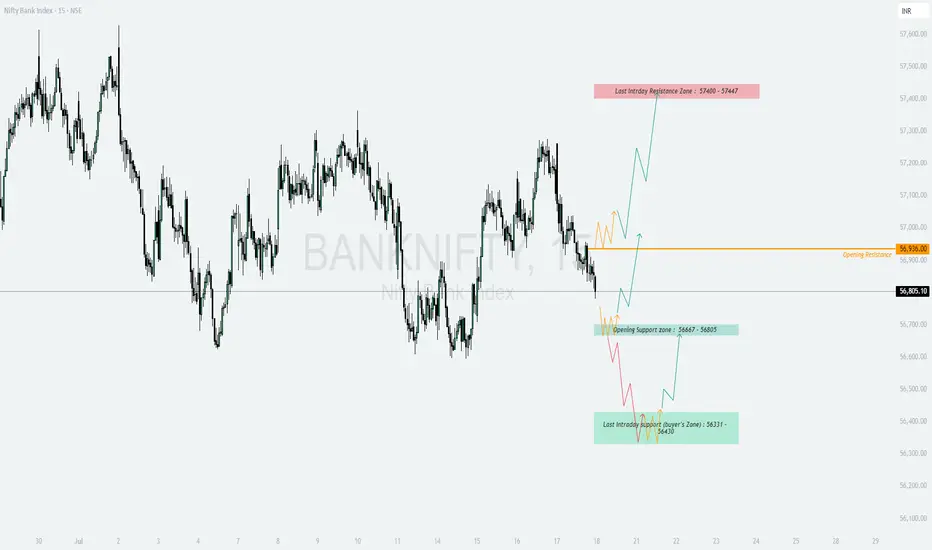
🟥 Last Intraday Resistance Zone: 57,400 – 57,447
🟧 Opening Resistance: 56,936
🟩 Opening Support Zone: 56,667 – 56,605
🟢 Last Intraday Support (Buyer’s Zone): 56,331 – 56,430
🚀 SCENARIO 1: GAP-UP OPENING (Above 57,136) 📈
(Gap opening considered above 200+ points from the previous close)
If Bank Nifty opens above 57,136 , strength is expected toward Last Intraday Resistance Zone: 57,400 – 57,447 .
Avoid buying immediately after the opening candle; allow 15–30 minutes for price confirmation and volatility settlement.
If price sustains above 57,400 , upside momentum may continue, but consider trailing your stop-loss as this is an exhaustion zone.
Options Tip: Consider ATM or slightly OTM Call Options or Bull Call Spread setups for controlled risk.
📊 SCENARIO 2: FLAT OPENING (Between 56,667 – 56,936) ⚖️
This range marks the equilibrium between buyers and sellers, as defined by Opening Support Zone and Opening Resistance .
Observe the first 15–30 minute candle for clear direction.
If price sustains above 56,936 , bias turns bullish toward 57,400 – 57,447 .
If price breaks below 56,667 , sellers may push Bank Nifty toward Buyer’s Zone: 56,331 – 56,430 .
Options Tip: Employ Strangle or Iron Fly strategies around flat openings with tight ranges.
📉 SCENARIO 3: GAP-DOWN OPENING (Below 56,467) ⚠️
If Bank Nifty opens below 56,467 , downside momentum may accelerate toward Last Intraday Support: 56,331 – 56,430 .
Avoid instant selling at open. Let first 15–30 minute candle give direction clarity.
If price sustains below 56,331 , weakness could extend further.
Options Tip: Focus on ATM or ITM Put Options , or Bear Put Spreads for safer downside positioning.
💡 OPTIONS TRADING RISK MANAGEMENT TIPS
📏 Risk no more than 1–2% of your capital on any single trade.
⏳ Give at least 15–30 minutes after market open before initiating trades.
🔐 Use Hourly Close-based Stop Losses to avoid getting trapped by wicks.
⚖️ Prefer hedged strategies ( Spreads, Iron Fly, Strangles ) during high IV (Implied Volatility) phases.
🚫 Avoid revenge trading. Accept stop-loss gracefully; focus on next setup.
📌 SUMMARY & CONCLUSION
Bullish Bias: Gap-up above 57,136 → Focus on 57,400–57,447 zone.
Range-bound Bias: Flat between 56,667–56,936 → Watch for breakout confirmation.
Bearish Bias: Gap-down below 56,467 → Eye on 56,331–56,430 support zone.
Prioritize confirmation from 15–30 minute opening range before acting.
Maintain strict risk management discipline using options tools like spreads.
⚠️ DISCLAIMER: I am not a SEBI-registered analyst. This trading plan is shared strictly for educational and informational purposes. Please consult your financial advisor before making any trading or investment decisions.
BANKNIFTY MATHEMATICAL LEVELSThese Levels are based on purely mathematical calculations.
How to use these levels :-
* Mark these levels on your chart.
* Safe players Can use 15 min Time Frame
* Risky Traders Can use 5 min. Time Frame
* When Candle give Breakout / Breakdown to any level we have to enter with High/Low of that breaking candle.
* Targets will be another level marked on chart
* Stop Loss will be Low/High of that Breaking Candle.
* Trail your SL with every candle.
* Avoid Big Candles as SL will be high then.
* This is one of the Best Risk Reward Setup.
For Educational purpose only
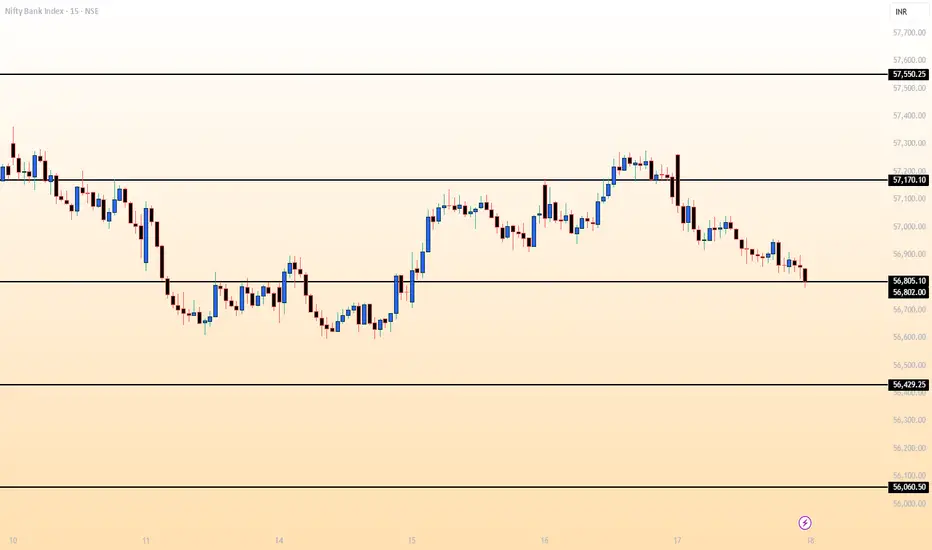
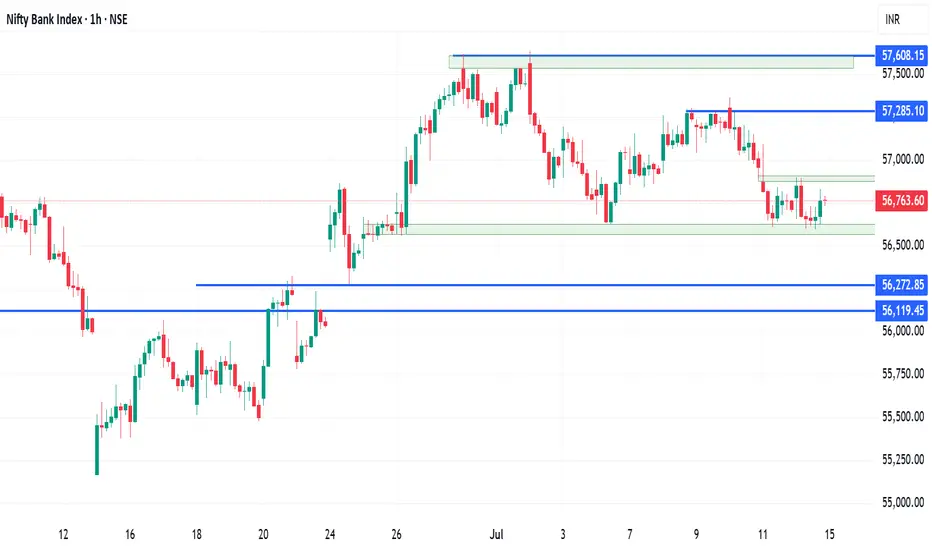
Banknifty analysis for the upcoming movement in the index.Banknifty has been trading in a range for a long time and is now trading around the support levels of 56600.
The RSI indicator on the daily charts is showing some bearish divergence and today the market has taken a halt after 2 days of fall.
If the market starts travelling on the lower side there are chances of testing the lower support level of 56120.
The market has been trading in a range of 56600 to 57600. And the support is tested many a times.
Bullish trades can be initiated for intraday play only once the market starts sustaining above today's high of 56900.
Moving averages are also forming a resistance gate around the resistance level. Watch for the breakout and enter only on the retest of the levels.
Major support levels :- 56600, 56270, 56120
Resistance levels :- 56900, 57285
Wait for the price action and trade according to the price action.
BANKNIFTY MATHEMATICAL LEVELS These Levels are based on purely mathematical calculations.
How to use these levels :-
* Mark these levels on your chart.
* Safe players Can use 15 min Time Frame
* Risky Traders Can use 5 min. Time Frame
* When Candle give Breakout / Breakdown to any level we have to enter with High/Low of that breaking candle.
* Targets will be another level marked on chart
* Stop Loss will be Low/High of that Breaking Candle.
* Trail your SL with every candle.
* Avoid Big Candles as SL will be high then.
* This is one of the Best Risk Reward Setup.
For Educational purpose only

BANKNIFTY MATHEMATICAL LEVELSThese Levels are based on purely mathematical calculations.
How to use these levels :-
* Mark these levels on your chart.
* Safe players Can use 15 min Time Frame
* Risky Traders Can use 5 min. Time Frame
* When Candle give Breakout / Breakdown to any level we have to enter with High/Low of that breaking candle.
* Targets will be another level marked on chart
* Stop Loss will be Low/High of that Breaking Candle.
* Trail your SL with every candle.
* Avoid Big Candles as SL will be high then.
* This is one of the Best Risk Reward Setup.
For Educational purpose only

BNAKNIFTY MATHEMATICAL LEVELSThese Levels are based on purely mathematical calculations.
How to use these levels :-
* Mark these levels on your chart.
* Safe players Can use 15 min Time Frame
* Risky Traders Can use 5 min. Time Frame
* When Candle give Breakout / Breakdown to any level we have to enter with High/Low of that breaking candle.
* Targets will be another level marked on chart
* Stop Loss will be Low/High of that Breaking Candle.
* Trail your SL with every candle.
* Avoid Big Candles as SL will be high then.
* This is one of the Best Risk Reward Setup.
For Educational purpose only
