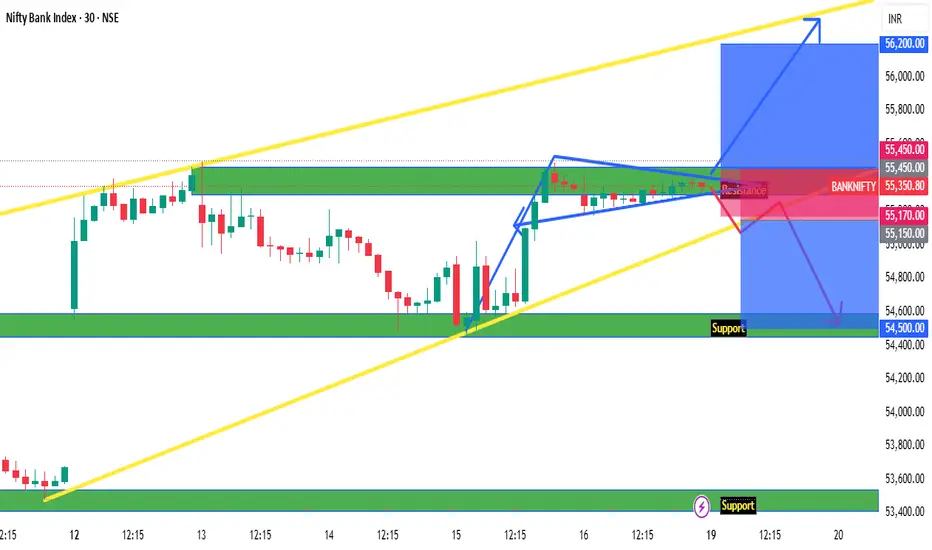
Banknifty Intraday Levels : 19-May-25BankNifty at Resistance and closed above of 55200, formed bullish flag,
Also above Trendline Support on 30 Min Timeframe.
Important zones mentioned on chart
Bearish < 55150
Bullish > 55450
Wait for Proper Rejection/Pattern :
@Support : Bullish
@Resistance : Bearish
*All views for educational purpose only
Bankniftylevels
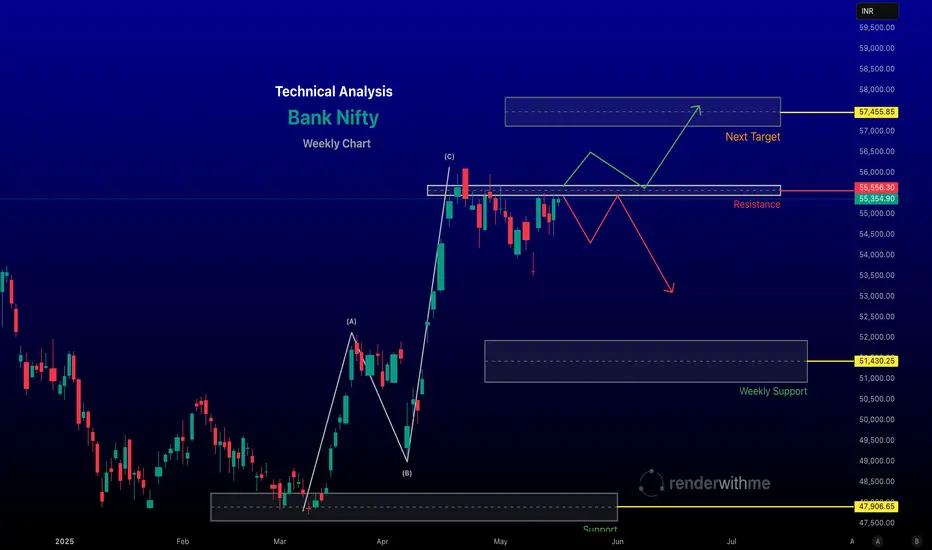
Bank Nifty Weekly Technical Analysis for May 19–23, 2025
#Current Market Context
Latest Close (May 16, 2025): The Bank Nifty closed at 55,354.driven by strong performances in banking heavyweights like HDFC Bank, ICICI Bank, and SBI.
Recent Performance: The index has been volatile but bullish, breaking above the 55,700 mark for further Bullish, However, it faced resistance near 55,500, indicating profit-booking pressure.
Market Sentiment: Positive global cues (softening oil prices, US market gains, and a stronger Indian rupee at ~83.90) and domestic factors (government capex, strong credit growth) are supportive. However, global uncertainties (e.g., US Fed rate expectations, geopolitical tensions) and FII flow reversals pose risks.
#Technical Analysis
- Price Action and Trend
Current Trend: The Bank Nifty is in a uptrend within an ascending channel on the daily chart, reflecting bullish momentum. On the 4-hour chart, it recently broke out of a consolidation zone near 52,500–53,000, signalling potential for further upside if it sustains above 56,000.
Chart for your reference
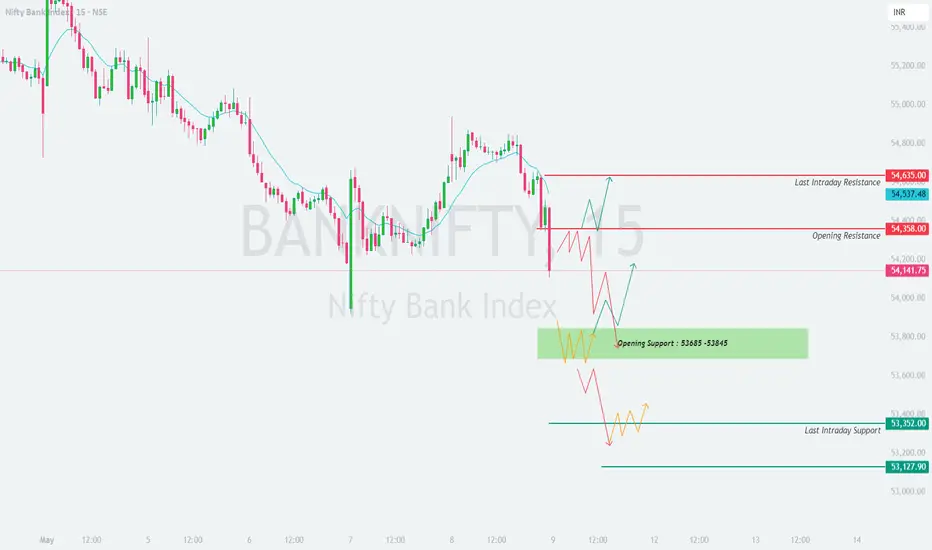
BANKNIFTY : Trading levels and Plan for 09-May-2025📅 Bank Nifty Trading Plan for 09-May-2025
🕘 Timeframe: 15-minute chart
📊 Structure Analysis: Bearish price action observed with a sharp sell-off post resistance test. Price is currently below both the 9-EMA and major resistance levels.
Opening Scenarios: 📈📉
🔺 Gap-Up Opening (200+ points above previous close): Potential open above 54,350
If Bank Nifty opens with a gap-up above the Opening Resistance (54,358) , the index may test the next resistance at 54,635 (Last Intraday Resistance) . However, since the broader structure is weak, aggressive longs should only be considered if the price sustains above 54,635 with strong volume confirmation.
✅ Action Plan:
Wait for 15–30 minutes for price stabilization.
If price sustains above 54,635, consider CE options with a tight SL below 54,500.
If the gap-up gets sold off and the index trades below 54,358 again, look for PE opportunities targeting 54,100–54,000 levels.
📌 Avoid chasing the open blindly. Wait for a clear breakout-retest pattern for confirmation.
➖ Flat Opening (within ±200 points): Near 54,100
A flat opening near the CMP of 54,141 places the index right between major resistance and a key support zone. It could be a volatile zone with whipsaws on both sides.
✅ Action Plan:
Observe price behavior near 54,358 .
A rejection at this level can lead to selling pressure toward the Green Support Zone (53,685–53,845) .
A breakout and hold above 54,358 could lead to a rally toward 54,635.
Ideal play here is range-based trading : Buy near support (if price confirms reversal), Sell near resistance.
💡 Use options with delta closer to 0.5 for better reward if price remains rangebound.
🔻 Gap-Down Opening (200+ points below previous close): Below 53,900
A gap-down near or below the Opening Support Zone (53,685–53,845) suggests bearish continuation. If this zone fails to hold, the index could slide toward the next support at 53,127 .
✅ Action Plan:
Watch for reversal patterns in the support zone (e.g., hammer candle, bullish engulfing).
If reversal is confirmed, consider aggressive CE trades with a SL just below 53,685.
If 53,685 breaks decisively, ride the trend using PE options, targeting 53,127.
Do not attempt to catch the falling knife unless clear bullish patterns form.
📛 Protect capital by avoiding counter-trend trades in panic selling.
🛡️ Risk Management Tips for Options Traders
💡 Always use defined stop-loss , especially when trading naked options.
💰 Do not risk more than 2% of your capital per trade .
📅 Avoid holding weekly options till expiry if VIX is rising – time decay and volatility swings can hurt.
📉 Avoid averaging losers – better to re-enter on confirmation.
🔎 Use OI data and volume breakouts to time entries on options.
📌 Summary & Key Levels to Watch:
🔺 Major Resistance Zones: 54,358 → 54,635
🟩 Support Zone: 53,685–53,845
🔻 Breakdown Level: Below 53,685 may trigger a fall toward 53,127
📍 CMP: 54,141.75 – stuck in a volatile zone, so direction will likely emerge after 15–30 min of opening.
📢 Disclaimer:
I am not a SEBI-registered analyst . This analysis is shared for educational purposes only. Please do your own research or consult a financial advisor before making any trading decisions
Bank nifty Futures 08.05.25Expecting a gap up to flat opening. May get a morning move on the upside. However overall, we have a bearish structure on higher TF. My strategy for the day will be to sell on rise. Incase I do not get a downward move will prefer to stay out of the markets.

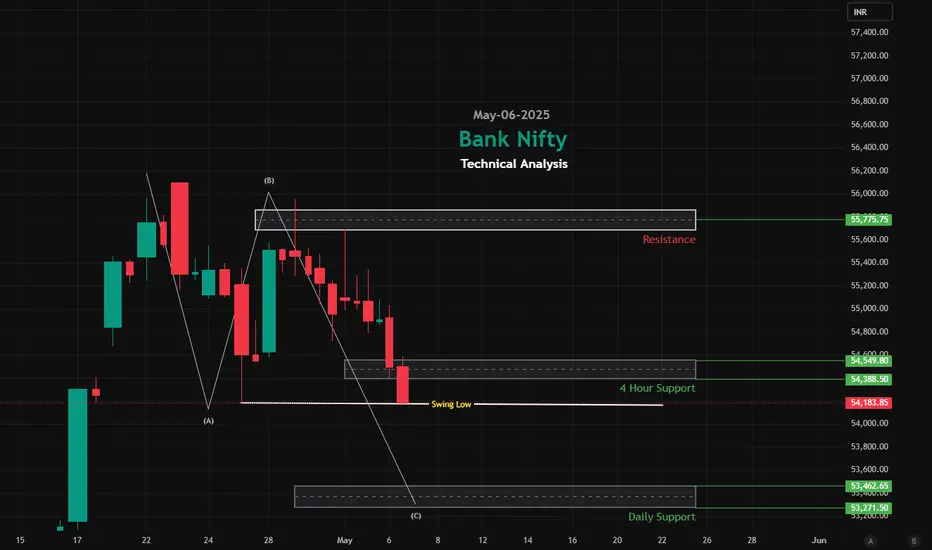
The Bank Nifty index,shows a bearish biasThe Bank Nifty index, as of May 6, 2025, shows a bearish bias in its intraday performance, with key technical levels and indicators suggesting cautious trading. Here's a detailed technical analysis based on available data:
#Current Price and Trend
Closing Price (May 2, 2025): 55,115.35, up 28.20 points (+0.05%)
Current Price (May 6, 2025): Around 54,550, down 0.7% from the opening at 54,918
Trend: Neutral with a bearish bias. The index has declined from its opening, forming weak candles on the daily chart, indicating hesitation and potential profit booking near resistance zones.
#Key Support and Resistance Levels
Support:
Immediate support at 53,500 (spot). This zone is critical, as a breach could lead to further downside toward 52,600 or 52,450.
Resistance - 54,400 to 54,500 it can retest and then for the further downside.
BANKNIFTY - Trading levels and Plan for 29-Apr-2025📈 BANKNIFTY 15-Min Plan for 29-Apr-2025 📈
(Chart-Based Educational View | Gap Opening >200 Points Considered)
➖➖➖➖➖➖➖➖
🔵 Previous Close: 55,428.10
⚡ Key Reference Levels:
🔴 Opening Resistance: 55,577
🟧 Opening Support: 55,069
🟩 No Trade Zone: 55,075 – 54,879
🟢 Last Intraday Support: 54,872
🟢 Major Support Below: 54,477
🔴 Major Resistance Above: 55,918 ➡️ 56,180
➖➖➖➖➖➖➖➖
🟥 Scenario 1: Gap-Up Opening (Above 55,600)
If Bank Nifty opens above 55,600 , it will open near or slightly above the Opening Resistance (55,577) .
Immediate plan would be to wait and watch the first 15 minutes. If the price sustains above 55,577 without heavy rejection, a quick up-move towards 55,918 and then possibly 56,180 is likely.
🚀 On successful breakout, aggressive buyers can plan long entries with a strict stop-loss below 55,577 .
However, if rejection happens near 55,600–55,650 zone (evident by bearish candles), a quick dip back to 55,428 or even lower till 55,069 can occur.
🎯 In case of rejection, better to play conservative shorts targeting intraday supports but always with a protective stop-loss.
📚 Educational Note: Gaps near resistance zones often face selling pressure initially. Confirmation through strong candles is vital before chasing a breakout.
🟨 Scenario 2: Flat Opening (Between 55,200–55,600)
If Bank Nifty opens between 55,069 and 55,577 , focus heavily on the behavior near Opening Support 55,069 and Opening Resistance 55,577 .
🔎 If price sustains above 55,428–55,450 in the first 15–30 minutes, it can attempt a breakout towards 55,577.
⚡ A breakout above 55,577 on volume confirmation can invite fresh buying targeting 55,918.
If Bank Nifty starts slipping below 55,069 , it will enter the No Trade Zone (55,075–54,879) where whipsaws are possible. Avoid aggressive trades in this zone unless clear momentum appears. 📉 A decisive breakdown below 54,879 can lead to a fast dip toward 54,477.
📚 Educational Note: In flat openings, let the market define its trend. Neutral openings often trap both buyers and sellers initially. Clarity usually emerges after 30 minutes.
🟩 Scenario 3: Gap-Down Opening (Below 55,000)
If Bank Nifty opens below 55,000 , it would be opening near the Opening Support and may directly test the Last Intraday Support (54,872) .
🔥 If price sustains below 54,879 , aggressive shorts can be planned with targets towards 54,477 initially.
🛑 However, if strong bullish reversal signs (like hammer candles or bullish divergences) are seen around 54,872–54,477, a quick sharp pullback is very much possible.
🚀 In that case, a low-risk long opportunity can arise with small stop-losses just below the low of reversal candle.
❌ Avoid aggressive longs immediately in gap-downs unless a proper reversal pattern confirms.
📚 Educational Note: Gap-downs tend to either extend downtrend quickly or reverse sharply. Emotional trades must be avoided unless the setup is clear.
➖➖➖➖➖➖➖➖
📌 Risk Management Tips for Options Trading 🛡️
Always define a fixed stop-loss in options trading. Premiums decay faster than you expect!
Avoid taking trades within first 5 minutes of opening chaos. Observe initial volatility.
Use Bull Call Spreads or Bear Put Spreads when IV (Implied Volatility) is too high to minimize premium loss.
Position sizing is crucial: Risk only 1–2% of your total capital per trade.
Keep a timer! If the trade doesn't move in your favor within 15–30 minutes after entry, better to exit or trail SL aggressively.
Don’t convert intraday option trades into positional trades just because it is in loss. Stick to your timeframe!
➖➖➖➖➖➖➖➖
📜 Summary and Conclusion:
✅ Gap-Up Opening: Play for breakout above 55,577 or short if rejection seen.
✅ Flat Opening: Focus between 55,069–55,577; avoid trades inside No Trade Zone unless momentum emerges.
✅ Gap-Down Opening: Watch 54,872–54,477 area closely for breakdown or reversal plays.
🎯 Stay patient, wait for confirmation, and stick to disciplined entries.
🧠 In volatile markets, protecting your capital is your biggest edge.
➖➖➖➖➖➖➖➖
⚠️ Disclaimer:
I am not a SEBI-registered analyst. The views shared here are purely for educational purposes. Please consult your financial advisor before making any trading decisions.

Bank Nifty Futures 25.04.25Expecting a gap down opening. My Strategy will be to sell on rise. Will be following MP and OF. Will be taking Trades at important areas / as per absorption of buyers.

Bank nifty Futures 24.04.25Expecting a flat to a gap up opening. More likely a neutral/ balanced day. Buyers are going to struggle but may defend. So, need to be careful and watch OF and MP. We may get movement on both sides.

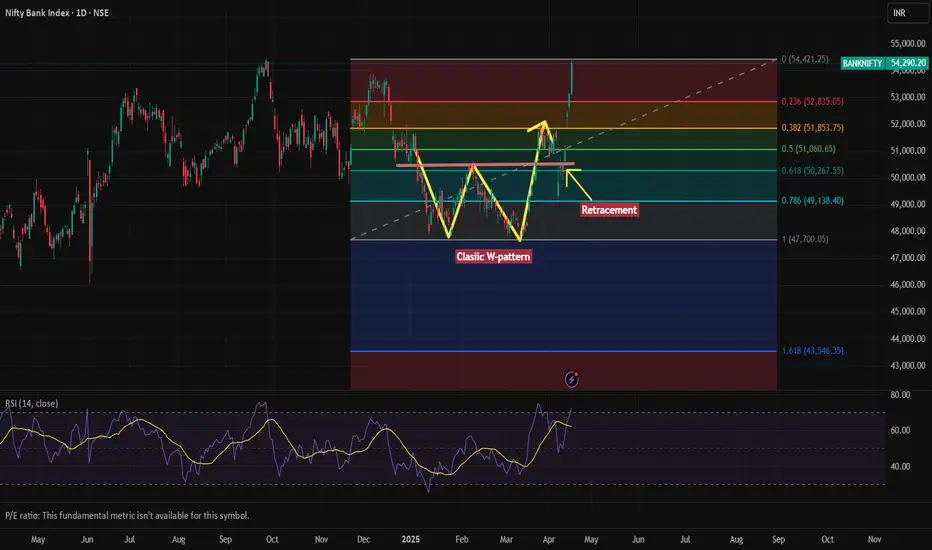
Bank Nifty Breaks Out: Classic W-Pattern Signals Bullish MomentuThis chart represents the **Nifty Bank Index** (BANKNIFTY) on a daily timeframe and showcases a technical analysis using:
1. **Fibonacci Retracement Levels**
2. **A Classic W-Pattern (Double Bottom)**
3. **RSI (Relative Strength Index)** at the bottom
---
### 🔍 **Pattern Analysis**
#### 📈 Classic W-Pattern (Double Bottom)
- A W-pattern, also called a double bottom, typically indicates a **reversal from a downtrend to an uptrend**.
- It’s clearly marked in yellow, showing the index formed two distinct lows around the same level.
- This formation was followed by a **bullish breakout** above the neckline (horizontal resistance), confirming the pattern.
---
### 🔢 **Fibonacci Retracement Levels**
- The retracement tool is drawn from the swing high (around 54,421) to the swing low (around 43,546).
- Key levels marked:
- **0.236 (52,835)**
- **0.382 (51,853)**
- **0.5 (51,060)**
- **0.618 (50,267)**
- **0.786 (49,138)**
- The price **retraced to the 0.5-0.618 level** (a strong support zone) before resuming its uptrend — a typical bullish retracement behavior.
---
### 🔄 **Recent Breakout & Momentum**
- After retesting the neckline (as indicated by the arrow labeled “Retracement”), the price **broke above previous highs**, signaling strong bullish momentum.
- The latest candle shows a significant upward move, closing around **54,290**, very close to the **previous high of 54,421**, suggesting a potential **breakout into uncharted territory** if volume supports it.
---
### 📊 **RSI Indicator**
- RSI is around **72**, entering the **overbought zone (>70)**.
- This indicates **strong bullish momentum**, but could also suggest a potential for **short-term consolidation or minor correction**.
---
### ✅ Summary
- **Trend**: Strong bullish trend confirmed by W-pattern breakout and higher highs.
- **Support Levels**: 51,060 (0.5) and 50,267 (0.618) are key support zones.
- **Resistance**: Immediate resistance is the previous high at 54,421. A breakout above this could lead to new highs.
- **Momentum**: Overbought on RSI – bullish strength, but monitor for possible pullbacks.
Divergence SecretsDivergence is so effective because it reveals hidden shifts in market momentum before they show up on price charts. Here's why it's worth paying attention to: Early Signals: Divergences give you a head start by showing potential reversals before they happen.

Candle sticks pattern analysisA bullish candlestick is typically green or white and means the closing price is higher than the opening price, indicating upward momentum. Inversely, a bearish candlestick, generally red or black, signals that the closing price was lower than the opening price, reflecting downward pressure.
-If the upper wick on a red candle is short, then it indicates that the stock opened near the high of the day.
-On the other hand, if the upper wick on a green candle is short, then it indicates that the stock closed near the high of the day.

How to learn trading ?#1 Decide What Type of Trader You Want to Be.
#2 Research Brokerages and Choose One Suitable for You.
#3 Open a Brokerage Account and Fund it.
#4 Research the Stocks You Want to Own.
#5 Place Your Order to Buy or Sell Stocks.
#6 Manage Risk.
The Bottom Line.

Divergence secretsDivergence is the direction of the price, which is observed when it is moving in the opposite direction of a technical indicator.
When a stock diverges from its path, it is said to go through a trend reversal in the stock market. So, for example, if the security is in a bullish movement, the direction change to a downward movement will be denoted as a trend reversal with the downtrend.

BANKNIFTY MATHEMATICAL LEVELSThese Levels are based on purely mathematical calculations.
How to use these levels :-
* Mark these levels on your chart.
* Safe players Can use 15 min Time Frame
* Risky Traders Can use 5 min. Time Frame
* When Candle give Breakout / Breakdown to any level we have to enter with High/Low of that breaking candle.
* Targets will be another level marked on chart
* Stop Loss will be Low/High of that Breaking Candle.
* Trail your SL with every candle.
* Avoid Big Candles as SL will be high then.
* This is one of the Best Risk Reward Setup.
For Educational purpose only
Basics of RSIThe Relative Strength Index (RSI) is a momentum oscillator that measures the speed and magnitude of price changes, helping traders identify potential overbought or oversold conditions, oscillating between 0 and 100.

Nifty Bank Index (BANKNIFTY) Analysis & Trade Setup Timeframes & Context
We have three different timeframes: Daily (1D), 4-Hour (4H), and 1-Hour (1H).
1D gives us the macro view, showing key liquidity zones, order blocks (OBs), and break of structure (BOS).
4H refines our zones, helping to confirm areas of interest.
1H is the execution timeframe, where we define entry, stop-loss, and profit targets.
1️⃣ Higher Timeframe Bias - Daily Chart
📌 Key Observations:
A strong rejection from a higher timeframe supply zone near 52,000 - 52,400.
A liquidity grab (buy-side liquidity sweep) followed by a market structure shift (MSS) confirms bearish intent.
Break of Structure (BOS) indicates a downward trend continuation.
Fair Value Gaps (FVGs) suggest imbalance that the price may revisit before continuation.
📌 Bias: Bearish, expecting price to move lower.
📌 Key Levels:
Supply Zone (Resistance): 51,800 - 52,400
Demand Zone (Support): 48,000 - 49,000
Potential Target: 49,000 (near previous liquidity and OB)
2️⃣ Mid-Timeframe Confirmation - 4H Chart
📌 Key Observations:
A strong volume imbalance (VI) after the downward move.
Price has consolidated inside a 1H Fair Value Gap (FVG), signaling a possible retracement.
The previous low at 50,750 is being tested multiple times, suggesting liquidity is building.
📌 Bias: Bearish
Looking for a retracement to 51,200 - 51,400 (FVG area) before continuing downward.
Break below 50,750 confirms further selling.
📌 Key Levels:
Resistance: 51,200 - 51,400 (FVG + OB)
Support: 50,400 (short-term), 49,500 (major)
3️⃣ Entry Plan - 1H Execution Chart
📌 Trade Idea:
Wait for price to retest 51,200 - 51,400 (FVG zone).
If we see rejection (e.g., bearish engulfing candle or liquidity sweep), enter a short trade.
📌 Trade Parameters:
Entry: 51,200 - 51,400
Stop Loss: 51,600 (above OB)
Target 1 (T1): 50,400
Target 2 (T2): 49,500
Risk-Reward Ratio (RRR): ~1:3 or better
📌 Alternative Scenario:
If price breaks above 51,600, we invalidate the short setup.
In that case, we will reassess for a bullish continuation.
BANKNIFTY MATHEMATICAL LEVELSThese Levels are based on purely mathematical calculations.
How to use these levels :-
* Mark these levels on your chart.
* Safe players Can use 15 min Time Frame
* Risky Traders Can use 5 min. Time Frame
* When Candle give Breakout / Breakdown to any level we have to enter with High/Low of that breaking candle.
* Targets will be another level marked on chart
* Stop Loss will be Low/High of that Breaking Candle.
* Trail your SL with every candle.
* Avoid Big Candles as SL will be high then.
* This is one of the Best Risk Reward Setup.
For Educational purpose only
BankNifty levels - Mar 25, 2025Utilizing the support and resistance levels of BankNifty, along with the 5-minute timeframe candlesticks and VWAP, can enhance the precision of trade entries and exits on or near these levels. It is crucial to recognize that these levels are not static, and they undergo alterations as market dynamics evolve.
The dashed lines on the chart indicate the reaction levels, serving as additional points of significance. Furthermore, take note of the response at the levels of the High, Low, and Close values from the day prior.
We trust that this information proves valuable to you.
* If you found the idea appealing, kindly tap the Boost icon located below the chart. We encourage you to share your thoughts and comments regarding it.
Wishing you successful trading endeavors!

Bank Nifty SpotBank NIfty Spot
for 24 - 28 March 2025
last week NS opened @ 48219.55
gave incredible 1500+ points
The important level is 50775 (30min close) for the BNS to give a fresh breakout.
Similarly if the BNS makes a 30m close below 50775 then probably 50700 PE can be a best bet for options players....
Again exiting position at a level mentioned below that...
Level to level trading is recommended...
Happy trading and Profit making with proper planning..
Like.. Share.. Comment...

BankNifty levels - Mar 24, 2025Utilizing the support and resistance levels of BankNifty, along with the 5-minute timeframe candlesticks and VWAP, can enhance the precision of trade entries and exits on or near these levels. It is crucial to recognize that these levels are not static, and they undergo alterations as market dynamics evolve.
The dashed lines on the chart indicate the reaction levels, serving as additional points of significance. Furthermore, take note of the response at the levels of the High, Low, and Close values from the day prior.
We trust that this information proves valuable to you.
* If you found the idea appealing, kindly tap the Boost icon located below the chart. We encourage you to share your thoughts and comments regarding it.
Wishing you successful trading endeavors!

BankNifty levels - Mar 21, 2025Utilizing the support and resistance levels of BankNifty, along with the 5-minute timeframe candlesticks and VWAP, can enhance the precision of trade entries and exits on or near these levels. It is crucial to recognize that these levels are not static, and they undergo alterations as market dynamics evolve.
The dashed lines on the chart indicate the reaction levels, serving as additional points of significance. Furthermore, take note of the response at the levels of the High, Low, and Close values from the day prior.
We trust that this information proves valuable to you.
* If you found the idea appealing, kindly tap the Boost icon located below the chart. We encourage you to share your thoughts and comments regarding it.
Wishing you successful trading endeavors!

BankNifty levels - Mar 20, 2025Utilizing the support and resistance levels of BankNifty, along with the 5-minute timeframe candlesticks and VWAP, can enhance the precision of trade entries and exits on or near these levels. It is crucial to recognize that these levels are not static, and they undergo alterations as market dynamics evolve.
The dashed lines on the chart indicate the reaction levels, serving as additional points of significance. Furthermore, take note of the response at the levels of the High, Low, and Close values from the day prior.
We trust that this information proves valuable to you.
* If you found the idea appealing, kindly tap the Boost icon located below the chart. We encourage you to share your thoughts and comments regarding it.
Wishing you successful trading endeavors!

BankNifty levels - Mar 19, 2025Utilizing the support and resistance levels of BankNifty, along with the 5-minute timeframe candlesticks and VWAP, can enhance the precision of trade entries and exits on or near these levels. It is crucial to recognize that these levels are not static, and they undergo alterations as market dynamics evolve.
The dashed lines on the chart indicate the reaction levels, serving as additional points of significance. Furthermore, take note of the response at the levels of the High, Low, and Close values from the day prior.
We trust that this information proves valuable to you.
* If you found the idea appealing, kindly tap the Boost icon located below the chart. We encourage you to share your thoughts and comments regarding it.
Wishing you successful trading endeavors!
